BRAZILIAN JOURNAL OF OCEANOGRAPHY, 56(2):73-84, 2008
EFFECTS OF DISTURBANCE AREA ON FOULING COMMUNITIES FROM A TROPICAL ENVIRONMENT: GUANABARA BAY, RIO DE JANEIRO, BRAZIL* Eduardo de Almeida Xavier; Bernardo Antonio Perez da Gama**; Tiago Filgueiras Porto; Bruno Lopes Antunes and Renato Crespo Pereira Universidade Federal Fluminense, Departamento de Biologia Marinha (Caixa Postal 100644, 24001-970, Niterói, RJ, Brasil) **Corresponding author:
[email protected]
ABSTRACT In marine fouling communities, free space is one of the key limiting resources for settlement of new organisms. In this way, removing biomass through physical disturbances would play an important role in the structure and dynamics of these communities. The disturbance size seems to be a characteristic that influences recolonization patterns, thus affecting species diversity. The aim of this study was to analyze the effects of growing disturbance areas on fouling communities. Fouling panels were allowed to develop for 6 mo. at Guanabara Bay (22°52'S, 043°08'W) prior to a single application of randomly positioned, circular physical disturbances of growing areas (7 levels, from 0 to 75% removed cover, 10 replicates per treatment). Samples were taken fortnightly after the disturbance event, so as to follow the development patterns of the community afterward. At the first sampling the diversity showed maximum indices in communities to which intermediary disturbance levels were applied. However, this profile changed later to a diversity peak in communities with higher disturbance levels. It also showed a continuous increase in richness and diversity through time until the 7th sample (110 days after the disturbance event), with subsequent decrease. Such patterns seem to corroborate the Intermediate Disturbance Hypothesis, despite the drastic profile change with time, revealing that disturbance is indeed an important factor structuring hard bottom communities at Guanabara Bay, and highlighting the importance of longer term studies of disturbance impacts in marine communities.
RESUMO Em comunidades incrustantes marinhas, o espaço livre no substrato é um dos principais recursos limitantes para o estabelecimento de novos organismos. Assim sendo, distúrbios físicos que removam biomassa se mostram importantes agentes para a estruturação e dinâmica dessas comunidades. A extensão do distúrbio é uma característica que parece afetar os padrões de recolonização, e desta forma altera a diversidade de espécies. O objetivo deste trabalho foi analisar os efeitos de áreas crescentes de distúrbio em comunidades incrustantes. Para tal, comunidades macrobentônicas incrustantes foram previamente desenvolvidas por 6 meses na Baía de Guanabara (22°52'S, 043°08'W), recebendo uma única vez distúrbios circulares, aleatoriamente posicionados, com áreas crescentes (7 níveis, de 0 a 75% da cobertura removida, 10 réplicas por nível). Amostragens quinzenais foram realizadas após o distúrbio, de modo a acompanhar os padrões de desenvolvimento das comunidades. Na primeira amostragem observou-se que índices máximos de diversidade foram obtidos nas comunidades que receberam níveis intermediários de distúrbio. No entanto, no decorrer do tempo este perfil deu lugar a um pico de diversidade nas comunidades que sofreram os maiores níveis de distúrbio. Notou-se também um incremento contínuo da riqueza e diversidade ao longo do tempo até a 7ª amostragem (110 dias após os distúrbios), com subseqüente redução a partir deste momento. Tais padrões parecem corroborar a Hipótese do Distúrbio Intermediário, embora em médio prazo o perfil da comunidade mude drasticamente, revelando que perturbações físicas representam de fato um importante fator na estruturação de comunidades marinhas de substrato consolidado da Baía de Guanabara, além de realçar a importância de estudos de maior duração na avaliação dos impactos de distúrbios em comunidades marinhas. Descriptors: Physical disturbance, Fouling community, Disturbance area, Intermediate Disturbance Hypothesis (IDH), Diversity, Guanabara Bay. Descritores: Distúrbio físico, Comunidade incrustante, Área de distúrbio, Hipótese do Distúrbio Intermediário (HDI), Diversidade, Baía de Guanabara. __________ (*) Paper presented at the 1st Brazilian Congress of Marine Biology, on 15-19 May, 2006. Rio de Janeiro. Brazil
74
BRAZILIAN JOURNAL OF OCEANOGRAPHY, 56(2), 2008
INTRODUCTION Marine hard bottom communities are constituted by sessile or semi-sessile organisms, usually displaying a high degree of interspecific competition (JACKSON; BUSS, 1975). Space for colonization and further development of newcomers is one of the main limiting resources to population increase, being sometimes monopolized by strongly competing species, which can even competitively exclude weaker competitors, thus reducing species diversity (DAYTON, 1971; JACKSON; BUSS, 1975; JACKSON, 1977; OSMAN, 1977; RUSS, 1982; BRANCH, 1984; SEBENS, 1986, SOUSA, 2001; WITMAN; DAYTON, 2001). Reproductive propagules dispersed in the environment suffer intense adversities that make their ability to settle extremely difficult in densely populated areas (SOUSA, 1984; MORGAN, 2001). Organisms already settled inhibit further settlement throughout a series of mechanisms, interfering at different stages of propagule recruitment, such as: simply making occupied space unavailable; consuming propagules (e.g., suspensivorous organisms such as ascidians, barnacles and bryozoans may filter propagules dispersed in seawater) (e.g., RUPPERT; FOX; BARNES, 2004); modifying substrate conditions, inhibiting the settlement or development of propagules that approach it, e.g., releasing allelopathic compounds – such as antifouling substances – or even reducing the supply of essential resources such as food, light, nutrients or space (SOUSA, 1984; MENGE; BRANCH, 2001; SOUSA, 2001). As a result of intense space competition, a wide variety of sessile species live as epibionts on other marine organisms (e.g., WAHL; MARK, 1999). Physical disturbance opens new space for colonization, and thus can alleviate the effects of competition for this limiting resource. In this way, disturbance seems to be an important source of heterogeneity to natural community’s structure and dynamics (SOUSA, 2001). Disturbance not only eliminates part of the community cover, but also can make nutrients available again through the decay of dead organisms. Disturbance can also diminish the density of propagule predators or parasites. However, the occupation of newly opened space by disturbance is not a phenomenon of easy prediction. Sousa (1984) lists the following elements that influence the pattern and rate of resettlement after a disturbance event: (1) morphological and reproductive characters of the species present at the place when disturbance happens, which determine, in part, the likelihood of species survival to disturbance and might rapidly reoccupy emptied spaces; (2) reproductive – and growth –
characteristics of species that were not at the disturbance site and now occur there, and (3) disturbance properties such as intensity, position and isolation degree from propagule sources; heterogeneity of the microenvironment formed when disturbance occurred; and the extent of area removed by disturbance. The latter is the disturbance factor dealt with in this paper. The shape and size of a disturbance area, either natural or experimentally created might indirectly influence its further occupation in several fashions. Basically, what will distinguish between two differently sized disturbances is the perimeter:area (P.A.) ratio, in which larger disturbances have lower P.A. ratios than less extent disturbances. After disturbances with a larger P.A. ratio, recolonization will happen with a larger proportion of lateral growth from organisms at the disturbance border through vegetative growth than through propagule settlement from the water column (MILLER, 1982; PALUMBI; JACKSON, 1982). On the other hand, when the P.A. ratio is low, these proportions are inverted (KAY; KEOUGH, 1981; SOUSA, 1984). The consequences of space recolonization after disturbance have a capital importance to natural communities, since they imply in shifts in community parameters such as species diversity (e.g., HOBBS; HUENNEKE, 1992; CHAPIN et al., 2000). A wellknown theory, the Intermediate Disturbance Hypothesis (IDH), originally proposed by Connell (1978) and further investigated in as much as 200 papers (see Mackey and Currie (2000, 2001) for reviews of IDH studies), assumes that maximum diversity will be met at intermediate levels of disturbance. In this context, disturbance levels could be defined as disturbance intensity (strength, area, etc.) or frequency. Intermediate disturbance levels would allow a better coexistence between stronger competitors and rapid colonizers, thus increasing species diversity. At lower and higher disturbance levels, competitive dominance and too harsh conditions would exclude species, decreasing diversity (e.g. GRIME, 1973; CONNELL, 1978; HUSTON, 1979; PETRAITIS; LATHAM; NIESENBAUM, 1989; LENZ; MOLIS; WAHL, 2004a, 2004b; JARA et al., 2006). This work attempted to answer to the following questions: (1) what are the effects of increasing disturbance areas on fouling communities from Guanabara Bay? (2) Is the IDH valid to this ecosystem, i.e., will higher diversity be observed at intermediate disturbance areas? (3) How communities behave along time after a single disturbance event with variable areas?
XAVIER ET AL.: DISTURBANCE IN FOULING COMMUNITIES
MATERIAL AND METHODS Study Site
This study was performed at Guanabara Bay (22°52'S, 043°08'W), during a 12-month period, from April 2005 to April 2006. Guanabara Bay is characterized by waters with mean salinity and temperature of 31.0 (± 2.8), 24.7°C (± 2.3) and highly eutrophicated waters (KJERFVE et al., 1997) where fouling communities develop very rapidly (JARA et al., 2006). This site is a sheltered navy port (Mocanguê Island), where communities are presumably not exposed to external disturbances (e.g. wave action, air exposure). To avoid further disturbance due to collision with floating objects, the panels were arranged inside floating ring-shaped blocks (see “experimental design” below). Experimental Design
Seven PVC ring-shaped experimental blocks (60 cm diameter, 30 cm height and 3 mm thickness) with 10 roughened PVC panels as experimental units (E.U., 15 x 15 cm, 3 mm thickness) inside each ring
75
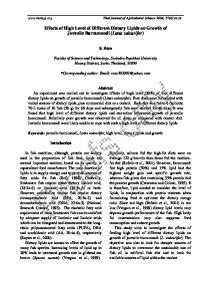
(total N = 70 E.U.) where independently and equidistantly (>1,50 m) submerged at 50 cm depth at Mocanguê island (Fig. 1). Panels were oriented vertically in relation to the surface. A maturing period of 6 months was allowed, while no disturbance treatment was applied. Physical disturbance was then applied only once (20 October 2005), consisting of biomass removal from randomly positioned, circular areas of growing size (7 levels). Disturbance levels consisted of removal areas comprising 0.0 (control, no disturbance), 12.5, 25.0 (lower disturbance levels), 37.5 (intermediate disturbance level), 50, 62.5, and 75% (higher disturbance levels) of the panels (Fig. 2). This treatment considered linear increases of disturbance area, what did not, however, led to similar increases of the P.A. ratio (Fig. 3). Within each ring, one E.U. from each of the 7 treatments was randomly positioned, plus an additional replicate of 3 randomly chosen disturbance treatments, so that the design ended with 10 replicates of each treatment across the 7 rings, in a design known as a split-plot design or randomized blocks design with within-block replication (HURLBERT, 1984; ZAR, 1999).
Fig. 1. PVC ring-shaped experimental blocks (60 cm diameter, 30 cm height and 3 mm thickness) with 10 roughened PVC panels as experimental units (E.U., 15 x 15 cm, 3 mm thickness) vertically oriented inside the ring.
76
BRAZILIAN JOURNAL OF OCEANOGRAPHY, 56(2), 2008
0.0%
12.5%
25%
37.5%
50.0%
62.5%
75%
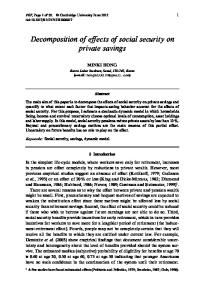
Fig. 2. Growing disturbance areas applied to fouling communities from the PVC panels. Positions of disturbance within each panel were randomly chosen.
Area (cm²) P.A. ratio 140 0,8
120 100 80
0,6
60 0,5
40
0,4
20
Area (cm² disturbed)
P.A. ratio
0,7
0
0,3
-20 0
12,5
25
37,5
50
62,5
75
Area (% disturbed)
Fig. 3. Relationship between percent cover of fouling removed and corresponding disturbance area (in cm2) and perimeter:area ratio (P.A.). Note that although disturbance area grows in a linear fashion, the same does not happen with the P.A. ratio.
After the first sampling (20 days after disturbance), subsequent samples were taken fortnightly (ending at the 140th day after disturbance, 8th sampling event), so as to follow the development patterns of the community afterward. Sampling consisted of non-destructive visual estimates of percent cover of each macroscopic, sessile species occurring at the panels, following a previous work in the same site (JARA et al., 2006). Random subsamples of the communities were taken employing a hand microscope (30x magnification) to ensure that no rare or smaller species were ignored during samplings. Samplers were the same in all samplings, and were assigned to sample across treatments and rings to ensure no experimenter error was perpetrated. Samplers were also trained using computer-generated artificial communities with known percent covers (estimated using the software ImageJ, N.I.H., USA) to
reduce estimation differences among samplers. Estimation intervals of 5% were used, with 3 and 1% intervals assigned to species with less than 5% cover. At all samplings, a border of 1 cm was excluded from the estimation in order to avoid well-known edgeeffects (ANDERSON, 1998). After the last sampling, all biomass was removed from panels to estimate community dry weight. Full identification to species level was not always possible due to the non-destructive nature of the sampling performed, since any further biomass removal from the panels could constitute an additional disturbance, not planned or quantified appropriately. Microbial biofilms whose macroscopic manifestations could be clearly distinguished were sampled for laboratory identification and separately quantified during field work.
XAVIER ET AL.: DISTURBANCE IN FOULING COMMUNITIES
Statistical Analyses
A randomized blocks design with within block (ring) replication was used in this work. The resulting data on species diversity (Shannon index, H’, calculated in natural logarithm [loge]), species richness, evenness or uniformity (Pielou index), community dry weight, and % cover of “dominant” species (those with cover >15% at a given sampling) were analysed using a corresponding parametric ANOVA analysis. The ANOVA model consisted of factor 1, “disturbance” with 7 levels, and factor 2 as block or “ring” with 7 levels. Assumptions of normality and variance homogeneity where tested prior to all analyses by Shapiro Wilk’s W and Cochran’s tests, respectively. In most cases, data were normal and variances homogeneous, a clear consequence of the elevated sample size used (total N = 70, ZAR, 1999). However, whenever assumptions were violated, data were transformed and tested again and, if assumptions were still not met, Kruskal-Wallis ANOVA was also performed, always leading to the same inference. Significant differences after ANOVA were located using Tukey’s test. Based on previous data from the same study site (JARA et al., 2006), post hoc power analyses were performed and a larger significance level was a priori chosen (α = 10%) to ensure more statistical power, thus reducing the likelihood of a type II error (UNDERWOOD, 1997). Whenever the factor “ring” was not significant, data were pooled. Analyses were performed on data from all 8 samplings following the disturbance event. Percent cover data were always arcsin-transformed prior to statistical testing.
apparently disappeared ( Fig. 4D, 4E, 4F), and later was completely inverted (Fig. 4G, 4H), with lower species diversity and richness being recorded at higher disturbance levels (50% and 62.5%, respectively, in the 8th sampling, Fig 4H). At 140 days from the disturbance event, significant peaks of diversity (increase from 50 to 75% disturbance levels, ANOVA F6,21 = 2.261 followed by Tukey’s test, p = 0.06) and richness (increase from 62.5 to 75% disturbance levels, ANOVA F6,63 = 1.8917 followed by Tukey’s test, p = 0.07) were observed at the most extreme disturbance levels. The increase in species richness and diversity from lower to higher levels were 27 and 20%, respectively (Fig. 4H). Table 1. Sessile species found on panels along the postdisturbance period of the experiment at Guanabara Bay. Superscript numbers indicate the sampling in which the species presented percent cover superior to 15%.
Group
Identification
Green algae
Cladophora vagabunda Codium decorticatum Enteromorpha sp.1 Ulva fasciata
Sponges
Demospongiae unidentified Mycale microsigmatosa Tedania ignis
Cnidarians
Anthozoa unidentified Obelia dichotoma1-4,6,8
Polychaetes
Branchiomma nigromaculata Hydroides sp. Polydora sp. Polychaeta unidentified
Crustaceans
Amphibalanus amphitrite Balanus eburneus Balanus improvisus
Bivalves
Ostrea equestris Perna perna
Ascidians
Botryllus sp. Botryllus giganteum Botryllus niger Diplosoma listerianum Microcosmus exasperatus Styela plicata
Bryozoans
Bugula neritina6,7 Bugula turrita Membranipora membranacea Schizoporella errata
Biofilms
Cyanophyceae Multispecific bacterial biofilm1-8 Multispecifc green algal biofilm Bacillariophycean biofilm1,3-7
Unknown group
Benthic eggcase
RESULTS A total of 33 distinct taxonomic entities were recorded in the panels (Table 1) along the experimental period after the disturbance event. Species diversity peaked at an intermediate level of disturbance (32.5% of area removed) 20 days after the disturbance (1st sampling, Fig. 4A). A significant decrease of 16.0% diversity was observed from this intermediate level to the extreme disturbance level (75% of area removed; ANOVA F6,63 = 2.097 followed by Tukey’s test, p = 0.06). Species richness showed a similar, but nonsignificant trend with higher values at a 62.5% disturbance area (Fig. 4A). Uniformity also peaked at an intermediate level, but nonsignificantly (p > 0.10). This pattern was hold until the 50th day after the disturbance event (3rd sampling), although differences were more slender and not significant statistically (Fig. 4B,4C). After this moment, the trend
77
78
BRAZILIAN JOURNAL OF OCEANOGRAPHY, 56(2), 2008
A
B
13
*
1,8
14
2,0
*
1,6
12 11
1,4
10
1,2
13
1,8
12
1,6 1,4
11
1,2 10
9
1,0
1,0 8
0,8 0,6
7 00.0
12.5
25.0
37.5
50.0
62.5
2,0 1,8
00.0
15
2,2
14
2,0
13
1,6
12
1,4
12.5
25.0
37.5
50.0
62.5
75.0
D
15 14
1,8
13
1,6
12
1,4 11
1,2
10
1,0
9
0,8
0,6
8
0,6
12.5
25.0
37.5
50.0
62.5
75.0
E
2,2
10
1,0
0,8
00.0
11
1,2
9 8 00.0
12.5
25.0
37.5
50.0
62.5
75.0
F
14
13
Richness
Diversity / Uniformity
8
0,6
75.0
C
2,2
9
0,8
2,0
2,0 13
1,8
1,8
12
1,6
1,6
12
11 1,4
1,4 11
1,2
1,2
10
1,0
1,0
10
9 0,8
0,8 9
0,6 00.0
12.5
25.0
37.5
50.0
62.5
G
2,2
0,6
75.0
00.0
12.5
25.0
37.5
50.0
62.5
H
16 15
1,8
14
1,6
13
1,4
12
1,2
14
*
1,8
*
1,6 1,4
1,0
10
0,8
9
0,6
12
*
1,2
11
8
*
2,0 2,0
75.0
10
1,0 8
0,8 00.0
12.5
25.0
37.5
50.0
62.5
75.0
00.0
12.5
25.0
37.5
50.0
62.5
75.0
Area (% disturbed) Richness
Diversity
Uniformity
Fig. 4. Mean (+ standard deviation) species diversity (H’, loge), uniformity (Pielou, J’[left axis]) and richness (right axis) along a gradient of increasing disturbance area A. 20 days, B. 35 days, C. 50 days, D. 65 days, E. 80 days, F. 95 days, G. 110 days and H. 140 days after the disturbance event. * marks denote significant differences between treatments (ANOVA followed by Tukey’s test). Note that ordinate axis scales are variable.
XAVIER ET AL.: DISTURBANCE IN FOULING COMMUNITIES
Bell-shaped curves of species diversity (Fig. 3), uniformity (Fig. 4) and richness (Fig. 5) along time were observed for all disturbance treatments. The larger and more consistent variation in these community parameters was observed for the 75% disturbance treatment, which started (20 days after
79
disturbance) with the lowest values of diversity, uniformity and richness and ended (140 days after disturbance) with the highest values. The highest values for all community’s parameters were observed at 110 days after the disturbance event (Fig. 5A, 5B, 5C).
A 2,0
Diversity (H', loge)
1,9 0,0 12,5 25,0 37,5 50,0 62,5 75,0
1,8 1,7 1,6 1,5 1,4 20
35
50
65
80
95
110
140
B 0,85
0,0 12,5 25,0 37,5 50,0 62,5 75,0
Uniformity (J')
0,80
0,75
0,70
0,65 20
35
50
65
80
95
110
140
C 12,0 11,5 0,0 12,5 25,0 37,5 50,0 62,5 75,0
11,0
Richness
10,5 10,0 9,5 9,0 8,5 8,0 7,5 20
35
50
65
80
95
110
Time after disturbance (days)
140
Fig. 5. Mean species diversity (H’, loge) (A), uniformity (Pielou’s J’) (B) and taxonomic richness (number of species) (C) per disturbance treatment (7 levels ranging from 0 to 75% of panel cover removed) along time after the disturbance event (in days). Note unequal interval between 110 and 140 days.
80
BRAZILIAN JOURNAL OF OCEANOGRAPHY, 56(2), 2008
Community’s biomass (dry weight) did not show any significant difference between disturbance treatments after the last sampling. Nonetheless, biomass decreased inversely to disturbance area (Fig. 6). The percent cover of the dominant species (considered here as those with cover >15% at any given sampling) were analyzed in order to search for patterns across disturbance treatments, and only significant results are shown here. The percent cover of the green, filamentous seaweed Enteromorpha increased steadily with disturbance area. The two higher disturbance levels (62.5 and 75%) presented
significant differences (ANOVA F6,21 = 5.402 followed by Tukey’s test, p < 0.01 in all mentioned comparisons) when compared to the three lower disturbance levels (0 – 25%) in the 1st sampling after the disturbance event (Fig. 7). A reddish biofilm of diatoms (Bacillariophyceae) showed exactly the opposite pattern, with decreased cover under increased disturbance levels. Diatom biofilm (Fig. 8) thus decreased significantly from lower disturbance levels (0, 12.5%) to the higher disturbance level (75%; ANOVA F6,21 = 2.762 followed by Tukey’s test, p ≤ 0.03). In all other samplings, variation in species’ percent cover was not significant.
biomass
60
Dry weight (g)
50
Fig. 6. Mean (+standard deviation) biomass of the fouling communities (dry weight, g) 140 days after being submitted to a gradient of increasing disturbance area (7 levels ranging from 0 to 75% of panel cover removed).
40
30
20
10 0
12,5
25
37,5
50
62,5
75
Area (% disturbed)
Enteromorpha sp.
70 60
b 50
ab
% cover
Fig. 7. Mean percent cover (+ standard deviation) of the green seaweed Enteromorpha sp. along a gradient of increasing disturbance area (7 levels ranging from 0 to 75% of panel cover removed) 20 days after the disturbance event. Different superscript letters denote significant differences between treatments (ANOVA followed by Tukey’s test).
b
40
ab
30 20
a
a
a
10 0 0
12,5
25
37,5
50
Area (% disturbed)
62,5
75
XAVIER ET AL.: DISTURBANCE IN FOULING COMMUNITIES
81
Bacillariophycean biofilm
60
a 50
a
% cover
40
ab
ab
ab
30
ab
20
c
10 0
12,5
25
37,5
50
62,5
75
Area (% disturbed)
Fig. 8. Mean percent cover (+ standard deviation) of a reddish biofilm composed primarily of diatoms (Bacillariophyceae) along a gradient of increasing disturbance area (7 levels ranging from 0 to 75% of panel cover removed) 20 days after the disturbance event. Different superscript letters denote significant differences between treatments (ANOVA followed by Tukey’s test).
DISCUSSION The results of the present paper clearly show (1) that community parameters such as species diversity and richness peaked at intermediate disturbance levels (i.e., areas) soon after the disturbance event (20 days); (2) that peaks of maximum richness and diversity shifted with time from an intermediate disturbance level to the highest disturbance treatment (75%, 8th sampling, 140 days after the disturbance event); (3) that diversity, as well as richness and uniformity, exhibited a hump-shaped curve along time, with peaks at an intermediate moment (110 days after disturbance) and subsequent decrease; (4) that biomass, as well as the diatom biofilm, decreased consistently with disturbance increase, and (5) that the cover of the green seaweed Enteromorpha sp. increased with disturbance increase. A total of 33 different taxonomic entities were recorded along the post-disturbance period; the species richness value is largely superior to that reported by Jara et al. (2006) in a study at the same site and with similar experimental set-up (23 species). This discrepancy can be a result of the treatments employed in both cases: in the present study, a single disturbance event was applied, and communities followed its natural successional course afterward, while in their study, Jara et al. (2006) applied as much as 12 disturbance events in 6 months (i.e., modulated
disturbance frequency instead of area), what most likely kept species richness at lower levels. Moreover, the nature of the disturbance applied here (growing areas) directly released as much as 75% of what seems to be the only limiting resource for the colonization of sessile species at such an eutrophic site as Guanabara Bay: space. The disturbance treatment applied had a clear immediate effect on the studied fouling communities. The pattern was compatible with Connell’s Intermediate Disturbance Hypothesis (IDH, CONNELL, 1978), with species diversity and richness maxima at intermediate disturbance levels. This humpshaped pattern is considered to be a result of lower diversity at both extremes of a disturbance gradient, either through competitive exclusion by dominant species (lower disturbance levels) or by exclusion by harsh conditions under higher disturbance levels. Coexistence of a higher number of species would thus be possible under intermediate disturbance levels (CONNELL, 1978; MACKEY; CURRIE, 2000, 2001; SOUSA, 2001). In previous tests of the IDH in benthic marine communities, the disturbance gradient proposed by Connell is usually interpreted as meaning disturbance intensity (e.g., LENZ; MOLIS; WAHL, 2004a, b) or frequency (e.g., VALDIVIA et al., 2005; JARA et al., 2006), but rarely as area from which biomass was removed. However, since 30 years ago (GRIME, 1977) there is a consensus that the main effect of disturbance, especially physical disturbance,
82
BRAZILIAN JOURNAL OF OCEANOGRAPHY, 56(2), 2008
is biomass loss. Sousa (2001) pointed to the need of investigating the effects of patch size in order to improve our ability to predict the disturbance effects on community composition and dynamics. This seems to be a very good advice, since in our study the IDHtype pattern initially observed slowly shifted to an inverse pattern (a “U-shaped” curve), in which maximum diversity was significantly observed at the highest disturbance treatment. This result highlights the importance of monitoring disturbance effects through time after disturbance ending. Such a pattern reversal is a complex process and thus difficult to explain, but may be related to the differential responses of the species that colonized or remained established along the different disturbance treatments after the biomass removal. For example, in the early stages after the disturbance event there was a significant increase in the abundance of opportunistic colonizer but weak competitor species such as the filamentous green seaweed Enteromorpha sp. in the treatments under high disturbance levels. This might be an evidence that the physical disturbance alleviated the effects of competition, reducing the abundance of dominant species that could outcompete pioneer species in the course of succession (CONNELL, 1978), a notion that is widely accepted (SOUSA, 2001) but has rarely been demonstrated experimentally (PORTO, 2006). The diversity reversal with time may also be related to the elevated disturbance levels applied to the communities, although at equal increase intervals (12.5%), reaching very high levels (up to 75%). Perhaps they were too harsh in a way that a new community developed and succession was restarted. The high disturbance levels would thus have led the fouling communities to earlier successional stages, what could explain the higher values for the communities’ parameters, such as diversity and species richness, in a later moment (SOUSA, 2001). Nevertheless, community biomass seems to partially support this, since even 140 days after disturbance, a decrease in biomass with increasing disturbance level was still noticeable. Some dominant species also suffered a decrease with increasing disturbance: a common reddish biofilm, composed mainly of benthic diatoms (Bacillariophyceae), decreased significantly in percent cover with disturbance increase. As this biofilm was frequently recorded as an epibiont layer over the canopy of large macroscopic species such as bryozoans (Bugula spp.) and ascidians (mainly the solitary Styela plicata), it is reasonable to suppose that larger disturbance areas removed the major part of this canopy, thus removing the proper substrate for this biofilm to develop (pers. obs. from the authors). The analysis of the changes in community parameters through time also deserves some attention. A less-known aspect of Connell´s original work
(CONNELL, 1978) is that diversity should also peak at an intermediate point in time and thereon decrease, in part due to the increasing dominance of better competitors and consequent species exclusion. All disturbance treatments conform to this, with peaked diversity, uniformity and richness between 95 and 110 days after the disturbance application. The fact that Pielou’s uniformity also decreased after the peak reinforces the idea of a competitive exclusion mechanism, since uniformity (also called evenness or homogeneity) is strongly affected by increased dominance. However, it is noteworthy that this IDH versus time pattern was also observed in the communities to which no disturbance was applied (0% disturbance area), being most likely a common successional trait of natural ecological communities (e.g., FARRELL, 1989; ZALMON; DA GAMA; LETA, 1993; BENEDETTI-CECCHI, 2000). The results of the present work emphasize the importance of monitoring communities during a relatively long period after a disturbance (either natural or anthropogenic), since initial patterns that seem to conform to the IDH theory may be inverted with time and thus lead to very different community outcomes. This may be particularly true in environmental impact studies, which traditionally assume a decrease of diversity as a result of larger disturbance (e.g., RAPPORT; REGIER; HUTCHINSON, 1985; PALMER; AMBROSE; POFF, 1997). However, further studies are needed to better assess the generality of application of the findings of the present work.
ACKNOWLEDGEMENTS We are grateful to the field help provided by C.L. Teixeira, G. Ank, H. Melo, F.V. da Silva and C.F. Souza and L. Granthom Costa for ascidian identification. The authors are indebted to the staff and commander of the CMEM from the BNRJ (Brazilian Navy, Mocanguê Island), for granting access and protection to our experiments. B.A.P.G. and R.C.P. thank CNPq and FAPERJ for their Research Productivity and Scientist of the State fellowships. E.A.X. thanks FAPERJ for his scholarship.
REFERENCES ANDERSON, M. J. Effects of patch size on colonization in estuaries: revisiting the species-area relationship. Oecologia, v. 118, p. 87-98, 1998. BENEDETTI-CECCHI, L. Predicting direct and indirect interactions during succession in a mid-littoral rocky shore assemblage. Ecol. Monogr., v. 70, p. 45-72, 2000. BRANCH, G. M. Competition between marine organisms: ecological and evolutionary implications. Annu. Rev. Oceanogr. Mar. Biol., v. 22, p. 429-593, 1984.
XAVIER ET AL.: DISTURBANCE IN FOULING COMMUNITIES
CHAPIN, F. S. III; ZAVALETA, E. S.; EVINER, V. T.; NAYLOR, R. L.; VITOUSEK, P. M.; REYNOLDS, H. L.; HOOPER, D. U.; LAVOREL, S.; SALA, O. E.; HOBBIE, S. E. MACK, M. C.; DIAZ, S. Consequences of changing biodiversity. Nature, v. 405, p. 234-242, 2000. CONNELL, J. H. Diversity in tropical rain forests and coral reefs. Science, v. 199, p. 1302-1310, 1978. DAYTON, P. K. Competition, disturbance, and community organization: The provision and subsequent utilization of space in a rocky intertidal community. Ecol. Monogr., v. 41, p. 351-389, 1971 FARRELL, T. M. Succession in a rocky intertidal community: the importance of disturbance size and position within a disturbed patch. J. Exp. Mar. Biol. Ecol., v. 128, p. 57-73, 1989. GRIME, J. P. Competitive exclusion in herbaceous vegetation. Nature, v. 242, p. 344-347, 1973. GRIME, J. Evidences for the existence of three primary strategies in plants and its relevance to ecological and evolutionary theory. Am. Naturalist., v. 111, p. 11691194, 1977. HOBBS, R. J.; HUENNEKE, L. F. Disturbance, Diversity, and Invasion: Implications for Conservation. Conserv. Biol, v.6, p. 324-337, 1992. HURLBERT, S. H. Pseudoreplication and the design of ecological field experiments. Ecol. Monogr., v. 54, p. 187-211, 1984. HUSTON, M. A. A general hypothesis of species diversity. Am. Naturalist, v.113, p. 81-101, 1979. JACKSON, J. B. C. Adaptation and diversity of reef corals. Bioscience, v. 41, p. 475-482, 1977. JACKSON, J. B. C.; BUSS, L. Allelopathy and spatial competition among coral reef invertebrates. Proc. nat. Acad. Sci. U.S.A., v. 72, p. 5160-5163, 1975. JACKSON, J. B. C. Adaptation and diversity of reef corals. Bioscience, v. 41, p. 475-482, 1977. JARA, V. C.; MIYAMOTO, J. H .S.; DA GAMA, B. A. P.; MOLIS, M.; WAHL, M.; PEREIRA, R. C. Limited evidence of interactive disturbance and nutrient effects on the diversity of macrobenthic assemblages. Mar. Ecol. Prog. Ser., v. 308, p. 37-48, 2006. KAY, A. M.; KEOUGH, M. J. Occupation of patches and the epifaunal communities on pier pilings and the bivalve Pinna bicolor at Edithburgh, South Australia. Oecologia, v.48, p. 123-130, 1981. KJERFVE, B.; RIBEIRO, C. H. A.; DIAS, G. T. M.; FILIPPO, A. M.; QUARESMA, V. S. Oceanographic characteristics of an impacted coastal bay: Baía de Guanabara, Rio de Janeiro, Brazil. Continent. Shelf Res., v. 17, p. 1609-1643, 1997. LENZ, M.; MOLIS, M.; WAHL, M.. Testing the intermediate disturbance hypothesis: response of fouling communities to various levels of emersion intensity Mar. Ecol. Prog. Ser., v. 278, p. 53-65, 2004a. LENZ, M.; MOLIS, M.; WAHL, M. Experimental test of the intermediate disturbance hypothesis: response of fouling communities to various levels of emersion intensity. J. Exp. Mar. Biol. Ecol., v. 305, p. 247-266, 2004b. MACKEY, R. L.; CURRIE, D. J. A re-examination of the expected effects of disturbance on diversity. Oikos, v. 88, p. 483-493, 2000.
83
MACKEY, R. L.; CURRIE, D. J. The diversity-disturbance relationship: Is it generally strong and peaked? Ecology, v. 82, p. 3479-3492, 2001. MENGE B. A.; BRANCH, G. M. Rock intertidal communities. In: BERTNESS, M. D.; GAINES, S. D.; HAY M. E. (Ed.). Marine community ecology. Sunderland, MA: Sinauer Associates, p. 221-252, 2001. MILLER, T. E. Community diversity and interactions between the size and frequency of disturbance. Am. Naturalist, v. 120, p. 533-536, 1982. MORGAN, S. G. The larval ecology of marine communities. In: BERTNESS, M.D.; GAINES, S.D. & HAY M.E. (Ed.). Marine community ecology. Sunderland, MA: Sinauer Associates, p.159-182, 2001. OSMAN, R. W. The establishment and development of marine epifaunal community. Ecol. Monogr., v. 47, p. 37-63, 1977. PALMER, M. A.; AMBROSE, R. F.; POFF, N. L. Ecological theory and community restoration ecology. Restor. Ecol., v. 5, p. 291-300, 1997. PALUMBI, S. R.; JACKSON, J. B. C. Ecology of cryptic coral reef communities. II. Recovery from small disturbance events by encrusting bryozoa: the influence of “host” species and lesion size. J. Exp. Mar. Biol. Ecol. v. 64, p. 103-115, 1982. PETRAITIS, P. S.; LATHAM, R. E.; NIESENBAUM, R. A. The maintenance of species diversity by disturbance. Quart. Rev. Biol., v. 64, p. 393-418, 1998. PORTO, T. F. Efeitos da variabilidade temporal de distúrbios, seqüência e idade sucessional em comunidades macrobentônicas. Dissertação (Mestrado em Biologia Marinha). Universidade Federal Fluminense, Niterói, 69 p, 2006. RAPPORT, D. J.; REGIER, H. A.; HUTCHINSON, T. C. Ecosystem behaviour under stress. Am. Naturalist, v. 125, p. 617-640, 1985. RUPPERT, E. E.; FOX, R. S. ; BARNES R. D. Invertebrate Zoology: A Functional Evolutionary Approach. 7th. ed. Belmont, CA: Brooks/Cole - Thomson Learning, 963 p. 2004. RUSS, G. R. Overgrowth in a marine epifaunal community: competitive hierarchies and competitive networks. Oecologia, v. 53, p. 12-19, 1982. SEBENS, K. P. Spatial relationships among encrusting marine organisms in the New England subtidal zone. Ecol. Monogr., v. 56, p. 73-96, 1986. SOUSA, W. P. The role of disturbance in natural communities. Annu. Rev. Ecol. Syst., v.15, p. 353-391, 1984. SOUSA, W. P. Natural disturbance and the dynamics of marine benthic communities. In: BERTNESS, M. D.; GAINES, S.D. HAY M. E. (Ed.). Marine community ecology. Sunderland, MA: Sinauer Associates, p. 85-130, 2001. UNDERWOOD, A. J. Experiments in ecology – Their logical design and interpretation using analysis of variance. Cambridge: Cambridge University Press, 504 p. 1997. VALDIVIA, N.; HEIDEMANN, A.; THIEL, M.; MOLIS, M.; WAHL, M. Effects of disturbance on the diversity of hard-bottom macrobenthic communities on the coast of Chile. Mar. Ecol. Prog. Ser., v. 299, p. 45-54, 2005.
84
BRAZILIAN JOURNAL OF OCEANOGRAPHY, 56(2), 2008
WAHL, M. & MARK, O. The predominantly facultative nature of epibiosis: experimental and observational evidence. Mar. Ecol. Progr. Ser., v. 187, p. 59-66, 1999. WITMAN, J.D. & DAYTON, P.K. Rock subtidal communities. In: BERTNESS, M. D.; GAINES, S. D. & HAY M. E. (Ed.). Marine community ecology. Sunderland, MA: Sinauer Associates, p. 339-366, 2001. ZALMON, I.R., DA GAMA, B.A.P., LETA, A. Fouling community organization at Guanabara Bay, Brazil: a directional process or a variable temporal progression? Oebalia, v. 19, p. 217-222, 1993.
ZAR, J.H. Biostatistical analysis. 4th ed. River, NJ: Prentice Hall. 918 p., 1999.
Upper Saddle
(Manuscript received 09 June 2006; revised 16 April 2007; accepted 13 August 2007)