Effects of GABRA2 Variation on Physiological, Psychomotor and Subjective Responses in the Alcohol Challenge Twin Study Penelope A. Lind,1 Stuart MacGregor,1 Grant W. Montgomery,1 Andrew C. Heath,2 Nicholas G. Martin,1 and John B. Whitfield1 1 2
Genetic Epidemiology Unit, Queensland Institute of Medical Research, Brisbane, Australia Missouri Alcoholism Research Center, Department of Psychiatry,Washington University School of Medicine, St Louis, Missouri, United States of America
ultiple reports have identified variation in the GABRA2 gene as contributing to the genetic susceptibility to alcohol dependence. However, both the mechanism behind this association, and the range of alcohol-related phenotypes affected by variation in this gene, are currently undefined. Other data suggest that the risk of alcohol dependence is increased by relative insensitivity to alcohol’s intoxicating effects. We have therefore tested whether GABRA2 variation is associated with variation in the subjective and objective effects of a standard dose of alcohol in humans. Data on responses to alcohol from the Alcohol Challenge Twin Study (Martin et al., 1985) have been tested against allelic and haplotype information obtained by typing 41 single-nucleotide polymorphisms in or close to the GABRA2 gene. Nominally significant allelic associations ( p < .05, without correction for multiple testing) were found for body sway, motor coordination, pursuit rotor and arithmetical computation tasks, and for the personality dimension of Neuroticism. Because of the large number of phenotypes tested, these possibly significant findings will need to be confirmed in further studies.
M
Both adoption and twin studies have established that genetic variation contributes to the risk of alcohol dependence, and numerous linkage and association studies have reported on loci or gene polymorphisms that may contribute to this genetic risk. Although many of the findings have not been replicated, and their status is still uncertain, consistent positive findings are available for the gamma-aminobutyric acid (GABA) A2 receptor gene, GABRA2. This was identified as a candidate through linkage studies on two groups with substantially different genetic histories: the COGA cohort of US families with multiple occurrences of alcohol dependence (Reich et al., 1998) and a group of Native Americans (Long et al., 1998). Because GABA and GABA-receptor interactions are known to be affected by alcohol (Davies, 2003),
174
further work was done on the GABRA genes and significant allelic and haplotype effects were found for GABRA2 (Edenberg et al., 2004). This has since been confirmed in other studies (Covault et al., 2004; Fehr et al., 2006; Lappalainen et al., 2005). The only marker typed in all four studies, rs279858, is in exon 5 of the GABRA2 gene but does not cause an aminoacid change. These four studies have typed, and obtained significant results for, different single nucleotide polymorphisms (SNP) markers and so no single marker can be identified as causative. Even after identification of a gene, or polymorphisms within a gene that increase or decrease risk, questions about scope and mechanism remain. These are particularly pertinent when (as in this case) the association is with a range of markers or a haplotype rather than with a deletion or base change with obvious effects on protein function or expression. We need to determine the range of phenotypes affected (e.g., only alcohol dependence, dependence extending across a range of substances, or dependence and other comorbid psychopathology). A second question is how the effect leads to alcohol dependence or other psychiatric conditions. Possible mediators include characteristics which are only expressed after consumption of alcohol, such as flushing reactions or susceptibility to intoxication; or personality characteristics present at all times such as novelty seeking, depression or conduct disorder. There is some evidence that GABRA2 falls into both of these classes. For example, there are genetic associations between alcohol dependence and antisocial personality disorder or conduct disorder (Kendler et al., 2003) which may, in part, be due to effects of GABRA2 variation (Dick, Bierut, et al., 2006). On the other
Received 29 January, 2008; accepted 4 February, 2008. Address for correspondence: Dr J. B. Whitfield, Genetic Epidemiology Unit, Queensland Institute of Medical Research, PO Royal Brisbane Hospital, Queensland 4029, Australia. E-mail:
[email protected]
Twin Research and Human Genetics Volume 11 Number 2 pp. 174–182
GABRA Haplotypes and Alcohol Sensitivity
hand, at least part of the genetic alcohol dependence risk appears to be due to differences in the level of response to alcohol (Schuckit et al., 2004) or alcohol sensitivity (Heath et al., 1999). One single-nucleotide polymorphism (SNP) within GABRA2 (rs279858) has been reported to affect subjective response to alcohol (Pierucci-Lagha et al., 2005). This report, being based on only 27 subjects, needs replication and extension. Data on subjective, psychomotor and physiological responses after a standardized dose of alcohol are available for participants in the Alcohol Challenge Twin Study (ACTS; Martin et al., 1985). We have now typed 41 GABRA2 SNPs on 372 of these twins, and this paper reports on associations between these SNPs or haplotypes and measures of response to alcohol derived from the ACTS data.
Subjects and Methods Subjects
Four hundred and twelve people (206 pairs of twins) participated in the original ACTS between 1979 and 1981. They were of mainly Northern European ancestry. There were 88 monozygotic (MZ) pairs (45 female and 43 male) and 118 dizygotic (DZ) pairs (42 female, 37 male and 39 opposite sex). The age range was 18–34 years with 70% of subjects aged less than 25 years. Measures of blood and breath alcohol levels (expressed as mg per 100 ml of blood) were recorded following ingestion of a weight-related dose of ethanol (0.75 g/kg) over 20 minutes (Martin et al., 1985). The effects of alcohol were recorded through measurements
of physiological, psychomotor and subjective variables before, and at one, two and three hours after, its consumption. These measures are summarized in Table 1. Body sway was recorded as the time to accumulate a specified amount of movement so a lower value indicates more sway. Blood samples were not retained after this initial study, but by 1990 it was apparent that genotyping of individual subjects from this study would allow testing of genotype-phenotype associations. Blood was then collected from 372 of the original 412 subjects (90%), initially for typing of the ADH1B*47His and ADH1C* 349Ile polymorphisms (Whitfield et al., 1998). DNA from these subjects was also used for the GABRA SNP typing. Subjects gave informed consent and studies were approved by the Queensland Institute of Medical Research Human Research Ethics Committee. DNA was also obtained and genotyped from 60% of the twins’ parents, and 251 additional siblings of the twins who did not participate in the Alcohol Challenge Twin Study. These parents and siblings provide no relevant phenotypic information, but do contribute to the within-family tests of association. Genotyping
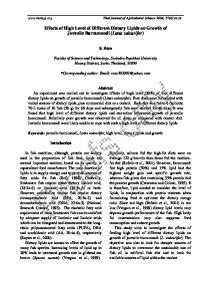
The SNPs typed, and their locations in relation to the GABRA2 gene, are shown in Figure 1. Assays were designed using the Sequenom MassARRAY Assay Design software (version 3.0) and typed using iPLEX™ chemistry on a MALDI-TOF Mass Spectrometer (Sequenom Inc, San Diego CA). Each 2.5 µL reaction was carried out in standard 384-well plates. polymerase
Table 1 Summary of Pre- and Post-Alcohol Measurements Measurement
Abbreviations
Sensitivity to alcohol§
Blood pressure Systolic Diastolic
SYSBP 0 to SYSBP 3 DIABP 0 to DIABP 3
1.02 1.61
Heart rate
PULSE 0 to PULSE 3
5.59
Skin temperature
SKTEM 0 to SKTEM 3
6.22
Body sway Eyes open Eyes closed
EO 0 to EO 3 EC 0 to EC 3
16.18 16.42
Motor coordination Number of correct responses Number of delayed correct responses Number of incorrect responses
VDANC 0 to VDANC 3 VDADC 0 to VDADC 3 VDAIC 0 to VDAIC 3
10.26 11.82 5.13
Pursuit rotor Number of times off target Total time off target
PURNO 0 to PURNO 3 PURDO 0 to PURDO 3
10.09 11.73
Arithmetic computation Number correct Number incorrect
AKTNC 0 to AKTNC 3 AKTIC 0 to AKTIC 3
5.63 5.99
Intoxication self-rating (1 to 10)
INTSR 0 to INTSR 3
37.5
Willingness to drive (Yes/No)
DRIVE 0 to DRIVE 3
2.95
Note: t statistic for the change in each variable between t0 (before alcohol) and t1 §
Each was measured once before and three times after alcohol. (Abbreviations are those used in the original paper on the ACTS)
Twin Research and Human Genetics April 2008
175
Penelope A. Lind, Stuart MacGregor, Grant W. Montgomery, Andrew C. Heath, Nicholas G. Martin, and John B. Whitfield
3' rs567926
Exon 10
9
rs495818 rs497068 rs572227 rs573400 rs541418 rs519972 (Ala407Thr) rs534459 rs507788 rs532780 rs548583 rs2165250 rs540363 rs526752 rs530329 rs483160
rs2083422 rs279873
8 7
rs279869 rs279866 rs279867 rs279863 rs279858 (Lys132Lys)
6 5 140.2 Kb
rs279843
rs279844 rs279845 rs279846 rs183961 rs1440130 rs279826
4
rs279834 rs279836 rs279837 rs189957 rs279822 rs1442059
rs1442060
rs4695152
3 2 1
rs10013922 rs894269
5'
rs1025852
Figure 1 A schematic representation of the human GABRA2 gene structure. Note: The 41 single nucleotide polymorphisms analyzed in this study are shown in relation to their location across the 140.2 Kb GABRA2 gene. Exons are numbered (1 to 10) and the relative exon size is denoted by the width of the horizontal bars.
176
Twin Research and Human Genetics April 2008
GABRA Haplotypes and Alcohol Sensitivity
chain reaction (PCR) was performed with 12.5 ng genomic DNA, 0.5 units of Taq polymerase (HotStarTaq, Qiagen, Valencia, CA), 500 µmol of each dNTP, and 100 nmol of each PCR primer. PCR thermocycling was performed using an ABI Dual 384-Well GeneAmp® PCR System 9700 cycler (Applied Biosystems, Foster City, CA) and cycling conditions as follows: an initial denaturation stage at 94 °C for 15 minutes, followed by 40 cycles of 20 seconds at 94 °C, 30 seconds at 56 °C, 60 seconds at 72 °C. One µL of solution containing 0.15 units Shrimp Alkaline Phosphatase (SAP, Sequenom) was added to the completed PCR reaction mix, which was incubated for 20 minutes at 37 °C, followed by inactivation for 5 minutes at 85 °C. After adjusting the concentrations of extension primers to equilibrate signal-to-noise ratios, the post-PCR primer extension reaction of the iPLEX assay was performed in a final volume of 5.5 µL containing 0.122 µL termination mix, 0.025 µl DNA polymerase (Sequenom) and 600 nM to 1200 nM extension primers. A two-step 200 short-cycles program was used during iPLEX thermocycling: initial denaturation was for 30 seconds at 94 °C followed by 5 cycles of 5 seconds at 52º C and 5 seconds at 80ºC. Additional 40 annealing and extension cycles were then looped back to 5 seconds at 94 °C, 5 seconds at 52º C and 5 seconds at 80º C. A final extension at 72º C for three minutes was followed by cooling to 20º C. The iPLEX reaction products were desalted by diluting samples with 18 µL of water and 3 µL of resin to optimize mass spectrometric analysis and then spotted on a SpectroChip (Sequenom), processed and analyzed in a Compact Mass Spectrometer by MassARRAY Workstation software (version 3.3; Sequenom). Assay quality and genotype calls were assessed in the SpectroTYPER software (Sequenom). Genotypes for MZ and DZ twins were compared using PEDSTATS (Wigginton & Abecasis, 2005) to check sample identity and zygosity as well as Hardy-Weinberg equilibrium. Where zygosity or sample identities were suspect, sample histories were reviewed and when necessary, genotyping was repeated with DNA isolated from a backup sample. Statistical Methods
Pairwise marker–marker linkage disequilibrium (LD) was assessed using the r 2 statistic in Haploview 3.31 (Barrett et al., 2005). Families were tested for association between each quantitative trait and the transmitted/nontransmitted allele at each marker in GABRA2 using the regression model in QTDT (Abecasis et al., 2000). Allelic transmissions were analyzed using the ‘orthogonal’ model with 10,000 permutations used to obtain robust p values. The ‘orthogonal’ model only considers transmissions within families and hence is robust to population stratification. All quantitative traits were transformed to normality using a piecewise normal transformation. The trait values of MZ twins were averaged across the pair. As a check on the genotyping both members of most MZ
pairs were genotyped; there was complete concordance between genotypes for individually genotyped MZ pairs. Correction for sex and age was performed by fitting covariates in the regression model. Traits that were associated (p < .01) in the single marker analysis were also interrogated for haplotypic association using the qpdtphase module of the UNPHASED package (Dudbridge, 2003). Both short (three markers) and long (10 markers) sliding windows of markers were used to examine if there was evidence for haplotypic effects upon each trait. Only haplotypes at frequencies of greater than 0.02 were included in the significance tests. For the binary traits DRIVE 1, DRIVE 2 and DRIVE 3, the generalization of the transmission disequilibrium test (TDT) for general pedigrees described by Abecasis (Abecasis et al., 2000) was applied. For this analysis MZ twins were excluded from the analysis. Analyses were performed first by considering allelic transmissions to individuals who indicated they would drive in their current state; subsequently the data were re-analyzed by considering allelic transmissions to individuals who would not drive. Depending on which class of response to the DRIVE question is considered, the number of subjects, the genetic informativeness of the pedigrees and the power of the test will vary. Many of the traits studied were correlated and there was substantial LD across GABRA2. As a result the effective number of statistical tests done was substantially less than the actual number of tests. To take account of both of these factors we estimated the effective number of tests by utilizing permutations in QTDT. This gives two p values from the permutation routine; one p value which corrects for all tests done, p_corrected, and another p value for each trait/marker combination singly, p_uncorrected. If all traits and markers were uncorrelated then a permutation procedure would yield a p value equivalent to a Bonferroni correction; that is, p_corrected = 1–(1 p_uncorrected)^n where n denotes the number of tests done. An estimate of the effective number of independent tests is hence n_effective = log(1-p_corrected)/log(1-p_uncorrected). In our case the empirical (multiple testing corrected) p value from the permutation procedure was ~.33 and the best p value (across all traits and all markers) was .0006. An estimate of the effective number of independent tests is hence n_effective = log(1-p_corrected)/log (1-p _uncorrected), approximately 670 (compared with 3500 nonindependent tests in total).
Results LD Among SNP Markers
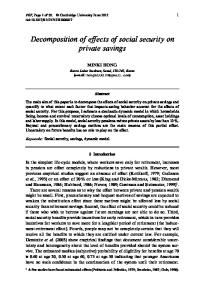
The 41 SNP markers showed substantial linkage disequilibrium (LD), comprising two LD blocks as shown in Figure 2. This is consistent with LD data (on a smaller number of people) from the Hapmap database for CEPH (Centre d’études du polymorphisme humain) families of European origin.
Twin Research and Human Genetics April 2008
177
178
Twin Research and Human Genetics April 2008
Neuroticism
3'
3 4
5 7
5'
8 9 10 11 12 13 14 15 16 17 18 19 20 21 22 23 24 25 26 27 28 29 30 31 32 33 34 35 36 37 38 39 40 41
Note: (A) Pairwise linkage disequilibrium (LD) between GABRA2 SNPs, as measured by the r2 statistic. Regions of low to high LD are represented by light grey to black shading, respectively. Note that one SNP (rs519972, the 6th SNP) from Figure 1 is omitted in Figure 2 because it was monomorphic in this population. (B) The significance of association between each GABRA2 SNP and a series of ten alcohol phenotypes are graphically represented as follows: black circle (p ≤ .01), shaded circle (.01 < p ≤ .05), open circle (.05 < p ≤ .10), and the absence of a circle (p > .10). Descriptions of the ten alcohol-related phenotypes are given in Table 1. (C) The location of each SNP (numbered 1 to 41) in relation to its position in or near the GABRA2 gene. The exon/intron structure of GABRA2 is also shown.
LD and association analysis results.
Figure 2
NEU
Arithmetic: Correct Arithmetic: Correct Arithmetic: Correct Arithmetic: Correct Arithmetic: Correct Arithmetic: Correct Arithmetic: Incorrect
GABRA2
VDAIC 0 AKTNC 0 AKTNC 1 AKTNC 2 AKTNC 3 AKTNC 2 – AKTNC 1 AKTNC 3 – AKTNC 1 AKTIC 3 – AKTIC 1
Motor Co-ordination
PURNO 1 PURNO 2
SNP Number: 1 2 EC 1 – EC 0 EC 2 – EC 0 EO 2 – EO 1
Hand-Eye Co-ordination Hand-Eye Co-ordination
Body Sway: Eyes Closed Body Sway: Eyes Closed Body Sway: Eyes Open
2 85 9 25 726 22 0 1 9 9 2 rs rs8 013 515 60 10 69 20 59 rs rs4 144 420 822 7 rs s14 279 995 37 r rs 18 98 36 rs 27 798 34 rs s2 98 26 0 r 27 98 3 rs 27 401 961 6 rs 14 83 84 5 rs rs1 279 984 44 rs s27 798 843 8 r 2 79 85 3 rs s2 79 86 6 r 2 79 86 7 rs s2 79 86 9 r 2 9 86 3 rs 27 79 87 2 rs s2 79 42 0 r 2 83 16 9 rs 20 83 32 2 rs rs4 530 675 63 rs s52 403 250 3 r 5 65 58 0 rs 21 48 78 8 rs rs5 32 778 59 5 rs s50 344 418 0 r 5 41 40 7 rs s5 73 22 8 r s5 72 06 8 r 5 97 81 6 rs 4 95 92 rs 4 67 rs s5 r
(C)
(B)
(A)
Penelope A. Lind, Stuart MacGregor, Grant W. Montgomery, Andrew C. Heath, Nicholas G. Martin, and John B. Whitfield
GABRA Haplotypes and Alcohol Sensitivity
Allelic Effects on Alcohol Sensitivity
Haplotype Effects on Alcohol Sensitivity
Nominally significant associations are summarized in Figure 2, and a more detailed table is available on request from the authors. p values less than .05 were found for body sway with eyes closed (but not with eyes open) at time 1, becoming more significant after adjustment for pre-alcohol sway (EC1–EC0) and also showing some associations at p < .05 for time 2 (EC2–EC0). These tended to cluster towards the 5’ end of the major LD block, between markers 25 and 36 (rs279844 to rs1442059). For body sway with eyes open, the only significant results were for the change between times 1 and 2, for most of the SNPs in the 3’ block. The pursuit rotor tasks showed sporadic p values of less than .05 at times 1 and 2 throughout the LD block. Inclusion of self-reported drinking habits (usual quantity × frequency of alcohol use) as a covariate did not increase the number of significant results. Self-report of intoxication showed no significant association with SNP alleles or haplotypes in the 3’ LD block, where significant associations with alcohol dependence have been found, but there were some nominally significant associations with SNPs at the 5’ end of the gene at times 2 and 3 (two at p < .01, one at p < .05). Reports of willingness to drive showed differing results according to whether allele transmission to those who would drive, or those who would not drive, were calculated. When transmissions to those who would drive are considered, there were no associations reaching p less than .05 at times 1 or 3, and only one at time 2; essentially a negative set of results. If the transmissions to individuals who would not drive are used, there were again no associations at p less than .05 at times 1 and 3 but at time 2 there were 23 occurrences of p less than .05 and one of p less than .01 within the main LD block from rs567926 to rs1442059. The motor coordination task, specifically the number of incorrect responses given within the allotted time (VDAIC), showed significant results (some with p < .01) across the major LD block before the test dose of alcohol was consumed, but not after. Because of sex differences in the effects of alcohol on performance of the motor coordination tasks (Martin et al., 1985), we also considered results for males and females separately for SNPs in GABRA2 and VDANC, VDADC, and VDAIC, but the results were less significant than for males’ and females’ data analyzed together. For the arithmetic tasks, the number of correct responses before alcohol was associated with SNPs 5’ to the major LD block; and after alcohol both with those and with others within the major LD block. Significant (p < .05) associations were also found between SNPs in the major LD block and neuroticism score. The physiological and subjective measures, on the other hand, showed only occasional p values between .05 and .10.
Haplotype analysis produced improvements in the significance level for two of the phenotypes, body sway and neuroticism. For (EC1–EC0) the smallest p values for any of the haplotypes was from the 10-marker haplotype from rs279866 to rs279826, p = .00046. This is approximately one quarter of the best single marker result, but required testing 32 10-marker haplotypes to get this decreased p value. For neuroticism, the best haplotype p value was .0016 for the markers rs279843 to rs279837. This is approximately 10 times smaller than best single marker result, but again required 32 10-marker haplotype tests to obtain this decreased p value. Haplotypes for the other variables that showed significant allelic associations all produced less significant results than for single markers. Effect Direction
For the trait (EC1–EC0; body sway after drinking, relative to baseline measure before alcohol), there were a number of significant results in the region between rs279844 and rs279826. The SNP rs279845 in this region was previously reported by Edenberg (Edenberg et al., 2004) to be associated with alcohol dependence, with the allele T designated as a risk allele. In our data ‘T’ alleles at rs279845 led to decreased (EC1–EC0) scores, so that relative to baseline scores, the individuals carrying T alleles tend to sway more than those who do not after alcohol consumption. (Body sway was recorded as the time taken to accumulate a set amount of movement, so that individuals who swayed more had lower scores.) Mean values for (EC1–EC0) scores by rs279845 genotype were AA 0.1003, AT –0.0523 and TT –0.2904; F1,188 = 4.588, p = .033. This suggests that individuals carrying T alleles at this locus are more sensitive to alcohol and hence less likely to become alcohol dependent, contrary to expectation. For completeness, we also fitted a model including dominance for EC1-EC0 and rs279845 but such a model gave a larger p value than the additive only analysis (F2,187 = 2.336, p = .100). This implies that any deviations from an additive model are modest and including an additional degree of freedom to model dominance is not advantageous. For VDAIC0, the number of incorrect responses in the motor coordination task before alcohol, the ‘T’ allele at rs279845 was associated with an increased number of incorrect responses.
Discussion Previous reports have established associations between GABRA2 SNPs or haplotypes and alcohol dependence (Covault et al., 2004; Edenberg et al., 2004; Fehr et al., 2006; Lappalainen et al., 2005), and also for a wider spectrum of disorders including other drug dependence and conduct disorder (Agrawal et al., 2006; Dick, Bierut, et al., 2006; Dick, Agrawal, et al., 2006). This study was initiated because of a specific
Twin Research and Human Genetics April 2008
179
Penelope A. Lind, Stuart MacGregor, Grant W. Montgomery, Andrew C. Heath, Nicholas G. Martin, and John B. Whitfield
claim that a GABRA2 SNP affects alcohol sensitivity (Pierucci-Lagha et al., 2005), and because of the more general finding that the degree of subjective or objective response to alcohol is inversely related to alcohol dependence risk (Heath et al., 1999; Pollock, 1992; Schuckit et al., 2004). There have been preliminary results suggesting that polymorphisms in SLC6A4 (the serotonin transporter promoter insertion/deletion polymorphism) and GABRA6 (Pro385Ser) affect, or interact to affect, alcohol sensitivity (Hu et al., 2005). Apart from sensitivity to flushing after alcohol, which has been extensively studied in Asian groups and to a minor extent in Europeans, the main methods for assessment of alcohol sensitivity have involved self-reports of subjective intoxication and objective measures of body sway after standardized doses of alcohol (Heath et al., 1999; Schuckit et al., 2004). Indirect approaches have included questions about the amount of alcohol required to produce intoxication (Schuckit et al., 2006), or about the expected consequences of alcohol use (Finn et al., 2005). Most results are consistent with the concept that greater alcohol sensitivity is associated with decreased risk of dependence, although this logical conclusion may not apply to alcohol expectancies in highly impulsive people (Finn et al., 2005). This previous work suggests that two of the phenotypes that should receive priority in genetic association testing for sensitivity to alcohol’s effects are body sway and subjective intoxication. However, there are no data to show that other aspects of intoxication do not affect dependence risk; there is simply an absence of information. It is therefore reasonable to test all the available measures of alcohol’s effects, but since there are many we have to confront the issue of multiple testing and false-positive associations. We will consider our results firstly for body sway and selfreport intoxication, then for other psychomotor and physiological measures, and then return to the interpretation of these results in the light of the multiple testing issue. The strongest evidence for GABRA2 SNP effects among our results was for body sway, measured with eyes closed. All the SNPs in the block between rs567926 and rs1442059 (except for rs519972 which was monomorphic, and rs279837 which falls within this physical range but is not in significant LD with the other markers) showed nominally significant (p < .05) associations with baseline-corrected body sway at time 1, and ten showed p less than .01. Three of these SNPs also showed p less than .05 associations with baseline-corrected body sway at time 2. When we considered body sway in the eyes-open condition instead of the closed-eyes condition, the associations with SNPs in the main block had the same direction of effect but were less significant (smallest p values for [EO1-EO0] were around .15). The phenotypic correlation for (EC1-EC0) versus (EO1-EO0), calculated from the ACTS data, was .85. However, the allelic
180
effect in our data is in the opposite direction to that predicted from the associations with alcohol dependence and from the single report on association with subjective intoxication. The other nominally significant associations for body sway were between SNPs in the 3’ haplotype block and recovery between times 1 and 2 (EO2–EO1), or tolerance. Issues related to acute or chronic tolerance are difficult to separate from initial sensitivity to alcohol’s effects. Tolerance is increased by high alcohol intake, but only 7% of study participants reported drinking more than 40 grams of alcohol per day, and reported alcohol intake accounted for only 11% of variance in body sway for men and 2% for women (Martin et al., 1985). Information on subjective responses to alcohol in the ACTS is limited to the subjects’ responses to two questions; a comparison of how drunk they felt compared with the most drunk they had ever been, and a yes/no response on whether they would drive at their current level of intoxication. The self-reported intoxication ratings showed negative results, while those for willingness to drive are difficult to interpret. Some of the psychomotor tasks showed allelic associations with uncorrected p values of less than .05, specifically the pursuit rotor task and the arithmetic tasks. None of the physiological measures such as blood pressure, heart rate or skin temperature showed significant associations. Overall, there is little support for GABRA2 allelic effects on these measures of intoxication. Rather surprisingly, some of the items showed significant results in the absence of alcohol. These were the number of incorrect responses in the motor coordination task, the arithmetic task, and the Neuroticism score from the Eysenck Personality Questionnaire (EPQ). The number of incorrect answers could be interpreted as a measure of impulsivity, and therefore connected to the spectrum of personality characteristics and addictive behaviors already associated with GABRA2. This is speculative and will need further testing, but the direction of the effect is consistent with the concept that some GABRA2 alleles and haplotypes increase both impulsiveness and alcohol dependence risk. Significant associations for the arithmetic task before alcohol were confined to the 5’ group of SNPs, but became significant for most of the SNP markers after alcohol. The Neuroticism result deserves follow-up, and we are currently typing relevant GABRA2 SNPs in a larger cohort of subjects who have completed the EPQ. In view of the substantial number of negative results among the multiple tests performed, it is reasonable to question whether the positive ones are purely chance findings. Normally, this question could be addressed by increasing the number of subjects to achieve sufficient power, or by initiating another study. Because the alcohol challenge protocol is labour-intensive and costly, this is not practical unless
Twin Research and Human Genetics April 2008
GABRA Haplotypes and Alcohol Sensitivity
other groups have similar studies which can provide replication or refutation of our results. Although the (EC1–EC0) body sway results are not significant after correction for all the phenotypes and markers tested (equivalent to ~ 670 tests as discussed above), considering this variable on its own (i.e., ignoring multiple testing across phenotypes) the results are still significant after correction for the 41 markers tested (the permutation p value for best result across the markers tested is p = .023; the best single marker p uncorrected for any multiple tests was .0023). There are also some low p values for haplotypes, as mentioned above. However, apart from purely statistical considerations, it is important to consider whether our results replicate previous ones. For the body sway result, the direction of effect for the association for rs279858 is inconsistent with several previous reports on dependence risk, and the single report (Pierucci-Lagha et al., 2005) on subjective intoxication. Because evidence is accumulating that GABRA2 variation is not alcohol-specific in its effects, but extends to other types of dependence and to conduct or antisocial personality disorders, the effects on prealcohol measurements are potentially important. The possible association between incorrect motor coordination responses and impulsivity, and the association between the former and the rs279848 allele which increases dependence risk, are consistent with personality factors, rather than specific responses to alcohol, being the mediators of the GABRA2 allelic effects on alcohol dependence risk. In conclusion, the association between GABRA2 variation and alcohol dependence risk is well established but there is little evidence that it is mediated by variation in susceptibility to alcohol’s effects. The weight of evidence points to personality factors, and liability to behavioral undercontrol in relation to other drug use and nonaddictive behaviours, as the more likely pathway from GABRA2 gene variation to alcohol-related behavioral outcomes.
References Abecasis, G. R., Cookson, W. O., & Cardon, L. R. (2000). Pedigree tests of transmission disequilibrium. European Journal of Human Genetics, 8, 545–551. Agrawal, A., Edenberg, H. J., Foroud, T., Bierut, L. J., Dunne, G., Hinrichs, A. L., Nurnberger, J. I., Crowe, R., Kuperman, S., Schuckit, M. A., Begleiter, H., Porjesz, B., & Dick, D. M. (2006). Association of GABRA2 with drug dependence in the collaborative study of the genetics of alcoholism sample. Behavior Genetics, 36, 640–650. Barrett, J. C., Fry, B., Maller, J., & Daly, M. J. (2005). Haploview: Analysis and visualization of LD and haplotype maps. Bioinformatics, 21, 263–265. Covault, J., Gelernter, J., Hesselbrock, V., Nellissery, M., & Kranzler, H. R. (2004). Allelic and haplotypic association of GABRA2 with alcohol dependence.
American Journal of Medical Genetics. Part B, Neuropsychiatric Genetics, 129, 104–109. Davies, M. (2003). The role of GABAA receptors in mediating the effects of alcohol in the central nervous system. Journal of Psychiatry and Neuroscience, 28, 263–274. Dick, D. M., Bierut, L., Hinrichs, A., Fox L., Bucholz, K. K., Kramer, J., Kuperman, S., Hesselbrock, V., Schuckit, M., Almasy, L., Tischfield, J., Porjesz, B., Begleiter, H., Nurnberger, J., Jr., Xuei, X., Edenberg, H. J., & Foroud, T. (2006). The role of GABRA2 in risk for conduct disorder and alcohol and drug dependence across developmental stages. Behavior Genetics, 36, 577–590. Dick, D. M., Agrawal, A., Schuckit, M. A., Bierut, L., Hinrichs, A., Fox, L., Mullaney, J., Cloninger, C. R., Hesselbrock, V., Nurnberger, J. I., Jr., Almasy, L., Foroud, T., Porjesz, B., Edenberg, H., & Begleiter H. (2006). Marital status, alcohol dependence, and GABRA2: Evidence for gene–environment correlation and interaction. Journal of Studies on Alcohol, 67, 185–194. Dudbridge, F. (2003). Pedigree disequilibrium tests for multilocus haplotypes. Genetic Epidemiology, 25, 115–121. Edenberg, H. J., Dick, D. M., Xuei, X., Tian, H., Almasy, L., Bauer, L. O., Crowe, R. R., Goate, A., Hesselbrock, V., Jones, K., Kwon, J., Li, T. K., Nurnberger, J. I., Jr., O’Connor, S. J., Reich, T., Rice, J., Schuckit, M. A., Porjesz, B., Foroud, T., & Begleiter, H. (2004). Variations in GABRA2, encoding the alpha 2 subunit of the GABAA receptor, are associated with alcohol dependence and with brain oscillations. American Journal of Human Genetics, 74, 705–714. Fehr, C., Sander, T., Tadic, A., Lenzen, K. P., Anghelescu, I., Klawe, C., Dahmen, N., Schmidt, L. G., & Szegedi, A. (2006). Confirmation of association of the GABRA2 gene with alcohol dependence by subtypespecific analysis. Psychiatric Genetics, 16, 9–17. Finn, P. R., Bobova, L., Wehner, E., Fargo, S., & Rickert, M. E. (2005). Alcohol expectancies, conduct disorder and early-onset alcoholism: Negative alcohol expectancies are associated with less drinking in nonimpulsive versus impulsive subjects. Addiction, 100, 953–962. Heath, A. C., Madden, P. A., Bucholz, K. K., Dinwiddie, S. H., Slutske, W. S., Bierut, L. J., Rohrbaugh, J. W., Statham, D. J., Dunne, M. P., Whitfield, J. B., & Martin, N. G. (1999). Genetic differences in alcohol sensitivity and the inheritance of alcoholism risk. Psychological Medicine, 29, 1069–1081. Hu, X., Oroszi, G., Chun, J., Smith, T. L., Goldman, D., & Schuckit, M. A. (2005). An expanded evaluation of the relationship of four alleles to the level of response to alcohol and the alcoholism risk. Alcoholism, Clinical and Experimental Research, 29, 8–16.
Twin Research and Human Genetics April 2008
181
Penelope A. Lind, Stuart MacGregor, Grant W. Montgomery, Andrew C. Heath, Nicholas G. Martin, and John B. Whitfield
Kendler, K. S., Prescott, C. A., Myers, J., & Neale, M. C. (2003). The structure of genetic and environmental risk factors for common psychiatric and substance use disorders in men and women. Archives of General Psychiatry, 60, 929–937. Lappalainen, J., Krupitsky, E., Remizov, M., Pchelina, S., Taraskina, A., Zvartau, E., Somberg, L. K., Covault, J., Kranzler, H. R., Krystal, J. H., & Gelernter, J. (2005). Association between alcoholism and gammaamino butyric acid alpha2 receptor subtype in a Russian population. Alcoholism, Clinical and Experimental Research, 29, 493–498. Long, J. C., Knowler, W. C., Hanson, R. L., Robin, R. W., Urbanek, M., Moore, E., Bennett, P. H., & Goldman, D. (1998). Evidence for genetic linkage to alcohol dependence on chromosomes 4 and 11 from an autosome-wide scan in an American Indian population. American Journal of Medical Genetics, 81, 216–221. Martin, N. G., Oakeshott, J. G., Gibson, J. B., Starmer, G. A., Perl, J., & Wilks, A. V. (1985). A twin study of psychomotor and physiological responses to an acute dose of alcohol. Behavior Genetics, 15, 305–347. Pierucci-Lagha, A., Covault, J., Feinn, R., Nellissery, M., Hernandez-Avila, C., Oncken, C., Morrow, A. L., & Kranzler, H. R. (2005). GABRA2 alleles moderate the subjective effects of alcohol, which are attenuated by finasteride. Neuropsychopharmacology, 30, 1193–1203. Pollock, V. E. (1992). Meta-analysis of subjective sensitivity to alcohol in sons of alcoholics. American Journal of Psychiatry, 149, 1534–1538.
182
Reich, T., Edenberg, H. J., Goate, A., Williams, J. T., Rice, J. P., Van Eerdewegh, P., Foroud, T., Hesselbrock, V., Schuckit, M. A., Bucholz, K., Porjesz, B., Li, T. K., Conneally, P. M., Nurnberger, J. I., Jr., Tischfield, J. A., Crowe, R. R., Cloninger, C. R., Wu, W., Shears, S., Carr, K., Crose, C., Willig, C., & Begleiter, H. (1998). Genome-wide search for genes affecting the risk for alcohol dependence. American Journal of Medical Genetics, 81, 207–215. Schuckit, M. A., Smith, T. L., Anderson, K. G., & Brown, S. A. (2004). Testing the level of response to alcohol: Social information processing model of alcoholism risk - A 20-year prospective study. Alcoholism, Clinical and Experimental Research, 28, 1881–1889. Schuckit, M. A., Smith, T. L., Waylen, A., Horwood, J., Danko, G. P., Hibbeln, J. R., Davis, J. M., & Pierson, J. (2006). An evaluation of the performance of the self-rating of the effects of alcohol questionnaire in 12- and 35-year-old subjects. Journal of Studies on Alcohol, 67, 841–850. Whitfield, J. B., Nightingale, B. N., Bucholz, K. K., Madden, P. A., Heath, A. C., & Martin, N. G. (1998). ADH genotypes and alcohol use and dependence in Europeans. Alcoholism, Clinical and Experimental Research, 22, 1463–1469. Wigginton, J. E., & Abecasis, G. R. (2005). PEDSTATS: Descriptive statistics, graphics and quality assessment for gene mapping data. Bioinformatics, 21, 3445–3447.
Twin Research and Human Genetics April 2008