June 2012 • No.
372
Effects of Nursing Home Stays on Household Portfolios By Sudipto Banerjee, Ph.D., Employee Benefit Research Institute A T
A
G L A N C E
Nursing home stays among retirees have increased steadily during the past decade. Among people age 65 and higher, nursing home stays increased from 6 percent in 2000 to 8.5 percent in 2010. Nursing home stays have strong and statistically significant negative effects on every type of household asset holdings except higher-risk assets (such as stocks, bonds, and mutual funds). Among nursing home entrants, purchase of long-term care insurance (LTCI) has also increased steadily during the past decade, but coverage remains low (14 percent in 2010). For those who spent six months or more in a nursing home facility, nearly half were covered by Medicaid. Those who reported being most likely to enter a nursing home in the near future were also less likely to purchase LTCI. Over the past decade, use of professional home-health care has increased steadily, as has the percentage of people with LTCI who use professional home-health care. But here also (for those using home-health care), LTCI coverage is low—13.2 percent in 2010. For those who have lived in a nursing home for six months or more, the median total household wealth was only $5,518. After respondents’ first entries into a nursing home, total household wealth fell steadily over a six-year period. By comparison, household wealth increased steadily over any six-year period for those who never entered a nursing home. For nursing home entrants, median housing wealth falls to zero within six years after the initial nursing home entry. Both mean and median levels of every type of wealth are much higher for those who did not use professional home health-care than those who did.
A monthly research report from the EBRI Education and Research Fund © 2012 Employee Benefit Research Institute
Sudipto Banerjee is a research associate at the Employee Benefit Research Institute. This Issue Brief was written with assistance from the Institute’s research and editorial staffs. Any views expressed in this report are those of the author, and should not be ascribed to the officers, trustees, or other sponsors of EBRI, EBRI-ERF, or their staffs. Neither EBRI nor EBRI-ERF lobbies or takes positions on specific policy proposals. EBRI invites comment on this research.
Copyright Information: This report is copyrighted by the Employee Benefit Research Institute (EBRI). It may be used without permission but citation of the source is required.
Recommended Citation: Sudipto Banerjee, “Effects of Nursing Home Stays on Household Portfolios,” EBRI Issue Brief, no. 372, June 2012. Report availability: This report is available on the Internet at www.ebri.org
Table of Contents Introduction ...................................................................................................................................................... 4 Data ................................................................................................................................................................. 4 Nursing Home Admission Trends ......................................................................................................................... 5 Trends in Public and Private Insurance Coverage Among Nursing Home Residents ................................................. 5 Expectation of Nursing Home Entry and Purchase of Private Insurance .................................................................. 6 Trends in Utilization of Home Health Care ............................................................................................................ 9 Change in Different Assets Following Nursing Home Stays .................................................................................... 9 Asset Changes of Those Who Recorded Nursing Home Stays and Those Who Did Not .......................................... 11 Change in Total Wealth ........................................................................................................................... 11 Change in Financial Wealth ...................................................................................................................... 12 Change in Housing Wealth ....................................................................................................................... 12 Change in Higher-Risk Assets ................................................................................................................... 12 Change in Lower-Risk/Risk-Free assets ..................................................................................................... 12 Change in Transportation ........................................................................................................................ 14 Assets of Those Who Use Professional Home Care and Those Who Don’t ............................................................. 14 Regression Results ........................................................................................................................................... 14 Conclusion ...................................................................................................................................................... 14 References ...................................................................................................................................................... 16 Appendix A ...................................................................................................................................................... 17 Appendix B ...................................................................................................................................................... 18 Endnotes......................................................................................................................................................... 19
Figures Figure 1, Percentage of Those Ages 65+ Admitted to a Nursing Home in Past Two Years................................... 5 Figure 2, LTC Insurance and Medicaid Coverage for Those 65+ Admitted to a Nursing Home in Past Two Years .................................................................................................................................................... 7 Figure 3, LTC Insurance and Medicaid Coverage for Those 65+ and Living in a Nursing Home for More Than 180 Days............................................................................................................................................... 7
ebri.org Issue Brief • June 2012 • No. 372
2
Figure 4, Correlation Between Self-Reported Probability of Moving to a Nursing Home in Next Five Years and Purchase of LTCI for Those 65+ .............................................................................................................. 8 Figure 5, Correlation Between Self-Reported Probability of Moving to a Nursing Home in Next Five Years and Actual Entry in Next Five Years................................................................................................................ 8 Figure 6, Percentage of 65+ Americans Using Professional Medical Help at Home in Past Two Years ................ 10 Figure 7, Percentage of 65+ Americans Who Are Professional Home Care Users With LTCI.............................. 10 Figure 8, Holdings of Different Types of Household Assets by Number of Nights Spent in a Nursing Home......... 13 Figure 9, Change in Total Household Wealth for Nursing Home Entrants and Non-Entrants (in 2010 Dollars) ..... 13 Figure 10, Change in Household Financial Wealth for Nursing Home Entrants and Non-Entrants (in 2010 Dollars) ............................................................................................................................................... 13 Figure 11, Change in Household Housing Wealth for Nursing Home Entrants and Non-Entrants (in 2010 Dollars) ............................................................................................................................................... 13 Figure 12, Change in Higher-Risk Assets for Nursing Home Entrants and Non-Entrants (in 2010 Dollars) ........... 16 Figure 13, Change in Lower-Risk/Risk-free Assets for Nursing Home Entrants and Non-Entrants (in 2010 Dollars) ............................................................................................................................................... 16 Figure 14, Change in Transportation Assets for Nursing Home Entrants and Non-Entrants (in 2010 Dollars)....... 16 Figure 15, Different Types of Assets for Those Who Did and Did Not Use Professional Home Care (in 2010 Dollars) ............................................................................................................................................... 16 Appendix B ................................................................................................................................................ 18
ebri.org Issue Brief • June 2012 • No. 372
3
Effects of Nursing Home Stays on Household Portfolios By Sudipto Banerjee, Ph.D., Employee Benefit Research Institute
Introduction Seniors face a number of retirement planning uncertainties, including longevity risk (the risk of outliving one’s assets), inflation risk (the risk of asset erosion), and investment risk (the risk of investment losses), among others. But perhaps none is as critical to their retirement security as health risk. Health shocks toward the end of life can result in serious functional limitations and even permanent disability. As a result, a large number of seniors might require professional medical care at home or in institutions such as nursing homes. Medicare estimates that by 2020, 12 million older Americans will need some form of long-term care1—care that can be very expensive and, for the most part, not covered by Medicare. This study looks at how a particular form of long-term care, nursing home care, affects asset holdings of senior households. According to a 2011 report (John Hancock 2011 National Long Term Care Cost Study),2 the average cost for a semiprivate nursing home room in the United States is $207 a day or $75,555 a year. Brown and Finkelstein (2009) report that of those who enter a nursing home, 10 to 20 percent will live there for more than five years. Potential sources for covering long-term care expenses, other than personal savings and assets, are: Medicaid (the federal-state health care program for the poor) covers long-term care costs for individuals below certain income levels, but the deductible for Medicaid is nearly all of an individual’s income and assets. As a result, Medicaid is the long-term care coverage of last resort for those with no assets. Medicare (the federal health care insurance program for the elderly and disabled) covers nursing home expenses up to 100 days, but only in a skilled nursing facility, and the nursing home stay must be preceded by a hospital stay of more than three consecutive days. Custodial care is the most common form of long-term care provided by nursing homes, is not covered by Medicare. As a result, Medicare covers only special cases of nursing home care. Private long-term care insurance (LTCI), which is expensive and rarely purchased: Currently, only 14 percent of individuals age 60 and over hold an LTCI policy (Brown and Finkelstein, 2011). Given the potentially catastrophic expenditure shock associated with nursing home stays, it is important to find out how people who entered nursing homes in the past or are still living in nursing homes manage their portfolios following their nursing home entries. The current study uses data from the Health and Retirement Study (HRS) to track the portfolios of households following the nursing home entries of HRS participants. For comparison, it also tracks the portfolios of similarly aged individuals who do not enter a nursing home facility. The data show a sharp contrast between the portfolio evolutions of these two types of households: On average, those who never enter a nursing home show no decumulation, and even some accumulation, in most asset classes, while assets declined very rapidly for those who enter nursing homes.
Data The data for this study come from the HRS, a study of a nationally representative sample of U.S. households with individuals over age 50. It is the most comprehensive survey of older Americans in the nation, and covers topics such as health, assets, income, and labor-force status in detail. It is a biennial longitudinal survey with questionnaire waves in even-numbered years, beginning in 1992. The initial sample consisted of individuals born between 1931 and 1941 and their spouses, regardless of their birth year. More cohorts were added in subsequent years.
ebri.org Issue Brief • June 2012 • No. 372
4
The critical cohort for the current study is known as the Study of Assets and Health Dynamics Among the Oldest Old (AHEAD) cohort, which includes individuals born before 1924. AHEAD started as a separate study in 1993 and was subsequently conducted in 1995, 1998, and every two years since then. HRS is sponsored by the National Institute on Aging (NIA) and the Social Security Administration (SSA) and administered by the Institute for Social Research (ISR) at the University of Michigan.
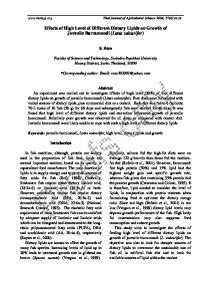
Nursing Home Admission Trends As Figure 1 shows, there is a growing trend among Americans age 65 or over admitted to a professional nursing home or other long-term care facilities during the two years preceding the survey years (from 2000 to 2010). In 2000, 6 percent of age 65+ members in the sample reported spending at least one night in a nursing home during the preceding two years. By 2010, that increased to 8.5 percent, although the average number of nights spent in a nursing home did not change much during this period. In 2000, there was an average of 317 nights spent in a nursing home in the previous two years (counting all nursing home stays and conditional on being admitted), which decreased to 299 in 2010. However, it should be noted that the distribution of nights spent in a nursing home is skewed to the right, because 10 to 20 percent of those admitted to a nursing home had lived there for more than five years (Brown and Finkelstein, 2009).
Figure 1 Percentage of Those Ages 65+ Admitted to a Nursing Home in Past Two Years 9%
8.5%
8% 6.9%
7% 6%
7.0%
7.1%
2006
2008
6.5%
6.0%
5% 4% 3% 2% 1% 0% 2000
2002
2004
2010
Source: Employee Benefit Research Institute estimates from the Health and Retirement Study.
Trends in Public and Private Insurance Coverage Among Nursing Home Residents Looking at the trends in Medicaid and private LTCI coverage, Figure 2 shows the percentage of individuals age 65 or over with such coverage who spent at least one night in a nursing home or a long-term care facility in the two years preceding every survey, back to 2000.
Private coverage: Between 2000 and 2010, coverage from private LTCI increased significantly but remains low. In 2000, only 6.4 percent were covered by LTCI, compared with 14 percent in 2010.
ebri.org Issue Brief • June 2012 • No. 372
5
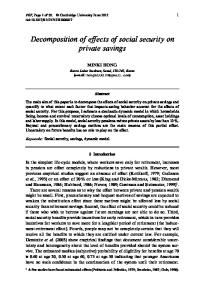
Public coverage: During the same period, the percentage of nursing home entrants covered by Medicaid showed a small downward trend (except for a peak in 2004). In 2000, 32.3 percent were covered by Medicaid, compared with 29.5 percent in 2010. However, Figure 3 shows that the dependence on Medicaid for those who spent more than 180 days in a nursing home was much higher than for those who spent at least one night (Figure 2) and the long-term residents’ dependence on Medicare did not change much during this period. In 2000, 48.8 percent of those who spent more than six months in a nursing home were covered by Medicaid, and this decreased slightly (to 47.2 percent) in 2010. Given that the effective deductible for Medicaid coverage is essentially all of an individual’s income and assets, Figure 3 implies that nearly half of the seniors who live for more than six months in nursing homes surrender almost all of their income and assets.
Expectation of Nursing Home Entry and Purchase of Private Insurance One of the many innovations of HRS is that it asks respondents a number of questions about their future expectations. Since the same individuals are surveyed over the years, it is possible to study to what extent the respondents act based on their future expectations, if at all. One of those questions about future expectations asks for the respondent’s self-assessed probability of moving into a nursing home in next five years. Figure 4 shows the correlation of those expectations with the individual’s decision to buy LTCI during the 2000–2010 period. Respondents select a number between 0 and 100 as representing their selfassessed probability of moving into a nursing home in the next five years. The correlations with LTCI purchases are shown separately for the different quartiles of the distribution of the self-assessed nursing home entry probabilities. Some trends are expected: For example, for the first three probability quartiles, the odds of buying LTCI rise with the self-assessed probability of moving into a nursing home. Also, within each quartile (except the top one), there is a time trend of higher LTCI purchases, though the percentage who purchase LTCI is still very low. For example, in 2010, within the group which reported a 50‒75 percent likelihood of moving into a nursing home in the next five years, approximately 1 in 4 (26.5 percent) report purchasing such insurance. However, those in the top quartile of selfreported probability of moving into a nursing home in next five years actually have a lower probability of purchasing LTCI—nor is there any increasing time trend like that found in the bottom three quartiles. A possible explanation for this might be that LTCI is expensive. Brown and Finkelstein (2009) report that the annual premiums for a “typical” LTCI policy are about $2,800 if purchased at age 55, $4,500 if purchased at age 65 and $9,600 if purchased at age 75.3 One might also argue that individuals may have a very subjective assessment of their health, and that very few (even those in the top quartile) will actually ever enter a nursing home or a long-term care facility. Again, the panel aspect of HRS can be used to examine the reliability of the self-reported probability of entering a nursing home. Figure 5 shows the correlation of these self-reported probabilities of entering a nursing home in the five years after the survey with actual nursing home entry in the subsequent five years. It turns out that the self-reported probabilities are consistent predictors of actual nursing home entry, with the chances of an actual nursing home stay increasing steadily with the self-reported probability of entering a nursing home. For example, among respondents in the 2004 survey who reported their own probabilities of moving into a nursing home in the subsequent five years, 16.9 percent, 25.4 percent, 36.4 percent, and 38.7 percent from the first, second, third, and fourth quartiles, respectively, actually entered a professional nursing home facility during that time frame. This makes the observation drawn from Figure 4 all the more disconcerting—that people in the top quartile don’t buy LTCI in the proportions suggested by their perceived likely need for nursing home care. The data presented in both Figures 4 and 5 suggest that those most likely to enter nursing homes are also less likely than others to buy private insurance to pay for their long-term care expenses (although they can arrange for informal caregivers).
ebri.org Issue Brief • June 2012 • No. 372
6
Figure 2 Long-term Care Insurance and Medicaid Coverage for Those 65+ Admitted to a Nursing Home in Past Two Years 40% 35.2%
35% 32.3%
LTC Insurance Medicaid
32.2%
30.9%
30%
29.5%
28.9%
25%
20%
14.0%
15% 10.1%
9.0%
10% 7.2%
6.4%
5.5%
5%
0%
2000
2002
2004
2006
2008
2010
Source: Employee Benefit Research Institute estimates from the Health and Retirement Study.
Figure 3 Long-term Care Insurance and Medicaid Coverage for Those 65+ and Living in a Nursing Home for More Than 180 Days* 60% LTC Insurance 48.8%
50%
Medicaid
50.7% 46.5%
47.8%
46.3%
47.2%
40%
30%
20% 12.5% 10% 4.1% 0%
2000
5.9%
2002
6.7%
7.2%
3.7%
2004
2006
2008
2010
Source: Employee Benefit Research Institute estimates from the Health and Retirement Study. * The difference between Figure 2 and Figure 3 is that in Figure 2 respondents had spent at least one night in a nursing home or long-term care facility, while in Figure 3 respondents had spent at least 180 nights in a similar facility in the past two years.
ebri.org Issue Brief • June 2012 • No. 372
7
Figure 4 Correlation Between Self-Reported Probability of Moving to a Nursing Home in Next Five Years and Purchase of LTCI for Those 65+ 30% 2000
2002
2004
2006
2008
2010
26.5%
25%
16.3%16.3%
18.4%
18.4%
15.4%
14.9% 13.7%
11.1%
14.8% 13.7% 13.4% 12.9% 13.0%
17.8%
10.5%
15%
18.7% 18.6%
16.3%
19.7%
20%
16.2%
Percentage Covered By LTCI
22.0% 20.4%
11.2%
10%
5%
0% 0‒25 %
26‒50%
51‒75%
76‒100%
Self-Reported Probability of Moving to a Nursing Home in Next Five Years Source: Employee Benefit Research Institute estimates from the Health and Retirement Study.
Figure 5 Correlation Between Self-Reported Probability of Moving to a Nursing Home in Next Five Years and Actual Entry in Next Five Years 45% 1998
2000
2002
2004
40% Percentage of Those Who Entered a Nursing Home
36.4%
35%
37.5% 37.6%
33.3%
38.7%
32.0%
29.8%
30%
28.4% 25.4%
25% 21.6%
20%
17.8%
16.9%
15%
22.3%
14.8% 14.9% 14.9%
10%
5%
0% 0‒25 %
26‒50%
51‒75%
76‒100%
Self-Reported Probability of Moving Into a Nursing Home in Next Five Years Source: Employee Benefit Research Institute estimates from the Health and Retirement Study.
ebri.org Issue Brief • June 2012 • No. 372
8
Trends in Utilization of Home Health Care Home health care can be a cheaper alternative to nursing home care (although all services may not be substitutable in some cases). Perhaps as a result, a growing number of older people in need of professional health care rely on home health care. According to Centers for Medicare and Medicaid Services (2010), expenditures on home health care account for about one-third of the total long-term care spending, and Figure 6 shows the recent trends in home healthcare utilization. The data from 2000 to 2010 illustrate a steady increase, with the exception of 2008, in home healthcare utilization. For example, in 2000, 9.1 percent of Americans who were 65 or older reported that they used some kind of professional home health-care services in the previous two years. By 2010, that had increased to 13.9 percent— an increase of nearly 5 percentage points, or a 50 percent increase in 10 years. The comparable numbers in nursing home care utilization from Figure 1 are lower: In 2000, 6 percent of Americans who were 65 or older used nursing home care in the preceding two years. This increased to 8.5 percent in 2010—a 2.5 percentage point, or 40 percent, increase over 10 years. Although home health care is generally less expensive than nursing home stays, the John Hancock 2011 National LongTerm Care Cost Study suggests that the average cost for a home health aide is $20 per hour ($37,440 a year). Figure 7 shows the percentage of Americans ages 65 or older who use professional home health care services and have LTCI to help pay for it. Like nursing home users, the rate of those using home health care is also very low but has steadily increased over the past few years. For example, from 2000 to 2004, only 9.7 percent of those who used professional home health care were also insured for the expense, increasing to 13.2 percent in 2010.
Change in Different Assets Following Nursing Home Stays Long-term care can be expensive and nursing home stays even more so. According to the John Hancock 2011 National Long Term Care Cost Study, the average cost of a private nursing home room is $235 a day, or $85,775 a year. For a semi-private room, the costs are $207 a day ($75,555 a year). Also, these costs have been rising very quickly. According to the same study, over the nine-year period preceding 2011, average long-term care costs rose at an annual rate of 4.1 percent. Given that the percentage of individuals with LTCI is relatively low among nursing home users, and that Medicare does not cover nursing home stays in many cases, most people have to bear these costs on their own. As a result, their assets are likely to deplete very quickly until the point at which the individual’s costs are picked up by Medicaid. The following analysis confirms this. For this study, the version of HRS data provided by RAND Corp. was used. The key advantage of using the RAND version is that it provides measures of different types of assets that are consistent across survey years. The study tracks the evolution of several types of assets following nursing home entry: Financial wealth (which includes any real estate other than primary residence; net value of vehicles owned; individual retirement accounts (IRAs), stocks and mutual funds, checking, savings, and money market accounts, CDs, government savings bonds, Treasury bills, bonds and bond funds; and any other source of wealth minus all debts) . Housing wealth (which includes value of primary residence minus mortgages and home loans). Total household wealth (sum of financial wealth and housing wealth). Higher-risk assets (which include stocks, mutual funds, investment trusts, bonds, and IRA balance). Lower-risk/risk-free assets (which include checking, savings, other money market accounts, certificates of deposit (CDs), government bonds and Treasury bills). Transportation (which includes the net value of vehicles owned). Figure 8 shows the holdings of different assets for three different groups: Individuals who spent 0‒30 nights in a nursing home (Group 1). Those who spent 31–180 nights in a nursing home (Group 2). Those who spent more than 180 days in a nursing home (Group 3). ebri.org Issue Brief • June 2012 • No. 372
9
Figure 6 Percentage of 65+ Americans Using Professional Home Care in Past Two Years 16%
13.9%
14%
12% 10.8% 10.2% 10%
9.1%
9.4%
2000
2002
9.7%
8%
6%
4%
2%
0%
2004
2006
2008
2010
Source: Employee Benefit Research Institute estimates from the Health and Retirement Study.
Figure 7 Percentage of 65+ Americans Who Are Professional Home-Care Users With LTCI 14%
13.2%
12%
11.2% 10.5%
10%
9.7%
9.7%
9.7%
2000
2002
2004
8%
6%
4%
2%
0%
2006
2008
2010
Source: Employee Benefit Research Institute estimates from the Health and Retirement Study.
ebri.org Issue Brief • June 2012 • No. 372
10
All assets are reported in terms of 2010 dollars, and both mean (average) and median (mid-point) results are reported for each asset category. But, as the means can be affected by the presence of a few high-asset holders, for the most part this article will focus on the medians.4 Median total household wealth for Group I is $108,300, dropping to $67,836 for Group 2 and only $5,518 for Group 3. The steep decline in private household wealth following a nursing home stay is not surprising. It has already been noted (Figure 3) that for those who spent more than 180 days in a nursing home, about half are covered by Medicaid. Given that the effective deductible for Medicaid is all of an individual’s income and assets, this means that after spending more than six months in a nursing home, 50 percent of those individuals lose all their assets. To focus on different asset categories, it can be noted that housing wealth shows the steepest decline. For Group 1, median housing wealth is $51,918, which goes down to $5,596 for Group 2 and zero for Group 3. The other asset category that depletes very quickly is transportation: The median wealth in this category is $2,424 for Group 1 and zero for both Groups 2 and 3. Financial wealth is also depleted quickly. Median financial wealth is $28,510, $12,562 and $1,090, respectively, for Groups 1, 2 and 3. There is no decumulation in median higher-risk assets, because the median for this category is zero for all three groups. It should be noted that this is an older group, with an average age of 77 (for those reporting any overnight nursing home stay). Lower-risk/risk-free assets also show similar steep decline: The median risk-free asset for Group 1 is $5,060, $3,243 for Group 2, and only $506 for Group 3. As Figure 8 shows, nursing home stays tend to result in very fast asset decumulation—which is expected, given the high nursing home costs and lack of private LTCI discussed earlier.
Asset Changes of Those Who Recorded Nursing Home Stays and Those Who Did Not To see how these numbers compare, this study also tracks the same asset categories of a comparable age group that did not enter a nursing home.5 HRS is conducted only every two years, so it is not possible to measure the annual changes in assets. The following analysis adopts a method described below to track the changes in assets. The last time an individual is observed before entering a nursing home for the first time is marked as Period 0, then he/she is observed again after two, four, and six years (which are marked as Periods 1, 2, and 3, respectively). The first nursing home admittance occurs between Periods 0 and 1. The individual may or may not enter a nursing home between the following periods. For those who never entered a nursing home, Periods 0, 1, 2, and 3 are just four consecutive survey waves. For this group, the initial Period 0 was chosen randomly from the survey years 2000 to 2004. Holdings of different types of assets are reported for Periods 0 to 3 for both groups.
Change in Total Wealth Figure 9 shows the change in total household wealth (both in means and medians) for both groups (nursing home entrants and non-entrants) from Period 0 to Period 3 (a six-year period). In Period 0, nursing home entrants have a mean (median) total household wealth of $290,048 ($102,073), compared with $369,114 ($173,848) for those who never entered a nursing home. This suggests that nursing home entrants are less wealthy to begin with. Possible reasons could be that the average age of nursing home entrants is higher than non-entrants, or that nursing home entrants are less healthy, a condition that correlates with less wealth. The median household wealth of nursing home entrants drops to $79,000, $78,000, and $60,720 in Periods 1, 2 and 3, respectively. On the other hand, the total household wealth of those who don’t enter nursing home care does not exhibit any such declining pattern in the consecutive four survey waves; rather, it shows an increasing pattern. Median household wealth for those not entering a nursing home increases from $173,848 in Period 0 to $197,556 in Period 1, $213,490 in Period 2, and $222,686 in Period 3. Mean total household wealth shows a similar pattern. The change in
ebri.org Issue Brief • June 2012 • No. 372
11
total household wealth shows a fast and steady decline for people who enter nursing homes, but the opposite trend for those who do not.
Change in Financial Wealth The pattern of change in household financial wealth is very similar to the pattern of change in total household wealth. Figure 10 shows the change in household financial wealth (both means and medians) for both groups from Period 0 to Period 3, and it can be seen that the median household financial wealth of nursing home entrants shows a fast and steady decline. However, for those who do not enter nursing homes, median financial wealth is higher in Period 3 than in Period 0. For example, median household financial wealth of nursing home entrants is $25,449 in Period 0, declining to $17,512 in Period 1, $14,180 in Period 2, and $10,626 in Period 3. In contrast, for those who never entered a nursing home, Period 0 median household financial wealth is $63,300, increasing to $69,084 in Period 1, declining to $68,211 in Period 2, and slipping further to $68,103 in Period 3 (although this is still higher than Period 0). So, while there is a steady decline in household financial wealth for those who enter nursing homes, no such decline is observed for those who never entered nursing homes.
Change in Housing Wealth The financial wealth trends illustrated in Figure 8 and Figure 11 are very similar to total trends in household wealth. Figure 8 shows that for those who constantly live in a nursing home for six months or more, median housing wealth drops to zero, and Figure 11 shows the changes in mean and median housing wealth for both groups between Periods 0 and 3. For those who enter nursing homes, housing wealth drops quickly and steadily, while for those who do not enter nursing homes, housing wealth increases steadily. In particular, for nursing home entrants, Period 0 median housing wealth is $50,640, dropping to $12,144 by Period 1, $5,405 by Period 2 and zero by Period 3. In contrast, for those who never enter nursing homes, median housing wealth increases from $82,752 in Period 0, to $95,128 in Period 1, $102,695 in Period 2, and $108,100 in Period 3. Two facts are evident. First, people who enter nursing homes have less housing wealth to begin with, and secondly, their household wealth declines steadily after they enter a nursing home. Coile and Milligan (2006) show that in couple households, ownership of a principal residence drops sharply following the death of a spouse, and part of that effect may also be reflected in this data as well.
Change in Higher-Risk Assets Figure 12 shows similar changes in the value of holdings of higher-risk assets which include stocks, mutual funds, bonds, investment trusts, IRAs, etc. Not much may be inferred from this figure, because in both groups the median holding in higher-risk assets is zero in every period. Some possible reasons behind this trend: The overall sample is of older individuals, and people tend to reduce risky asset holdings as they age. Also, a large section of the sample considered here (AHEAD cohort, born before 1924) had access to defined benefit pension plans, which reduces the likelihood of their holding those assets in IRAs through rollovers. But the broad trends observed in means are similar to the trends observed earlier, which is to say that, over the six-year periods, mean higher-risk assets decline for those who entered nursing home (but less than other types of assets) and increased for those who did not enter nursing homes.
Change in Lower-Risk/Risk-Free Assets Figure 13 shows the changes in lower-risk and risk-free assets (which include checking and savings accounts, CDs, government bonds, Treasury bills, etc.) for both groups from Period 0 to Period 3. Here also, lower-risk/risk-free assets fall steadily for nursing home entrants, but do not change much for those who do not enter nursing homes. For example, for nursing home entrants, Period 0 median lower-risk/risk-free assets are $5,348, a figure that drops sharply to $3,243 in Period 1, but declines slowly thereafter. On the other hand, for those who never enter nursing homes, Period 0 median lower-risk/risk-free assets are $9,696, which then increase slightly to $10,120 by the end of the sixyear period. Similar trends can be observed in means.
ebri.org Issue Brief • June 2012 • No. 372
12
Figure 8 Holdings of Different Types of Household Asse ts (in 2010 Dollars), by Number of Nights* Spent in a Nursing Home 0–30 Nights Total Household Wealth Total Financial Wealth Total Housing Wealth Stocks, Bonds and IRAs Bank Accounts, CDs, T–bills Transportation
Mean $298,635 192,643 105,991 101,900 42,485 7,691
Median $108,300 28,510 51,918 0 5,060 2,424
31–180 Nights Mean $255,500 175,331 80,169 91,773 45,209 4,941
Median $67,836 12,562 5,596 0 3,243 0
More Than 180 Nights Mean $157,371 119,123 38,248 63,458 29,622 1,929
Median $5,518 1,090 0 0 506 0
So urce: Emplo yee B enefit Research Institute estimates fro m the Health and Retirement Study. * These are the to tal number o f nights spent by an individual in a nursing ho me o r lo ng–term care facility in past two years.
Figure 9 Change in Total Household Wealth for Nursing Home Entrants and Non-Entrants (in 2010 Dollars) Period 0 1 2 3
Nursing Home Entrants Mean Median $290,048.00 $102,073.00 263,348 79,000 267,680 78,000 244,487 60,720
Nursing Home Non-Entrants Mean Median $369,114.00 $173,848.00 428,996 197,556 431,978 213,490 441,117 222,686
Source: Employee Benefit Research Institute estimates from the Health and Retirement Study. Note : For a nursing home entrant, Period 0 corresponds to the last period observed before entering a nursing home for the first time. Period 1 corresponds to the first period observed after entering a nursing home for the first time. Period 2 is two years after Period 1, and Period 3 is two years after Period 2. For non-entrants, the periods correspond to four consecutive surveys, and the initial Period 0 for this group was chosen randomly from the years 2000‒2004.
Figure 10 Change in Household Financial Wealth for Nursing Home Entrants and Non-Entrants (in 2010 Dollars) Period 0 1 2 3
Nursing Home Entrants Mean Median $193,590 $25,449 177,861 17,512 175,804 14,180 161,939 10,626
Nursing Home Non-Entrants Mean Median $247,520 $63,300 284,715 69,084 266,632 68,211 277,335 68,103
Source: Employee Benefit Research Institute estimates from the Health and Retirement Study. Note : For nursing home entrants, Period 0 corresponds to the last period observed before entering a nursing home for the first time. Period 1 corresponds to the first period observed after entering a nursing home for the first time. Period 2 is two years after Period 1, and Period 3 is two years after Period 2. For non-entrants, the periods correspond to four consecutive surveys, and the initial Period 0 for this group was chosen randomly from the years 2000‒2004.
Figure 11 Change in Household Housing Wealth for Nursing Home Entrants and Non-Entrants (in 2010 Dollars) Period 0 1 2 3
Nursing Home Entrants Mean Median $96,458 $50,640 85,486 12,144 91,876 5,405 82,548 0
Nursing Home Non-Entrants Mean Median $121,594 $82,752 144,280 95,128 165,345 102,695 163,781 108,100
Source: Employee Benefit Research Institute estimates from the Health and Retirement Study. Note : For a nursing home entrant, Period 0 corresponds to the last period observed before entering a nursing home for the first time. Period 1 corresponds to the first period observed after entering a nursing home for the first time. Period 2 is two years after Period 1, and Period 3 is two years after Period 2. For non-entrants, the periods correspond to four consecutive surveys, and the initial Period 0 for this group was chosen randomly from the years 2000‒2004.
ebri.org Issue Brief • June 2012 • No. 372
13
Change in Transportation Figure 14 shows the change in transportation assets (i.e., vehicles) for both groups between Periods 0 and 3. Again, the Period 0 median transportation wealth is much lower for those who enter nursing homes compared with those who don't. It is also the asset type that shows the fastest decline for nursing home entrants: In Period 0, the median transportation wealth for nursing home entrants is $2,308, dropping to $0 by Period 1 and remaining there through Period 3. In contrast, the Period 0 median transportation wealth for those who never enter a nursing home is $7,596— and that changes little (to $7,527) by Period 3.
Assets of Those Who Use Professional Home Care and Those Who Don’t Figure 15 shows the average (both mean and median) holdings of different types of assets for those who used professional home care, and those who did not, over the survey period. The overall level of assets (total household wealth) is much higher for those who did not use professional home care: Their median total wealth is $192,718, compared with $94,561 for those who did use professional home care. Similar differences prevail in all categories of assets. The largest difference is in transportation wealth: The median transportation wealth for those who did not use professional home care is almost 4 times that of those who did.
Regression Results As mentioned above, one of the problems of comparing the level of assets of those who had been admitted to nursing homes and those who hadn’t is the difference in age; the average age of those admitted to nursing homes is higher, which could result in lower overall asset levels. It is not clear if the decumulation rates are also different between the two groups, but to understand the effect of nursing home entry on different types of household assets, it is important to control for the effect of age. This is done through a regression analysis (described briefly in Appendix A). The results from that analysis suggest that, even after controlling for age, time trends and unobserved individual effects, nursing home entry has a large and statistically significant effect on all types of household wealth, except higher-risk assets. Appendix B shows some of the selected results from the regressions. For example, nursing home entry reduces total household wealth by 34 percentage points. The regression results show that nursing home entry reduces housing wealth by 5 percentage points. Previous results have shown that for those who live in nursing homes for six months or more have very little housing wealth, though the size of that group is relatively small. Most nursing home stays are of shorter duration. So for the majority of nursing home entrants, the effect on housing wealth is smaller than on other asset types because housing wealth is relatively illiquid and people may be less inclined to sell their houses for bequests or other purposes.
Conclusion Nursing home stays are generally not covered by Medicare, yet they can be very expensive and often very long. Indeed, one of the biggest health expenditure shocks a retired individual can experience is entry into a nursing home. LTCI can safeguard people from the catastrophic costs of nursing home care, but few people purchase LTCI. As a result, those who live long enough in such facilities can lose all their assets until those expenses are picked up by Medicaid. This study uses data from the Health and Retirement Study to show some of these trends and how nursing home stays affect household asset holdings. The important findings are: Nursing home stays among retirees have increased steadily during the past decade. Among people age 65 and higher, nursing home stays increased from 6 percent in 2000 to 8.5 percent in 2010. Among nursing home entrants, purchase of long-term care insurance (LTCI) has also increased steadily during the past decade, but coverage remains low (14 percent in 2010). For those who spent six months or more in a nursing home facility, nearly half were covered by Medicaid.
ebri.org Issue Brief • June 2012 • No. 372
14
People who reported being most likely to enter a nursing home in the near future were also less likely to purchase LTCI.
Over the past decade, use of professional home-health care has increased steadily and so has the percentage of people with LTCI who use professional home-health care. But here also (for those using home-health care), LTCI coverage is low—13.2 percent in 2010. For people who have lived in a nursing home for six months or more, their median total household wealth was only $5,518, and their median housing wealth and transportation wealth was zero. After the first entry into a nursing home, total household wealth fell steadily over a six-year period. By comparison, total household wealth increased steadily over any six-year period for those who never entered a nursing home. For nursing home entrants, median housing wealth fell to zero within six years after the initial nursing home entry; median transportation wealth dropped to zero within two years after the first nursing home entry. Both mean and median levels of every type of wealth were much higher for those who did not use professional home health care than those who did. Nursing home stays had strong and statistically significant negative effects on every type of household asset holdings except higher-risk assets, such as stocks, bonds, and mutual funds.
ebri.org Issue Brief • June 2012 • No. 372
15
Figure 12 Change in Higher-Risk Assets* for Nursing Home Entrants and Non-Entrants (in 2010 Dollars) Nursing Home Entrants Mean Median $97,964 $0 90,540 0 94,401 0 90,803 0
Period 0 1 2 3
Nursing Home Non-Entrants Mean Median $119,018 $0 142,984 0 133,012 0 130,486 0
Source: Employee Benefit Research Institute estimates from the Health and Retirement Study. Note : For a nursing home entrant, Period 0 corresponds to the last period observed before entering a nursing home for the first time. Period 1 corresponds to the first period observed after entering a nursing home for the first time. Period 2 is two years after Period 1, and Period 3 is two years after Period 2. For non-entrants, the periods correspond to four consecutive surveys, and the initial Period 0 for this group was chosen randomly from the years 2000 ‒2004. * These include stocks, mutual funds, investment trusts, bonds, and IRA balances.
Figure 13 Change in Lower-Risk/ Risk-free Assets* for Nursing Home Entrants and Non-Entrants (in 2010 Dollars) Nursing Home Entrants Mean Median $42,659 $5,348 43,063 3,243 38,311 3,036 37,907 3,000
Period 0 1 2 3
Nursing Home Non-Entrants Mean Median $46,638 $9,696 50,799 9,696 48,089 9,232 53,985 10,120
Source: Employee Benefit Research Institute estimates from the Health and Retirement Study. Note : For a nursing home entrant, Period 0 corresponds to the last period observed before entering a nursing home for the first time. Period 1 corresponds to the first period observed after entering a nursing home for the first time. Period 2 is two years after Period 1, and Period 3 is two years after Period 2. For non-entrants, the periods correspond to four consecutive surveys, and the initial Period 0 for this group was chosen randomly from the years 2000 ‒2004. * These include checking, savings, other money market accounts, CDs, government bonds, and Treasury bills.
Figure 14 Change in Transportation Assets* for Nursing Home Entrants and Non-Entrants (in 2010 Dollars) Period 0 1 2 3
Nursing Home Entrants Mean Median $8,213 $2,308 6,060 0 5,390 0 5,127 0
Nursing Home Non-Entrants Mean Median $14,087 $7,596 14,369 8,078 13,626 7,567 14,017 7,527
Source: Employee Benefit Research Institute estimates from the Health and Retirement Study. Note : For a nursing home entrants, Period 0 corresponds to the last period observed before entering a nursing home for the first time. Period 1 corresponds to the first period observed after entering a nursing home for the first time. Period 2 is two years after Period 1, and Period 3 is two years after Period 2. For non-entrants, the periods correspond to four consecutive surveys, and the initial Period 0 for this group was chosen randomly from the years 2000 ‒2004. * These include the net value of vehicles owned.
Figure 15 Different Types of Assets for Those Who Did and Did Not Use Professional Home Care (in 2010 Dollars)
Total Household Wealth Total Financial Wealth Total Housing Wealth Stocks, Bonds and IRAs Bank Accounts, CDs, T-bills Transportation
Used Home Care Mean Median $328,415 $94,561 220,425 19,872 107,989 48,480 104,869 0 38,290 3,243 9,396 2,532
Did Not Use Home Care Mean Median $487,280 $192,718 335,266 67,098 152,013 91,080 158,256 727 46,325 8,000 17,132 10,000
Source: Employee Benefit Research Institute estimates from the Health and Retirement Study.
ebri.org Issue Brief • June 2012 • No. 372
16
References Brown, Jeffrey and Amy Finkelstein. “Insuring long-term care in the U.S.” Journal of Economic Perspectives, 25(4): 119–142, 2011. Brown, Jeffrey and Amy Finkelstein. “The Private Market for Long-Term Care Insurance in the U.S.: A Review of the Evidence.” Journal of Risk and Insurance, 76(1): 5–29, 2009. Centers for Medicare and Medicaid Services (2010) “National Health Expenditures by type of service and source of funds, CY 1960–2008”, available at www.cms.gov/Research-Statistics-Data-and-Systems/Research-StatisticsData-and-Systems.html Coile, Courtney and Kevin Milligan. “How Household Portfolios Evolve After Retirement: The Effect of Aging and Health Shocks.” NBER Working Paper # 12391, 2006. Friedland, Robert B. "Issues Concerning the Financing and Delivery of Long-Term Care." EBRI Issue Brief, no. 86 (Employee Benefit Research Institute, January 1989). Horkitz, Karen. "Long-Term Care Financing and the Private Insurance Market." EBRI Issue Brief, no. 117 (Employee Benefit Research Institute, August 1991). John Hancock Financial. “National Long-Term Care Cost Study (2011).” PR 2011-23 available at www.johnhancock.com/about/news_details.php?fn=apr2011-text&yr=2011 Pincus, Jeremy. "Voluntary Long-Term Care Insurance: Best Practices for Increasing Employee Participation." EBRI Issue Brief, no. 221 (Employee Benefit Research Institute, May 2000). Salisbury, Dallas L. "Long-Term Care: Is the American Public Willing to Pay?" Employee Benefit Notes, vol. 10, no. 11 (Employee Benefit Research Institute, November 1989): 1–2. Snider, Sarah. "Long-Term Care and the Private Insurance Market." EBRI Issue Brief, no. 163 (Employee Benefit Research Institute, July 1995).
Appendix A To estimate the effect of nursing home stays on household wealth, it is important to control for other factors like age. People who stay in nursing homes are older on average than those who don’t, and the simple life-cycle theory of economics implies that older people have less wealth because their assets have generally been depleted for a longer period. Also, individual saving preferences could create unobserved heterogeneity in levels of wealth accumulated and can bias the estimated effects of nursing home stay on household wealth. To address these issues the following regression specification is chosen to estimate the overall effect of nursing home stays on different types of household assets: Assetsit = β0 + β1 NHit + β2 Ageijt + αi + γt + εit Here, Assetsit denotes assets of household i in period t, NHit denotes if household i experienced a nursing home stay in period t, ageijt denotes that household i (defined as the age of the head of household i) belongs to age group j in period t, αi is the unobserved household fixed effect and γt is the wave dummy. Standard errors are clustered around a household. The coefficient of interest which captures the overall effect of nursing home stays on household wealth is β1. These regressions are run for all the different types of assets mentioned in the study. Also, the dependent variable is the log of asset levels.
ebri.org Issue Brief • June 2012 • No. 372
17
Appendix B Regression Results (Selected Coefficients) Age Type of Asset (Dependent Variable) Total Household Wealth Household Financial Wealth Housing Wealth Risky Assets Risk-free Assets Transportation
Nursing Home -.345*** (.028) -.213*** (.031) -.053*** (.017) -.019 (.043) -.220*** (.035) -.125*** (.026)
65‒69 Dropped Dropped Dropped Dropped Dropped Dropped
70‒74 .042*** (.013) 0.001 (.017) 0.009 (.009) -0.037 (.023) 0.017 (.023) .060*** (.014)
75‒79 80‒84 85‒89 .048** 0.019 -.089* (.024) (.035) (.047) -0.031 -0.061 -.151** (.030) (.044) (.059) 0.006 0.006 -.032 (.016) (.023) (.031) -0.082** -0.154*** -.207** (.040) (.059) (.080) 0.011 0.005 -.063 (.039) (.057) (.075) .061** 0.019 -.108** (.025) (.036) (.048)
90 and above -.247*** (.064) -.272*** (.079) -.027 (.042) -.087 (.115) -.235** (.098) -.333*** (.068)
So urce: Emplo yee B enefit Research Institute estimates fro m the Health and Retirement Study. Standard erro rs are repo rted in parantheses. *p<0.10, **p<.05, ***p<.01.
Endnotes 1
Long-term care is a variety of services that includes medical and non-medical care to people who have a chronic illness or disability. Most long-term care is to assist people with support services such as activities of daily living like dressing, bathing, and using the bathroom. Long-term care can be provided at home, in the community, in assisted living or in nursing homes (www.medicare.gov/longtermcare/static/home.asp) 2
The John Hancock Long-Term Care Cost of Care Survey was conducted by LifePlans, Inc. based in Waltham MA, in 2011 and released in April of 2011. The survey represents the costs of more than 11,000 providers across the United States, including nursing homes, assisted living facilities, adult day care centers, and home care agencies. The nine-year average trending results are based on a comparison of data gathered from providers across the country for John Hancock's 2002, 2005, 2008, and 2011 Cost of Care Surveys. 3
Brown and Finkelstein defined a “typical” LTCI policy as one that covers institutional and home care with a 60-day deductible, a four-year benefit period, and a $150 maximum daily benefit with a 5 percent per year acceleration rate.
4
A couple of points to note: First, household wealth reported here does not include respondents’ future expected wealth from Social Security payments, nor, for respondents with defined benefit pension plans, is that expected future income included in the wealth measures. Finally, for holders of defined contribution retirement plans, the assets that remain in the account at retirement are also not included in the household-wealth measures, but the current assets in their IRA are included. 5
The average age of those who lived in a nursing home is 77, compared with 73 for those who did not live in a nursing home. From the sample of those who did not live in a nursing home, households with total assets of more than $5 million were dropped. Also, the top and bottom 1 percent in the age distribution in this group were also dropped to make the age group more comparable to the nursing home population.
ebri.org Issue Brief • June 2012 • No. 372
18
Where the world turns for the facts on U.S. employee benefits. Retirement and health benefits are at the heart of workers’, employers’, and our nation’s economic security. Founded in 1978, EBRI is the most authoritative and objective source of information on these critical, complex issues. EBRI focuses solely on employee benefits research — no lobbying or advocacy.
EBRI stands alone in employee benefits research as an independent, nonprofit, and nonpartisan organization. It analyzes and reports research data without spin or underlying agenda. All findings, whether on financial data, options, or trends, are revealing and reliable — the reason EBRI information is the gold standard for private analysts and decision makers, government policymakers, the media, and the public.
EBRI explores the breadth of employee benefits and related issues.
EBRI studies the world of health and retirement benefits — issues such as 401(k)s, IRAs, retirement income adequacy, consumer-driven benefits, Social Security, tax treatment of both retirement and health benefits, cost management, worker and employer attitudes, policy reform proposals, and pension assets and funding. There is widespread recognition that if employee benefits data exist, EBRI knows it.
EBRI delivers a steady stream of invaluable research and analysis.
EBRI publications include in-depth coverage of key issues and trends; summaries of research findings and policy developments; timely factsheets on hot topics; regular updates on legislative and regulatory developments; comprehensive reference resources on benefit programs and workforce issues; and major surveys of public attitudes. EBRI meetings present and explore issues with thought leaders from all sectors. EBRI regularly provides congressional testimony, and briefs policymakers, member organizations, and the media on employer benefits. EBRI issues press releases on newsworthy developments, and is among the most widely quoted sources on employee benefits by all media. EBRI directs members and other constituencies to the information they need and undertakes new research on an ongoing basis. EBRI maintains and analyzes the most comprehensive database of 401(k)-type programs in the world. Its computer simulation analyses on Social Security reform and retirement income adequacy are unique.
EBRI makes information freely available to all.
EBRI assumes a public service responsibility to make its findings completely accessible at www.ebri.org — so that all decisions that relate to employee benefits, whether made in Congress or board rooms or families’ homes, are based on the highest quality, most dependable information. EBRI’s Web site posts all research findings, publications, and news alerts. EBRI also extends its education and public service role to improving Americans’ financial knowledge through its award-winning public service campaign ChoosetoSave® and the companion site www.choosetosave.org
EBRI is supported by organizations from all industries and sectors that appreciate the value of unbiased, reliable information on employee benefits. Visit www.ebri.org/about/join/ for more.
th
1100 13 Street NW · Suite 878 Washington, DC 20005 (202) 659-0670 www.ebri.org www.choosetosave.org
EBRI Employee Benefit Research Institute Issue Brief (ISSN 0887137X) is published monthly by the Employee Benefit Research Institute, 1100 13th St. NW, Suite 878, Washington, DC, 20005-4051, at $300 per year or is included as part of a membership subscription. Periodicals postage rate paid in Washington, DC, and additional mailing offices. POSTMASTER: Send address changes to: EBRI Issue Brief, 1100 13th St. NW, Suite 878, Washington, DC, 20005-4051. Copyright 2012 by Employee Benefit Research Institute. All rights reserved. No. 372.
Who we are
What we do
Our publications
Orders/ Subscriptions
The Employee Benefit Research Institute (EBRI) was founded in 1978. Its mission is to contribute to, to encourage, and to enhance the development of sound employee benefit programs and sound public policy through objective research and education. EBRI is the only private, nonprofit, nonpartisan, Washington, DC-based organization committed exclusively to public policy research and education on economic security and employee benefit issues. EBRI’s membership includes a cross-section of pension funds; businesses; trade associations; labor unions; health care providers and insurers; government organizations; and service firms. EBRI’s work advances knowledge and understanding of employee benefits and their importance to the nation’s economy among policymakers, the news media, and the public. It does this by conducting and publishing policy research, analysis, and special reports on employee benefits issues; holding educational briefings for EBRI members, congressional and federal agency staff, and the news media; and sponsoring public opinion surveys on employee benefit issues. EBRI’s Education and Research Fund (EBRI-ERF) performs the charitable, educational, and scientific functions of the Institute. EBRI-ERF is a tax-exempt organization supported by contributions and grants. EBRI Issue Briefs is a monthly periodical with in-depth evaluation of employee benefit issues and trends, as well as critical analyses of employee benefit policies and proposals. EBRI Notes is a monthly periodical providing current information on a variety of employee benefit topics. EBRI Fundamentals of Employee Benefit Programs offers a straightforward, basic explanation of employee benefit programs in the private and public sectors. The EBRI Databook on Employee Benefits is a statistical reference work on employee benefit programs and work force-related issues. Contact EBRI Publications, (202) 659-0670; fax publication orders to (202) 775-6312. Subscriptions to EBRI Issue Briefs are included as part of EBRI membership, or as part of a $199 annual subscription to EBRI Notes and EBRI Issue Briefs. Change of Address: EBRI, 1100 13th St. NW, Suite 878, Washington, DC, 20005-4051, (202) 659-0670; fax number, (202) 775-6312; e-mail:
[email protected] Membership Information: Inquiries regarding EBRI membership and/or contributions to EBRI-ERF should be directed to EBRI President Dallas Salisbury at the above address, (202) 659-0670; e-mail:
[email protected]
Editorial Board: Dallas L. Salisbury, publisher; Stephen Blakely, editor. Any views expressed in this publication and those of the authors should not be ascribed to the officers, trustees, members, or other sponsors of the Employee Benefit Research Institute, the EBRI Education and Research Fund, or their staffs. Nothing herein is to be construed as an attempt to aid or hinder the adoption of any pending legislation, regulation, or interpretative rule, or as legal, accounting, actuarial, or other such professional advice. www.ebri.org EBRI Issue Brief is registered in the U.S. Patent and Trademark Office. ISSN: 0887137X/90 0887137X/90 $ .50+.50
© 2012, Employee Benefit Research InstituteEducation and Research Fund. All rights reserved.