TECHNICAL REPORTS: ATMOSPHERIC POLLUTANTS AND TRACE GASES TECHNICAL REPORTS
Effects of Reducing Dietary Nitrogen on Ammonia Emissions from Manure on the Floor of a Naturally Ventilated Free Stall Dairy Barn at Low (0–20°C) Temperatures Lifeng Li, Joby Cyriac, Katharine F. Knowlton, and Linsey C. Marr, Susan W. Gay, Mark D. Hanigan, and Jactone Arogo Ogejo* Virginia Polytechnic Institute and State University This study was conducted to determine the potential for reducing ammonia (NH3) emissions from manure deposited on the floor of a naturally ventilated free stall barn by midlactation dairy cows fed reduced or normal N diets. Two crude protein (CP) diets (178 g kg–1 [high] and 159 g kg–1 [low] dry matter ), were used. The diets were fed to 48 Holstein cows in a replicated crossover design with two pens per diet. The NH3 emitted from the manure deposited on the floor was measured using a dynamic flux chamber. The NH3 emissions were 2.7 (± 2.0) and 2.9 (± 1.8) g N cow–1 d–1 for high and low CP diets, respectively. Ammonia emission rates were significantly affected by manure pH, TKN, and ambient air temperature (P < 0.05). Dietary CP affected the feed N intake (8.7 and 7.1 kg pen–1 d–1 for high and low CP, respectively), but did not affect milk yield (500 and 489 kg pen–1 d–1 for high and low CP, respectively) and milk CP content (30 g kg–1 for both the high and low CP diets). The N utilization efficiency was 29.0% and 32.7% for the high and low CP diets, respectively. Reducing dietary CP reduced total Kjeldahl N (TKN) in manure, but did not affect the total ammoniacal N (TAN) in manure and had no significant effect on the ammonia emission rates from the barn floor.
T
here are global concerns about the contribution of agricultural operations to the N pollution of the environment, especially as ammonia (NH3). Some of the concerns about NH3 emitted to the atmosphere are (i) undesirable N deposition in nutrient sensitive ecosystems, (ii) formation of light–scattering aerosols resulting in haze and visibility impairment, and (iii) formation of respirable aerosol particles, which are a health concern (Arogo et al., 2003a). Of the animal groups, dairy cow feeding operations are one of the sources of NH3 emitted to the atmosphere. For example, for the year 2002, the USEPA (2004) estimated dairy operations to be responsible for 23% (0.54 million tonnes yr–1) of the total NH3 emissions inventory from U.S. animal husbandry operations. Thus, it is necessary to develop effective mitigation practices for dairy operations as part of the national strategy to reduce NH3 emissions. Estimates of annual NH3 emissions from housed dairy cows range from 6 to 40 kg animal–1 yr–1 (Aneja et al., 2008, Monteny et al., 2002). The variation in the reported NH3 emissions can be attributed to diets, manure management in the barns, environmental conditions at the time of measurement, methods of measurement, and mitigation practices in the barns (Arogo et al., 2006; de Boer et al., 2002; Monteny et al., 2002). Ammonia emitted from manure is produced primarily through the hydrolysis of urea in urine, usually accelerated by urease present in the feces (Muck, 1982). Dairy cows use N inefficiently, and up to 75 to 85% of N ingested is excreted in manure, and 40 to 50% of the N in manure is contained in urinary urea (Muck, 1982, Tamminga, 1992). Reduction of NH3 emitted from dairy barns can be achieved by feeding diets containing low CP, practicing manure management methods that minimize NH3 emissions, designing barns to optimize ventilation and minimize surface areas from which NH3 can be emitted, and controlling environmental conditions (temperature, wind speeds, relative humidity)
Copyright © 2009 by the American Society of Agronomy, Crop Science Society of America, and Soil Science Society of America. All rights reserved. No part of this periodical may be reproduced or transmitted in any form or by any means, electronic or mechanical, including photocopying, recording, or any information storage and retrieval system, without permission in writing from the publisher.
L. Li and J. Arogo Ogejo, Dep. of Biological Systems Engineering, Virginia Polytechnic Institute and State Univ., Blacksburg, VA 24061. J. Cyriac, K.F. Knowlton, and M.D. Hanigan, Dep. of Dairy Science, Virginia Polytechnic Institute and State Univ., Blacksburg, VA 24061. L.C. Marr, Dep. of Civil and Environmental Engineering, Virginia Polytechnic Institute and State Univ., Blacksburg, VA 24061. S.W. Gay, current address, 179 Hunters Path, Bellefonte, PA 16823.
Published in J. Environ. Qual. 38:2172–2181 (2009). doi:10.2134/jeq2008.0534 Published online 11 Sept. 2009. Received 30 Dec. 2008. *Corresponding author (
[email protected]). © ASA, CSSA, SSSA 677 S. Segoe Rd., Madison, WI 53711 USA
Abbreviations: AA, amino acid; ADF, acid detergent fiber; AFO, animal feeding operation; BW, body weight; COD, chemical oxygen demand; CP, crude protein; DM, dry matter; DMI, dry matter intake; MUN, milk urea nitrogen; NDF, neutral detergent fiber; NEL, net energy of lactation; NRC, National Research Council; RDP, ruminally degradable protein; RUP, ruminally undegradable protein; TAN, total ammoniacal nitrogen; TKN, total Kjeldahl nitrogen; TMR, total mixed ration; TS, total solids; VS, volatile solids.
2172
both inside and outside the barn (Arogo et al., 2006; Burgos et al., 2006, James et al., 1999, Paul et al., 1998). Reducing CP to lower dietary N to mitigate NH3 emissions from dairy cows is beneficial if the reduction does not affect milk production. Several dietary N studies have shown better utilization of N and subsequent reduction in NH3 emissions from manure as dietary CP levels are reduced to concentrations below commonly accepted requirements for animal metabolism and maintenance (Paul et al., 1998; James et al., 1999; Frank and Swensson, 2002; Kebreab et al., 2002; Broderick, 2003). Paul et al. (1998) used two diets with 164 and 123 g kg–1 CP and observed NH3 emissions of 38 and 23% of the total manure N, respectively. James et al. (1999) reported that reducing dietary CP from 110 to 96 g kg–1 lowered NH3 emissions from manure from Holstein heifers by 28%. Kebreab et al. (2002) reported that reducing dietary CP to 160 g kg–1 had the potential to reduce NH3 production per cow by 20%. Powell et al. (2008) reported reductions in excreted N by reducing dietary CP from 215 to 170 g kg–1 without affecting milk N. Cyriac et al. (2008) also reported that cows maintained milk production and dry matter intake (DMI) when CP concentrations in the diet were reduced from 184 to 159 g kg–1 via changes in ruminally degradable protein (RDP; 113 to 88 g kg–1 of diet DM, respectively) suggesting that a different dietary approach may avoid milk production losses. Reducing dietary CP to 130 to140 g kg–1 reduced NH3 emissions from manure by up to 55% but also resulted in reduced milk production (Frank and Swensson, 2002; Burgos et al., 2006). Mixed results on the effects of reducing dietary N on NH3 emissions from dairy barns have been reported in studies using laboratory scale chambers (Misselbrook et al., 2005), full-scale buildings (Powell et al., 2008; Rumburg et al., 2008; van Duinkerken et al., 2005; Zhang et al., 2005; Smits et al., 1995), and models (Smits et al., 2003; de Boer et al., 2002; Monteny et al., 2002; Monteny and Erisman, 1998). Misselbrook et al. (2005) reported that even though diets containing high (194 g kg–1) CP had 90% more urine N concentration than low (136 g kg–1) CP diets, there was no difference in NH3 volatilized from a simulated barn floor for both diets. Powell et al. (2008) reported differences in NH3 emitted due to reduced dietary CP (from 215–170 g kg–1) from a mechanically ventilated scraped dairy barn only in the spring and no differences in NH3 emissions reductions in the fall or winter. Most full-scale barn NH3 emissions measurements have been done on barns where manure is scraped from the floor and stored externally, combinations of manure scraping and flushing from the barn floors, and slatted floors with manure storage underneath (Powell et al., 2008; Zhang et al., 2005; van Duinkerken et al., 2005; Smits et al., 1995). There are few studies on NH3 emissions from barns where manure is removed from the floor exclusively by flushing. The objective of this study was to determine the potential of reducing dietary N for lactating dairy cows to reduce NH3 emissions from manure on a solid floor of a flushed free stall dairy barn at low temperature (0–20°C) conditions. Based on the literature, it was anticipated that with comparable milk N outputs, reductions in dietary N must be reflected in the manure N output, and thus the dietary effects would be reflected in NH3 emissions. Li et al.: Reducing Dietary N on Ammonia Emissions from Manure
Materials and Methods Animal Selection, Diets, and Housing Forty-eight Holstein cows (40 multiparous and 8 primiparous) were used in the study. Days in milk and body weight (BW) averaged 122 ± 62 d and 648 ± 69 kg, respectively at the start of the study. Cows were randomly assigned to one of four groups to equalize days in milk, parity, BW, milk production, and pregnancy status. Each group was randomly assigned to one of the four pens. The study design was a replicated crossover with two diets offered with two pens per diet over four periods. The pen served as the experimental unit with 12 cows in each pen. The experimental periods lasted 18 d, with Days 1 to 11 used for adjustment to the diets and Days 12 to 18 for data collection. The 3-wk periods used in this study should have been adequate to allow full dietary responses and to test any potential metabolizable protein deficiency for the low CP diet (Krober et al., 2000). In the first period the two diets were randomly assigned to the pens. In the second period, the diets for each pen were switched (from low to high CP and vice versa). The diets fed to each pen in the third period were the same as the diets fed in the second period. During the fourth period, pens were switched back to the diets they received in the first period. All animal procedures were approved by the Virginia Tech Animal Care and Use Committee. Diets were formulated to meet NRC (2001) recommendations for net energy of lactation (NEL), ruminally undegradable protein (RUP), minerals, and vitamins for a mature lactating Holstein cow (70 d in milk) and producing 36.3 kg milk per day containing 3.5 g kg–1 fat. Three concentrate mixes were formulated and blended with the forages to attain two diets containing 178 or 159 g kg–1 CP on a DM basis (Table 1), by adjusting RDP while keeping RUP constant. These two diets were used in a previous study and found to support equal levels of milk production (Cyriac et al., 2008). The DM percentages of corn silage and haylage were determined weekly, and diets were adjusted accordingly to ensure a constant forage-to-concentrate ratio (47.5:52.5) on a DM basis. Cows were fed a total mixed ration (TMR) once daily at a rate adequate to achieve an average of 10% daily refusals and had free access to fresh water. Feed offered and refused for individual cows were recorded daily. Cows were milked twice daily at 0130 and 1400 h, and milk yields were recorded at each milking. Body weights were recorded daily after milking as the cows exited the milking parlor. Days 1 to 10 of each period served as an adjustment period. The TMR, orts, and major ingredients of the TMR (corn silage, high moisture rolled corn, mixed grass legume silage, cotton seed, and the grain mix) were sampled each day during Days 12 to 18 of each period, composited for the week and stored at-20°C until analyzed. Milk samples were collected for compositional analysis for 4 d during Days 12 to 18 of each period. Cows were housed in a naturally ventilated free stall barn with a solid floor at the Virginia Tech Dairy Complex (VTDC). The barn is partitioned into pens. Pens are configured with two alleys (feed alley and back alley) running the length of the pen which are located on each side of a double row of resting stalls on both sides, One crossover alley containing a watering trough
2173
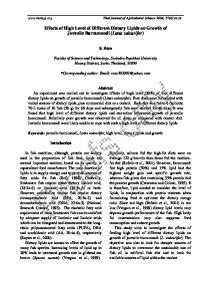
allowed cows to move between the alleys (Fig. 1). Manure is flushed from both alleys every 6 h using recycled wastewater from the manure treatment system (DeBusk et al., 2008). On each test day, the manure flush system was turned off for 18 h starting at 0200 h. The 12 cows assigned for manure collection on that day were moved to a precleaned test pen (same configuration and size as the pens used for housing the cows) for a period of 6 h (0200–0800 h). The appropriate test ration was provided for the duration of the 6-h period. The 6-h manure collection period used in this study was necessary to adhere to cows’ natural sleeping schedule and also to accumulate manure that would be collected in a normal 6-h flush schedule. During this time, we observed that the cows mostly ate and slept; and that most manure excretions occurred when the cows were woken up to be moved back to their original holding pen. The pattern of manure deposition was determined by observing the number of urinations and defecations occurring in the feed alley, back alley, bedding area, and the water area in the pen on four separate days during the 0200 to 0800 h time period. Once the defecation and urination patterns were established (58% in the feed alley), manure was collected from the feed alley over a 6-h period and extrapolated to provide daily manure production.
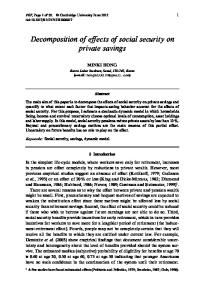
Ammonia Emission Measurements Ammonia emitted from manure on the floor in each of the pens was estimated using a dynamic flux chamber system (Fig. 2) during the last 8 d of each period. The last 8 d of each period were further divided into four subperiods of 2 d. Ammonia emission from each pen was measured for 1 d during each subperiod. The order of measurements for each of the pens was randomly assigned. After the cows were moved from the test pen on each measurement day, the manure was evenly distributed on the floor using a hand-held rake, during the first three periods. The dynamic flux chamber was then set on the floor to measure NH3 flux from manure for a period of 6 h (0900– 1500 h), to correspond to the manure flushing frequency of the barn. The dynamic flux chamber was made of acrylic, had a volume of 49 L, and used a flow rate of 7 L min–1. These specifications were based on an EPA-approved design used to measure emissions at Superfund sites (Eklund, 1992). The NH3 concentration in the chamber was measured every 5 min using a photoacoustic gas analyzer (INNOVA 1312, California Analytical Instruments, Orange, CA). The inflow to the chamber was ambient air containing negligible NH3. Control experiments showed that NH3 losses to the chamber walls were negligible (Sparks, 2008). Outflow from the chamber air was sampled by the NH3 analyzer, and the remainder of the 7 L min–1 flow was exhausted through a vent hole in the top. The flux chamber method was intended to enable measurement of NH3 emissions in a controlled setting. The air velocity and gaseous composition to which manure was exposed inside the chamber likely differed from ambient values, so the measurements did not necessarily represent emissions under realistic conditions. However, this approach facilitated the comparison of the effects of diets on NH3 emissions from the barn floor. 2174
Table 1. Formulated composition of experimental diets. CP, g kg–1 of diet DM 178 159 –––––g kg–1 of DM––––– Corn silage 399 400 Mix grass + legume silage 79 79 Whole linted cotton seed 29 29 Soybean hulls 96 135 203 68 Soybean meal, solvent-ext (480 g kg–1 CP) Protected soybean meal† 0 79 Ground dry corn grain 169 178 Tallow 9 16 Calcium carbonate 5 4 Dicalcium phosphate‡ 0 2 Sodium bicarbonate 2 2 Salt 5 5 Trace mineral and vitamin mix§ 4 4 † Hivap, Land O’ Lakes/Purina Feed, Statesville, NC. ‡ Contained 220 g kg–1 Ca and 193 g kg–1 P. § Land O’ Lakes/Purina Feed, Statesville, NC; formulated to provide (per kg DM) 25 × 105 IU of vitamin A, 400,000 IU of vitamin D, and 10 × 105 IU of vitamin E, 0.1 mg of Co, 12 mg of Cu, 0.7 mg of I, 60 mg of Fe, 48 mg of Mn, 48 mg of Zn, 0.3 mg of Se. Ingredients
During the fourth period, we fixed the quantity of manure under the dynamic flux chamber at 0.48 kg to ensure the same quantity of manure under the chamber. We based this decision on emerging results from the first three periods that showed minimal differences in quantities of NH3 emitted from different diets. We suspected that uneven distribution of manure on the floor may have masked the ability to detect differences in emissions. The quantity of manure (0.48 kg) was calculated based on observing and measuring manure distribution density in the feed alley (2.18 kg m–2) and scaling it to the area covered by the chamber (0.22 m2). Temperatures in the chamber headspace, barn air, and manure surface were recorded every 5 min using data-loggers (HOBO U12–008, Onset Inc., MA). Manure samples were obtained from six random locations at the beginning of the NH3 flux measurement, composited and 250 mL taken for analyses. After completion of the measurement on each test day, 250 mL of manure was sampled from the emitting area under the chamber.
Sample Analysis Milk samples were sent to the United Federation of DHIA laboratory (Blacksburg, VA) and analyzed for composition. Milk true protein, fat, lactose, and somatic cell count (SCC) were measured using a Fossomatic 4000 Combi infrared analyzer (Eden Prairie, MN). Milk urea N (MUN) concentration was determined using a modified Berthelot procedure (ChemSpec 150 Analyzer; Bentley Instruments, Chaska, MN). Frozen feed samples were later thawed, oven dried at 60°C to determine DM, ground through a Wiley mill (1-mm screen; Arthur H. Thomas, Philadelphia, PA) and sent to Dairyland Laboratories, Arcadia, WI for nutrient analyses. The total Kjeldahl N (TKN), ash, and DM contents were determined according to AOAC methods (AOAC, 1997). Acid detergent fiber (ADF) and lignin were determined according to method
Journal of Environmental Quality • Volume 38 • November–December 2009
Fig. 1. Barn layout and flush system diagram for facilities used in the study. Cows were housed in pens R1 through R4. Ammonia measurements were conducted in pen C4. Values in parenthesis indicate the number of free stalls in each pen.
Fig. 2. Schematic of the dynamic flux chamber used for measurement of NH3 emission rates.
973.18 (AOAC, 1997) and neutral detergent fiber (NDF) according to van Soest et al. (1991). Soluble crude protein (SCP), neutral detergent–insoluble crude protein (ND-ICP) and acid detergent–insoluble crude protein (AD-ICP) were analyzed as described by Licitra et al. (1996). Manure samples were analyzed for TKN, chemical oxygen demand (COD), total phosphorus (TP), total solids (TS), and volatile solids (VS) using APHA standard methods 4500-Norg B, 5220 D, 4500-P B, 2540 B, and 2540 E, respectively (APHA, 1998). The pH and TAN was determined using a bench top pH/ISE/DO meter (ATI Orion, Boston, MA. 5-star).
Data Analysis The NH3 emission rate (mg m–2 min–1) was calculated using Eq. [1] and the total NH3 emitted during the measurement period was obtained by integrating the emissions measured at 5-min intervals over 6 h. ER = (C × Q)/ A where:
Li et al.: Reducing Dietary N on Ammonia Emissions from Manure
[1]
ER is the NH3 emission rate (mg m–2 min–1), C is the NH3 concentration min in the flux chamber (mg m–3), Q is the air flow rate (m3 min–1), A is the area of chamber bottom (m2). Manure TKN, COD, TAN, TS, VS. and TP concentrations were converted to daily production per pen (kg pen–1 d–1) by multiplying the concentrations (mg kg–1 manure) by the manure excreted in each pen daily (kg pen–1 d–1). Milk yield, BW, excreted N and N utilization efficiency for individual cows were converted to daily values per pen (kg pen–1 d–1) by adding the measured observations for the 12 cows in the pen. The excreted N and N utilization efficiency for cows were calculated according to Wattiaux and Karg (2004), assuming body N gain was negligible: Excreted N (kg pen–1 d–1) = Intake N(kg pen–1 d–1) – Milk N (kg pen–1 d–1)
[2]
N utilization efficiency (%) = 100 × Milk N (kg pen–1 d–1)/ Intake N (kg pen–1 d–1) [3]
2175
Statistical analyses on all data to test the effects of diet, period, and headspace temperature on NH3 emissions from the barn floor were done using the mixed procedure of SAS Institute (2004) with repeated measures. Because head space temperature was affected by period, headspace temperature was used as a covariate. Effects of covariate (NH3 emission data only), diet, period, and the interaction of period and diet were represented by the model: Y = μ + Di + Pj + DPi,j + Tk + Eijk
[4]
where: μ is the overall population mean; Di is the effect of the ith diet (i = 1, 2); Pj is the effect of jth period (j = 1, 2, 3, 4); DPi,j is the interaction of diet and period; and Tk is the effect of headspace temperature (only in model evaluating NH3 emission data); and Eijk is the residual error term (assumed to be random and independently distributed). A multiple regression equation to predict instantaneous NH3 emission rates (mg m–2 min–1) was developed using Proc GLM. All results were reported as least square means. Unless otherwise stated, statistical significance was declared at p < 0.05. The relative sensitivity analysis method adapted from Zerihun et al. (1996) was used to determine the sensitivity (%) of NH3 emission rates to each variable (manure pH, TKN, air temperature, and time) in the equations, using the percent change in NH3 emission rates divided by the percent change in that variable while holding the other variables constant, as shown in Eq. [5]. S (% ) = [(DER/ER )/(Dv i / n i )]×100
[5]
where: S is the relative sensitivity (%) ER is the NH3 emission rate (mg m–2 min–1) νi is the value of the ith variable.
Results and Discussion Diet Composition, Feed Intake, and Milk Production The overall chemical composition of the two diets used in this study is presented in Table 2 and the chemical composition of the ingredients used to formulate the diets is presented in Table 3. The dietary DM contents were 497 and 476 g kg–1 for the high and low CP diets, respectively. Chemical composition of individual feed ingredients is reported in Table 3. Production data are given in Table 4. Both DMI and CP intake of cows fed the low CP diet were significantly lower (P < 0.01) than those of cows receiving the high CP diet. The difference in milk production from the two diets was not significant although milk production on the low CP diet tended
2176
be lower (P < 0.06). Similar observations were made by Cyriac et al. (2008), Gressley and Armentano (2007), and Reynal and Broderick (2005). The decline in energy intake associated with the reduced DMI likely led to the numerical reduction in milk yield. The differences in milk CP concentration and protein yield from the two diets were not significantly different from each other despite the significant reduction in CP intake. The N utilization efficiency for milk production was 29.0 and 32.7% (P < 0.01) for cows fed the high and low CP diets, respectively (Table 4). Milk urea N decreased significantly (P < 0.01) from 213 to 171 mg L–1 for cows fed the high and low CP diets although concentrations for both diets were greater than expected based on results from other studies (Kalscheur et al., 2006, Reynal and Broderick, 2005). Johnson and Young (2003) indicated a role of genetics in MUN concentrations, which may partly explain the greater than expected MUN values as compared to the target range of 80 to 120 mg L–1, which was obtained by analyzing data set obtained from DHIA labs who conducted milk compositional analysis of dairy cow milk (Kohn et al., 2002). Despite this difference, MUN concentrations were clearly responsive to dietary CP.
Manure Characteristics The characteristics of manure as excreted are presented in Table 5. Manure TKN concentrations for the high and low CP diets were 4140 and 3810 mg kg–1, respectively. The manure TAN were 2.3 and 3.3% of the TKN for the high and low CP diets, respectively. Reducing dietary CP resulted in a significant reduction in manure TKN (P < 0.03), but did not translate to a reduction in TAN. There was a minimal change in TKN during the 6-h test period suggesting minimal mineralization of organic N. The change in manure TKN was not significant over the course of the NH3 emission measurement period (P < 0.12 and 0.78 for the high and low CP diets, respectively). Other manure characteristics: COD, organic N, TS, VS, pH, and TP were not significantly affected by the dietary treatment. The pH of the manure for the high and low CP diets were 6.3 and 6.5, respectively. The daily manure production per cow was estimated at 50.8 kg d–1 and used in the calculation of NH3 emission rates. The estimated manure output in this study was 25% lower than the 68 kg d–1 listed in the ASABE D384.2 manure characteristics standard (ASABE 2005). However, the manure output we Table 2. Chemical composition of the high and low CP diets. CP, g kg–1 of diet DM Item 178 159 DM, g kg–1 of diet 497 476 113 88 RDP, g kg–1 of DM Soluble protein, g kg–1 of CP 356 336 ND-ICP, g kg–1 of CP† 11 12 AD-ICP, g kg–1 of CP‡ 23 25 OM, g kg–1 of DM 934 936 NDF, g kg–1 of DM 346 351 ADF, g kg–1 of DM 199 207 22 21 Lignin, g kg–1 of DM † ND-ICP = neutral detergent– insoluble crude protein. ‡ AD-ICP = acid detergent– insoluble crude protein.
Journal of Environmental Quality • Volume 38 • November–December 2009
Table 3. Chemical composition of individual ingredients used in the experimental diets. High RDP Low RDP Item conc. mix conc. mix Basal mix† Corn silage DM, g kg–1 of feed 868 881 876 323 OM, g kg–1 of DM 908 921 955 962 NDF, g kg–1 of DM 196 219 529 390 ADF, g kg–1 of DM 129 162 385 239 Lignin, g kg–1 of DM 14 9 19 17 CP, g kg–1 of DM 296 219 129 85 Soluble protein, g kg–1 of CP 189 107 219 525 ND-ICP, g kg–1of CP 20 26 36 18 7 9 12 12 AD-ICP, g kg–1 of CP † Basal mix was added at constant rate across treatments. ‡ SBM = soybean meal. § Protected SBM = HiVap, Land O’ Lakes/Purina Feed, Statesville, NC. ¶ SH = soyhulls. Table 4. Feed intake, milk yield, milk composition, and BW of dairy cows fed diets with different concentrations of crude protein (CP). CP, g kg–1 of diet DM 178 159
Item SEM† P value Intake, kg pen−1 d–1‡ DM 304.1 278.5 3.1 0.01 CP 54.2 44.4 0.54 0.01 N 8.7 7.1 0.09 0.01 Milk Production 500 489 4.2 0.06 Milk yield, kg pen–1 d–1 Milk CP, g kg–1 30 30 0.3 1.8 Milk fat, g kg–1 36 35 0.5 0.6 Milk lactose, g kg–1 48 48 0.3 6.2 Milk CP, kg pen–1 d–1 14.8 14.6 0.11 0.28 Milk fat, kg pen–1 d–1 18.0 17.1 0.11 0.02 MUN, mg L–1§ 213 171 0.16 0.01 Excreted N, kg pen–1 d–1¶ 6.3 4.8 0.23 0.01 N utilization efficiency,%# 29.0 32.7 1.06 0.01 7774 7733 86.5 0.78 BW, kg pen–1 d–1 † SEM = standard error of means. ‡ 12 cows pen–1. § MUN = milk urea N. ¶ Excreted N (kg pen–1 d–1) = Intake N (kg pen–1 d–1) – Milk N (kg pen–1 d–1). # N utilization efficiency (%) = 100 × Milk N (kg pen–1 d–1)/Intake N (kg pen–1 d–1).
observed was comparable to the corrected values of 50 to 55 kg cow–1 d–1 reported by Powell et al. (2008). Nonetheless, two possible sources of inaccuracies in determining total manure output in our study were our inability to collect all the urine from the cows in the pens and the assumption the fecal and urine output by the cows is same throughout the day (over a 24 h period).
Ammonia Emission Rates Typical time series of NH3 flux and chamber headspace temperature are presented in Fig. 3. Emission rate and temperature are strongly correlated, as expected. Statistical analysis on the effect of diet, chamber headspace temperature, period, and their interactions on NH3 emission rates from the barn floor was not significant (P > 0.05). However, comparisons of the flux chamber headspace temperatures showed significant differences (P < 0.0001) during the periods of measurements. Temperatures in periods 1, 2, and 3 were not significantly dif-
Li et al.: Reducing Dietary N on Ammonia Emissions from Manure
Haylage 479 884 475 382 63 183 558 41 14
Cotton seed 877 960 461 342 96 191 178 27 19
SBM‡ 873 928 70 39 9 548 158 9 7
Protected SBM§ 911 931 64 47 7 509 57 8 8
SH¶ 890 945 627 447 21 144 265 44 7
Table 5. Mean manure characteristics, chamber headspace temperature and ammonia N emissions affected by CP in the diet. CP, g kg–1 of diet DM SEM† P value Item 178 159 Total manure, kg cow–1 d–1 50.8 50.8 – – 115 110 7.1 0.68 Total COD–before test, g kg–1‡ TKN–before test, mg kg–1§ 4160 3730 135 0.04 TKN–after test, mg kg–1 4120 3900 146 0.31 TAN–before test, mg kg–1¶ 140 100 14 0.05 TAN–after test, mg kg–1 130 180 33 0.34 TS–before test, g kg–1# 150 160 6 0.05 TS–after test, g kg–1 150 150 4 0.98 VS–before test, g kg–1†† 130 150 5 0.05 VS–after test, g kg–1 140 140 4 0.91 pH–before test 6.5 6.2 0.2 0.17 pH–after test 6.5 7.1 0.2 0.03 TP–before test, mg kg–1‡‡ 810 860 87 0.70 Chamber headspace temperature, °C 11.6 10.9 1.5 0.75 2.7 2.9 0.5 0.82 Ammonia N emissions, g d–1 cow–1 † SEM = standard error of means. ‡ COD = chemical oxygen demands. § TKN = total Kjeldahl N. ¶ TAN = total Ammoniacal N. # TS = total solids. †† VS = volatile solids. ‡‡ TP = total phosphorus.
ferent from each other and temperatures in period 3 and 4 were also not significantly different from each other. The average chamber head space temperatures (standard deviations) were 4.2 (± 3.7), 9.8 (± 2.7), 13.9 (± 5.0), and 16.9 (± 3.6) °C, for periods 1, 2, 3, and 4, respectively. Although the headspace temperatures had no significant statistical effect on NH3 emitted from the barn floor, NH3 emitted from the barn floor was generally higher (periods 1, 3, and 4) when the high CP diet was fed compared to the low CP diet. We corrected the NH3 emission rates for each period for temperature (Sparks, 2008), using the average values presented above, to discern any dietary effects on NH3 emitted from barn floors and the results are presented in Fig. 4. The average NH3 emitted per day ranged from 1.4 to 3.6 and 2.1 to 4.7 g cow–1 for the low and high CP diets, respectively, during periods 1 to 4.
2177
Fig. 3. Typical time series NH3 emission rates and chamber headspace temperature in a measurement day (12 Mar. 2007, low CP diet).
The average TKN of the manure from the start of the tests were 4160 and 3730 mg kg–1 for the high and low CP diets, respectively, and the corresponding values of TAN were 140 and 100 mg kg–1. There was minimal change in TKN and TAN during the measurement period suggesting low NH3 loss as was measured. Other characteristics of the manure such as TS, VS, and pH did not change during the 6 h test period (Table 5). The TP and COD were measured only at the beginning of the tests and were not expected to change in the 6 h time period that the test was done. The NH3 emissions from flushed solid barn floor measured in this study corresponds to 2.7 (± 2.0) and 2.9 (± 1.8) g N cow–1 d–1 for high and low CP diets, respectively. A comparison of NH3 emissions from dairy barns reported by other studies are shown in Table 6. The NH3 volatilization estimated in this study is generally lower than values reported by other studies. The differences in the measured NH3 volatilized by the studies could be attributed to manure handling, NH3 measurement method, temperature, and manure pH.
Manure Handling, Ammonia Measurement Method Common methods to remove manure from dairy barns include using scrapers, flush water, slots in the floor into a pit (Monteny
and Erisman, 1998). Flushing manure with water can reduce NH3 volatilization by 14 to 70% compared to scraped and slatted floor dairy barns (Voorburg and Kroodsma, 1992; Kroodsma et al., 1993; Ogink and Kroodsma, 1996). Flushing frequency and the quality and amount of water determine the amount of reduction that can be achieved (Voorburg and Kroodsma, 1992; Monteny and Erisman, 1998). Frequent flushing results in low NH3 emissions from barn floors because hardly any degradation then takes place inside the house (Cowell and Apsimon, 1998). In the studies presented in Table 6, manure was scraped from the floors and so if all other factors were the same, higher volatilization should be expected from them compared to the quantity volatilized from a flushed barn like used in this study. Therefore, the lower emissions measured in this study should not be a surprise. The collection and estimation of the fecal and urine output from the cows used in this study may also have been a source of error. Not all the urine was captured with the feces because of drainage due to the slope and grooves of the barn floor. Also the assumption that fecal and urine output occurs uniformly throughout the day may not be accurate. More manure may be produced at times of the day different from when we performed out studies. The TAN of the manures collected at the beginning of each measurement day were
Fig. 4. Ammonia emission rate with standard deviations from the low and high CP diets corrected for temperature. Average chamber headspace temperatures used for periods 1, 2, 3, and 4 were 4.2 (± 3.7), 9.8 (± 2.7), 13.9 (± 5.0), and 16.9 (± 3.6)°C, respectively.
2178
Journal of Environmental Quality • Volume 38 • November–December 2009
Table 6. Comparison of ammonia emissions from housing with comparable studies on lactating Holstein cows.
Diets (CP, g kg–1) Building type
Manure Handling and Management
This study High (178); Low (159) Naturally ventilated, solid floor free stall barn Flushed every 6 h; stored outside the barn
Ammonia source Manure on barn floor Ammonia Flux chamber + measurement method INNOVA photoacoustic monitor Experiment period, d 18 Air temperature, °C 0 to 20 Manure/slurry pH 6.3 to 6.5 Ammonia N 2.9 to 3.1 emissions from housing, g cow–1 d–1 † Winter season only. ‡ NA, not available.
Powell et al., 2008† High (173); Low (157) Mechanically ventilated scraped tiestall barn Scraped twice daily with urine collection
Zhang et al., 2005 NA Naturally ventilated free stall barn
van Duinkerken et al., 2005 High (188); Low (141) Naturally ventilated free stall barn
Scraped solid floor, scraper + drain
Slatted floor; underfloor pit
Tie-stall barn floor Inlet and Exhaust air using Ion mobility spectroscopy 28 –5 to 17.2 NA‡ 5.6 to7.4
Whole barn Whole barn Photoacoustic Monitor SF6 tracer and NOx monitor (INNOVA)
Smits et al., 1995 High (20) and low (14.7) Mechanically ventilated, solid floor free stall barn with urine removal gutter Manure scraped (every hour) and flushed once a day, under-floor manure storage pit Entire barn (Exhaust air) Converted to NO and measured as NOx
5 3.6 to 21 NA 12 to 100
21 10 to 24 7.0 to 7.1 19 to 64
3.3 and 2.6% of TKN for the high and low CP diets, respectively. These low values are indicative of either missing TAN in the urine or lack of hydrolysis of urea in the urine to produce TAN. Chamber methods modify the microclimate inside the chamber relative to the surroundings and thus do not account for changes in temperature and wind speed (Svensson, 1994). Therefore, use of the dynamic flux chamber to measure NH3 emitted from manure may not provide actual quantities of NH3 emitted. However, the use of chamber is a valid procedure to discern differences in emissions from two sources as was done in this study.
Temperature and Manure pH Temperature (0–20°C) and manure pH (6.3–6.5) may have contributed to low NH3 emissions measured in this study. Ammonia volatilization rate is known to increase with temperature and pH. Based on the chemistry of NH3 in aqueous solution, at any temperature and pH of 7.0 or lower, the fraction of TAN available as NH3 that can volatilize is negligible (Arogo et al., 2003b). Thus given the low temperatures (0–20°C) and manure pH (6.3–6.5), very little volatilization should be expected. The low NH3 emissions from manure in this study can also be attributed to the relationship between temperature, urease activity, and NH3 production. For NH3 volatilization to occur, the urea in the urine has to be hydrolyzed with the aid of the enzyme urease produced by microorganisms naturally present in the feces and fouled barn floors. The rate of hydrolysis of urea is temperature dependent. Whitehead and Raistrick (1993) reported that it takes about 10 to 15 d for complete urea hydrolysis to occur at temperatures of 15°C. Muck and Steenhuis (1981) reported a much faster rate of hydrolysis, 6 h at 30 and 24 h at 10°C, while Elzing and Monteny (1997) reported that most NH3 from the urine would be lost within 1 to 5 h. Based on these observations, it is possible that the temperatures under which we conducted our study were not high enough for urea collected with the feces to hydrolyze fast enough to provide NH3 for volatilization. Our observa-
Li et al.: Reducing Dietary N on Ammonia Emissions from Manure
21 0 to 25 NA 50 to 675
tions are similar to observations by Misselbrook et al. (2005) who conducted a lab scale at 15°C to study to measure NH3 emitted from manure on floors from cows fed high and low CP diets. They were surprised to find no significant difference in NH3 emissions despite the fact that there was a great difference between the urinary urea-N concentrations in the manures tested. They attributed limiting urease activity. Powell et al. (2008) also reported no difference in NH3 emitted from manure from cows fed high and low CP diets in the winter. It is not unusual to obtain low NH3 emission from dairy barns at lower temperatures. Powell et al. (2008) reported 64 and 20% lower NH3 emissions from barns in the winter (9°C) compared to spring (18°C) and early fall (22°C), respectively; Smits et al. (1995) reported 46% lower NH3 emissions in the winter (10°C) compared to the summer (24°C); and Kroodsma et al. (1993) reported an 18% difference in NH3 emissions in the winter (12°C) and summer (18°C). The estimated NH3 emissions in this study using the dynamic chamber may underestimate total NH3 emissions from barn floor, but provided a good comparison on the effect of dietary treatment on NH3 emissions.
Predicting Ammonia Emissions from Manure on Solid Barn Floors A multiple regression equation (Eq. [6]) was developed using the data of NH3 emission rates in 5-min interval, manure pH, TKN concentration, air temperature, time, pen, dietary CP and period. ER = –4.64 – 0.39 × pH + 1.7 × 10⁻³ × TKN + 3.5 × 10⁻² × T + 6.8 × 10⁻⁴ × t – 1.8 × 10⁻⁶ t2
[6]
where: ER is the NH3 emission rate (mg m–2 min–1) TKN is total Kjeldahl N (mg kg–1 fresh manure)
2179
T is air temperature (°C)
References
t is time after starting measurement (min). For Eq. [6], R2 = 0.80, P < 0.01 (n = 1152). The standard errors of the intercept, and coefficients for pH, TKN concentration, T, t, and t2 were 0.19, 3.4 × 10⁻², 5.7 × 10⁻⁵, 1.7 × 10⁻³, 2.7 × 10⁻⁴, and 6.6 × 10⁻⁷, respectively. The variation associated with pen, dietary CP, and periods are represented in the intercept. Each variable in Eq. [5] was highly significant (P < 0.05). Dietary CP was significant for NH3 emission rates (P < 0.01), but the slope was negative indicating that the low CP diet caused higher NH3 emission rates than the high CP diet, which was counter to our hypothesis. This is likely a reflection of the numerical (but nonsignificant) increases in TAN concentration and pH of manure from cows fed the low CP diets (Table 5). We used manure TKN in Eq. [5] instead of TAN, because TKN is usually predictable by feed N and milk N, both of which are commonly measured on dairy farms, although using TAN will produce better correlation (R2 = 0.89). As shown in Table 7, the NH3 emission rates are more sensitive to manure pH and TKN than to air temperature and time.
Aneja, V.P., J. Blunden, K. James, W.H. Schlesinger, R. Knighton, W. Gilliam, G. Jennings, D. Niyogi, and S. Cole. 2008. Ammonia assessment from agriculture: US status and needs. J. Environ. Qual. 37:515–520. AOAC. 1997. Official methods of analysis. AOAC Intl., Gaithersburg, MD. APHA. 1998. Standard methods for the examination of water and wastewater. 20th ed. American Public Health Assoc., Washington, DC. Arogo, J., P.W. Westerman, and A.J. Heber. 2003a. A review of ammonia emissions from swine confined swine feeding operations. Trans. ASAE 46:805–817. Arogo, J., P.W. Westerman, and Z.S. Liang. 2003b. Comparing ammonium ion dissociation constant in swine anaerobic lagoon liquid and deionized water. Trans. ASAE 46:1415–1419. Arogo, J., P.W. Westerman, A.J. Heber, W.P. Robarge, and J.J. Classen. 2006. Ammonia emissions from animal feeding operations. In J.M. Rice et al. (ed.) Animal agriculture and the environment: National center for manure and animal waste management white papers. Am. Soc. of Agric. And Biol. Eng. Publ. no. 913C0306. ASABE, St. Joseph, MI. ASABE. 2005. ASABE Standard D384.2. Manure production and charactersitics. American Soc. of Agric. and Biological Eng., St. Joseph, MI. Broderick, G.A. 2003. Effects of varuying dietary protein and energy levels on the production of lactating dairy cows. J. Dairy Sci. 86:1370–1381. Burgos, S.A., N. Marcillac, J.G. Fadel, F.M. Mitloehner, and E.J. DePeters. 2006. Prediction of ammonia emission from dairy cattle manure based on milk urea N: The relationship of milk urea nitrogen to ammonia emission. J. Anim. Sci. 84(Suppl. 1):355–356. Cowell, D.A., and H.M. Apsimon. 1998. Cost-effective strategies for the abatement of ammonia emissions from European agriculture. Atmos. Environ. 32:573–580. Cyriac, J., A.G. Rius, M.L. McGilliard, R.E. Pearson, B.J. Bequette, and M.D. Hanigan. 2008. Lactation performance of mid-lactation dairy cows fed ruminally degradable protein at concentrations lower than National Research Council recommendations. J. Dairy Sci. 91:4704–4713. de Boer, I.J.M., M.C.J. Smits, H. Mollenhorst, G. van Duinkerken, and G.J. Monteny. 2002. Prediction of ammonia emission from dairy barns using feed characteristics part I: Relation between feed characteristics and urinary urea concentration. J. Dairy Sci. 85:3382–3388. DeBusk, J.A., J.A. Ogejo, K.F. Knowlton, and N.G. Love. 2008. Chemical phosphorus removal for separated flushed dairy manure. Appl. Eng. Agric. 24:499–506. Eklund, B. 1992. Practical guidance for flux chamber measurements of fugitive volatile organic emission rates. J. Air Waste Manage. 42:1583–1591. Elzing, A., and G.J. Monteny. 1997. Modeling and experimental determination of ammonia emission rates from a scale model dairy-cow house. Trans. ASAE 40:721–726. Frank, B., and C. Swensson. 2002. Relationship between content of crude protein in rations for dairy cows and milk yield, concentration of urea in milk and ammonia emissions. J. Dairy Sci. 85:1829–1838. Gressley, T.F., and L.E. Armentano. 2007. Effects of low rumen-degradable protein or abomasal fructan infusion on diet digestibility and urinary nitrogen excretion in lactating dairy cows. J. Dairy Sci. 90:1340–1353. James, T., D. Meyer, E. Esparza, E.J. Depeters, and H. Perez-Monti. 1999. Effects of dietary nitrogen manipulation on ammonia volatilization from manure from Holstein heifers. J. Dairy Sci. 82:2430–2439. Johnson, R.G., and A.J. Young. 2003. The association between milk urea nitrogen and DHI production variables in western commercial dairy herds. J. Dairy Sci. 86:3008–3015. Kalscheur, K.F., R.L. Baldwin, B.P. Glenn, and R.A. Kohn. 2006. Milk
Conclusions Two diets with different N contents were fed to four groups of mid-lactation cows, with the hypothesis that reducing dietary N (by reducing CP from 178 to 159 g kg–1 diet DM) reduces excreted total N and thus NH3 emitted from barn floors. Dietary CP affected the feed N intake (8.7 and 7.1 kg pen–1 d–1 for high and low CP, respectively), but did not affect milk yield. The results also showed a reduced total N excretion but no significant difference in the NH3 emissions from the barn floor. The NH3 emissions from flushed solid barn floor measured in this study corresponds to 2.7 (± 2.0) and 2.9 (± 1.8) g N cow–1 d–1 for high and low CP diets, respectively.
Acknowledgments The authors thank Shane Brannock and the dairy farm crew at Virginia Tech for help with animal care. We appreciate the help of Chris Umberger and Ranga Appuhamy with sample collection and analysis, Jessica Ligon and Molly Reed for help with feeding, feed sampling, and excretion recording. This material is based on work supported by the Cooperative State Research, Education, and Extension Service, U.S. Department of Agriculture, under Agreement no. 2006-35112-16635. Any opinions, findings, conclusions, or recommendations expressed in this publication are those of the author(s) and do not necessarily reflect the view of the U.S. Department of Agriculture. Table 7. Sensitivity analysis of model† to estimate ammonia emissions‡. pH 6.4 0.4 5.8 to 7.4 –855
Mean value of each variable Standard deviation of each variable Observed range of each variable Sensitivity, %§ † Model: Eq. [5]. ‡ Mean ammonia emission rates: 0.47 mg m–2 min–1. § Calculation of sensitivity: Eq. [4].
2180
TKN, mg kg–1 fresh manure 3977 314 3250 to 4508 2397
Air temperature, °C 11.2 6.3 –2.0 to 21.6 135
Time after starting measurement, min 180 4.3 0 to 360 1.2
Journal of Environmental Quality • Volume 38 • November–December 2009
production of dairy cows fed differing concentrations of rumen-degraded protein. J. Dairy Sci. 89:249–259. Kebreab, E., J. France, J.A.N. Mills, R. Allison, and J. Dijkstra. 2002. A dynamic model of N metabolism in the lactating dairy cow and an assessment of impact of N excretion on the environment. J. Anim. Sci. 80:248–259. Kohn, R.A., K.F. Kalscheur, and E. Russek-Cohen. 2002. Evaluation of models to estimate urinary nitrogen and expected milk urea nitrogen. J. Dairy Sci. 85:227–233. Krober, T.F., D.R. Kulling, H. Menzi, F. Sutter, and M. Kreuzer. 2000. Quantitative effects of feed protein reduction and methionine on nitrogen use by cows and nitrogen emission from slurry. J. Dairy Sci. 83:2941–2951. Kroodsma, W., J.W.H. Veld, and R. Scholtens. 1993. Ammonia emission and reduction from cubicle houses by flushing. Livest. Prod. Sci. 35:293–302. Licitra, G., T.M. Hernandez, and P.J.V. Soest. 1996. Standardization of procedures for nitrogen fractionation of ruminant feeds. Anim. Feed Sci. Technol. 57:347–358. Misselbrook, T.H., J.M. Powell, G.A. Broderick, and J.H. Grabber. 2005. Dietary manipulation in dairy cattle: Laboratory experiments to assess the influence on ammonia emissions. J. Dairy Sci. 88:1765–1777. Monteny, G.J., and J.W. Erisman. 1998. Ammonia emission from dairy cow buildings: A review of measurement techniques, influencing factors, and possibilities for reduction. Neth. J. Agric. Sci. 46:225–247. Monteny, G.J., M.C.J. Smits, G. van Duinkerken, H. Mollenhorst, and I.J.M. de Boer. 2002. Prediction of ammonia emission from dairy barns using feed characteristics. Part II: Relation between urinary urea concentration and ammonia emission. J. Dairy Sci. 85:3389–3394. Muck, R.E. 1982. Urease activity in bovine feces. J. Dairy Sci. 65:2157–2163. Muck, R.E., and T.S. Steenhuis. 1981. Nitrogen losses in free stall dairy barns. p. 406–409. In Livestock waste: A renewable resource. ASAE, St. Joseph, MI. NRC. 2001. Nutrient requirements of dairy cattle. 7th ed. Natl. Res. Council, Washington, DC. Ogink, N.W.M., and W. Kroodsma. 1996. Reduction of ammonia emission from cow cubicle house by flushing with water and formalin solution. J. Agric. Eng. Res. 63:197–204. Paul, J.W., N.E. Dinn, T. Kannangara, and L.J. Fisher. 1998. Protein content in dairy cattle diets affects ammonia losses and fertilizer nitrogen value. J. Environ. Qual. 27:528–534. Powell, J.M., G.A. Broderick, and T.H. Misselbrook. 2008. Seasonal diet affects ammonia emissions from tie-stall dairy barns. J. Dairy Sci. 91:857–869. Reynal, S.M., and G.A. Broderick. 2005. Effect of dietary level of rumendegraded protein on production and nitrogen metabolism in lactating dairy cows. J. Dairy Sci. 88:4045–4064.
Li et al.: Reducing Dietary N on Ammonia Emissions from Manure
Rumburg, B., G.H. Mount, J. Filipy, B. Lamb, H. Westberg, D. Yonge, R. Kincaid, and K. Johnson. 2008. Measurement and modeling of atmospheric flux of ammonia from dairy milking cow housing. Atmos. Environ. 42:3364–3379. SAS Institute. 2004. SAS user’s guide: Statistics. Version 9.1.2 ed. SAS Inst., Cary, NC. Smits, M.C.J., G.J. Monteny, and G. van Duinkerken. 2003. Effect of nutrition and management factors on ammonia emission from dairy cow herds: Models and field observations. Livest. Prod. Sci. 84:113–123. Smits, M.C., H. Valk, A. Elzing, and A. Keen. 1995. Effect of protein nutrition on ammonia emissions from a cubicle house for dairy cattle. Livest. Prod. Sci. 44:147–156. Sparks, J.A. 2008. The effects of manure handling and dietary protein on ammonia fluxes from a flush dairy. p. 107. In Civil and environmental engineering. Vol. MS. M.S. thesis. Virginia Tech, Blacksburg, VA. Svensson, L. 1994. Ammonia volatilization following the application of livestock manure to arable land. J. Agric. Eng. Res. 58:241–260. Tamminga, S. 1992. Nutrition management of dairy cows as a contribution to pollution control. J. Dairy Sci. 75:345–357. USEPA. 2004. National emissions inventory—Ammonia emissions from animal husbandry operations. Draft report. Available at http://www. epa.gov/ttn/chief/ap42/ch09/related/nh3inventorydraft_jan2004.pdf (verified 11 Aug. 2009). USEPA, Washington, DC. van Duinkerken, G., G. Andre, M.C.J. Smits, G.J. Monteny, and L.B.J. Sebek. 2005. Effect of rumen-degradable protein balance and forage type on bulk milk urea concentration and emission of ammonia from dairy cow houses. J. Dairy Sci. 88:1099–1112. van Soest, P.J., J.B. Robertson, and B.A. Lewis. 1991. Methods for dietary fiber, neutral detergent fiber, and nonstarch polysaccharides in relation to animal nutrition. J. Dairy Sci. 74:3583–3597. Voorburg, J.H., and W. Kroodsma. 1992. Volatile emissions of housing systems for cattle. Livest. Prod. Sci. 31:57–70. Wattiaux, M.A., and K.L. Karg. 2004. Protein level for alfalfa and corn silagebased diets: II. Nitrogen balance and manure characteristics. J. Dairy Sci. 87:3492–3502. Whitehead, D.C., and N. Raistrick. 1993. Nitrogen in the excreta of dairy cattle—Changes during short-term storage. J. Agric. Sci. (Cambridge) 121:73–81. Zerihun, D., J. Feyen, and J.M. Reddy. 1996. Sensitivity analysis of furrowirrigation performance parameters. J. Irrig. Drain. Eng. ASCE 122:49–57. Zhang, G., J.S. Strom, B. Li, H.B. Rom, S. Morsing, P. Dahl, and C. Wang. 2005. Emission of ammonia and other contaminant gases from naturally ventilated dairy cattle buildings. Biosyst. Eng. 92:322–364.
2181