Employee Representation in Japanese Family and Non-Family SMEs Tsukasa Matsuura, Tomohiko Noda
Abstract This paper analyzes differences in the effects of employee representations between family firms and non-family firms. First, managers from non-family firms have a more favorable response towards unions as organizations than managers from family firms. Managers from family firms tend to regard unions as harmful to their management, because unions may bring in outsiders, to the detriment of the management. Second, voice-oriented employee associations tend to exist more in non-family firms than in family ones. Third, these associations have a voice effect suppressing turnover rates in non-family firms, though not in family ones. Key Word: Family Firm, Employee Representation, Industrial Rotations, Exit-Voice Model JEL Classification Code: J53, J63, L20
Associate Professor, Chuo University
[email protected] Professor, Osaka Prefectural University
[email protected] 1
1. Introduction Most of the existing literature on industrial relations tend to target large firms rather than small ones in spite of the significance to shed light on the latter in Japan as well as in Western countries. As a result, industrial relations in Japanese small and medium-sized enterprises (SMEs) has been invisible. This is by no means a small problem. In Japan, 41.2 millions of employees are working in firms the number of employees of which are less than 100. It accounts for 71.8% of the workforce in Japan1. We will not be able to have a full understanding of industrial relations without covering SMEs. We specifically focus on employee representation 2 to study the industrial relations of Japanese SMEs. For many decades, employee representation has expressed worker opinions through unionism and collective bargaining. However, unions have become less powerful. During the fourth quarter of the twentieth century, the emergence of global economic competition, de-regulation, and technological change, resulted in a decrease in the unionization rate. This decrease led to a weakening in the bargaining power of unions. At present, since most employees no longer belong to unions, they are represented by a variety of other non-union institutions (Bryson, 2004; Bryson et al., 2013). Several studies argue that union membership rates and the levels of collective bargaining coverage are lower in SMEs than in larger firms in many European countries (Bouquin et al.,2007; Kirton and Read, 2007; Forth et al.,2006; Holten and Crouch, 2014).3 Similarly, there is a significant difference in the unionization rate between
1
Economic Census (2014). We define employee representation as the organizations, or practices, that express the collective voice of employees. Labor unions and employee associations are examples of employee representations. 3 Forth et al.(2006) show that only 3 per cent of all workplaces in SMEs recognized unions, compared with 31 per cent of workplaces in large firms. 2
2
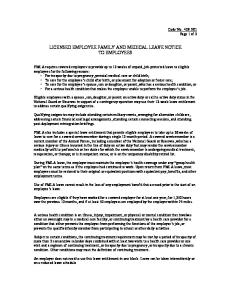
SMEs and large firms in Japan, as Figure 1 shows. In Japanese SMEs, unions are uncommon; if managers communicate with employees through unions, it is by formal negotiation. Unions are protected by law, giving them greater power, so managers tend to prefer to negotiate with employees informally. In this study, we focus on employee associations. They have more flexibility than unions. By using this form of organization, the employee and the manager are able to communicate in confidence in an informal setting. This has benefits and disadvantages. Due to their informal nature, they are not safeguarded by law. In Japan, employee associations are more prevalent than enterprise unions or joint consultations among SMEs (Morishima and Tsuru 2000). These aspects of employee associations, however, have been largely ignored in the literature. To further investigate the function of employee representation in SMEs, we will focus on the difference between family and non-family SMEs. Table 1 shows that the smaller the firm size, the higher the percentage owned by family members. Autocratic family owners are averse to criticism voiced through employee representations. It is noteworthy that there is another type of manager in Japanese SMEs. They are managers of subsidiary firms who are former union members and who were dispatched from unionized large parent firms. Such managers not only understand the importance of a collective voice, but also have sympathy towards their workers. Hence, in Japan, there are two types of manager: (1) family owners (autocratic in nature), and (2) managers dispatched from parent firms. The two types have different views about voice institutions such as labor unions and employee associations, and this leads to a difference in the effects of employee associations. More precisely, family owners dislike both unions and employee associations, while managers who are dispatched 3
from parent firms do not necessarily dislike unions or employee associations. This paper analyzes the different effects of employee representations between family firms and non-family firms. To concretize, we examine three hypotheses. First, the managers’ attitude towards a collective voice, such as those in unions, is different between family firms and non-family firms. Second, voice-oriented employee associations are less likely to be formed in family firms than in non-family ones. Third, even if employee associations in family firms exist, the effects of employee associations on turnover are weaker in non-family firms. To analyze the second hypothesis, we use the voice-exit model presented by Freeman and Medoff (1984), focusing on the difference in the voice effects between family firms and non-family firms.
2. Background In this section, we will discuss the owner’s attitude towards a collective voice in family firms of SMEs, such as unions and employee associations, based on previous studies. The previous studies of industrial relations in SMEs tend to polarize into a “small is beautiful” scenario where small firms facilitate close and harmonious working relationships or “bleak house” perspective that small firms are dictatorially run with employees suffering poor working conditions 4 (Wilkinson, 1999). However, these polarized views are too simplistic. Ram (1991) insists that workplace relations in SMEs may be “complex, informal, and contradictory” rather than simply either harmonious or autocratic. In our research, we will focus on the differences of ownerships to clarify the complex, informal, and contradictory industrial relations of SMEs. Generally, family owners tend to keep out labor unions by prohibiting them from The former is presented by Bolton Committee Report (1971) and the latter is represented by Rainnie (1985). 4
4
organizing – this then creates a hostile relationship between the firms and its workers. Mueller and Philippon (2007) show that family managers are more likely to treat labor unions as outsiders; they try to prevent the formation of unions by developing good labor relations. Because family firms can enjoy long relationships with employees, employees may find it easier to establish a personal bond with, and develop loyalty to, the family. The employees feel a sense of protection and support because of this relationship; joining unions is less appealing to the employees. Family firms account for the majority of SMEs, whose family owners are in an adversarial relationship with unions, which are viewed as a threat to the harmonious relationship between the owners and their employees. This familial environment within the firm is an objective that managers and lower-level employees have worked together to achieve, but which may be disrupted with the presence of labor unions.5 When managers are best placed to make decisions, they tend to resist union involvement, which may dilute management control. Typically, they are also unwilling to receive criticism (Ram et al., 2001; Ryan, 2005). Ram et al. (2001) show that owners in family firms may attempt to eliminate this form of voice, taking the view that employee representations undermine and disrupt the family atmosphere. Ryan (2005) explain the reason of the apparent aversion to trade unions among managers in SMEs is unwillingness among managers to share control. Van Gyes (2006) and Wilkinson (1999) show that in SMEs, the adversarial attitude of managers who resist the collective 5
There are two reasons why family-owned firms could be successful in handling hostile labor relations. First, family owners may be less compromising than hired managers. Due to large ownership stakes, for family owners the (psychological and other) costs of confronting hostile labor are more endurable than for salaried managers who tend to prefer the “quiet life” (Bertrand and Mullainathan 2003). Second, due to their longer time horizon, family firms have a comparative advantage in maintaining implicit labor contracts, and thus they are especially successful at winning workers’ loyalty and cooperation. Salaried managers may lack the credibility necessary to implement such implicit contracts if the firm’s shares are widely held, due to the possibility of a hostile takeover (Shleifer and Summers 1988).
5
voice of unions leads to a lower union membership rate, making it difficult for unions to organize. Family firms are dominated either by a legacy of a founder, or by long established owner-management that operates through a mixture of paternalism and autocracy. Family managers prefer informal negotiations over formal policies or practices to suppress employee resistance, or to prevent workplace dissonance caused by unions or other collective forms of representation (Atkinson and Storey, 1994; Moule, 1998). Marlow (2003) shows that 93 percent of managers favored open door policies and had a policy of ‘informal discussion and resolution of workplace problems.’ With the assurance that the manager will act in favor of each employee’s ‘best’ interests, employees may be acclimated to a lack of formal, collective voice instead of finding personal solutions to this problem (Ryan, 2005).
3. Industrial relations in Japanese Firms and working hypotheses 3.1 Industrial relations in Japanese Firms The previous section discussed that, on the basis of former studies, family firm owners tend to have a more hostile attitude towards labor unions, because these unions ruin the harmonious atmospheres in their firms. This relation between a family firm owner and unions is prominent in SMEs. The owners whose companies do not have unions believed that unions would hinder good employee relations, because they create an unnecessary division between management and labor (Marlow, 2002). However, caution should be exercised in applying these findings immediately to any Japanese firm, since labor unions in Japan are characterized as enterprise unions. This implies that unions are not necessarily considered and treated as outsiders. 6
There are three reasons behind the harmonious labor-management relationship in Japanese firms. First, top executives were employees who were promoted, so they have sympathy with an employee association. The manager selection mechanism in Japan encourages a management style that emphasizes the interests of employees. Being originally internal employees promoted under the practice of selecting management positions by ranking from a hierarchy of regular employees, many Japanese managers share the experience of being part of an employee association. In the absence of corporate control through the active market, the practice of selecting top management becomes institutionalized at the enterprise level (Aoki, et al., 1997). Many managers emphasize the employees’ interests and this brings stability to labor-management relationships. Second, enterprise-based unionism uniquely creates goal-alignment between labor and management. Japanese unions are organized along enterprise lines, rather than within craft or industrial lines that typify American unions. Therefore, managers and employees typically share more interests in the enterprise union system than in industrial or craft unions in the U.S. Furthermore, most Japanese unions are enterprise unions which consist of regular workers who are mostly union members. They are likely to have a common interest in improving their own firm’s competitiveness to ensure growth and stable employment. For the reasons mentioned above, unlike characteristic Euro-American companies, Japanese managers are not hostile towards unions. Third, unions and managers can maintain a cooperative relationship because some managers have experienced being union leaders. In Japan, many department heads, board members, and even some presidents, have not only been union members in the past but also played important and active roles in these organizations (Jacoby, 2005). 7
Some individuals have even progressed from the union to a position on the board or audit committee. Fujimura (2000) shows that 41.3 percent of all directors promoted internally had once been officers at some level of the enterprise union. Japanese managers and directors who are former union leaders help encourage cooperative relationships between management and employees.
3.2 Working hypotheses As aforementioned, managers of family firms are generally hostile towards the unions because the latter may be detrimental to the firms’ harmonious environment. However, unions are not considered as outsiders in many Japanese firms. If a firm is relatively less averse towards unions, then employee associations are less likely to be treated as outsiders. For this reason, when we analyze the relationship between management and employee associations, we should examine if managers in the family firms exhibit hostile behavior towards employee associations who initiate open discussion of management concerns such as wage policy, and similar issues. We describe three hypotheses which account for differences in manager-employee relations between family firms and non-family ones in Japanese SMEs. First, we will examine the hypothesis that family firm managers are hostile towards a collective voice. We will examine the hypothesis that managers in family firms are hostile toward unions even in Japanese SMEs. In other words, managers of SMEs are generally known to be averse towards unions as previous studies show. However, this may differ for subsidiary firms whose presidents were originally dispatched from large parent firms that had cooperative labor-management relationships with the unions. Many large Japanese firms form 8
enterprise groups involving networks of associated or subsidiary firms and parent firms. Parent firms monitor, discipline, and control the management of their subsidiary firms by dispatching board members and replacing presidents when corporate performance of subsidiary firms deteriorates (Aoki 1984). Thus, the managers of subsidiary non-unionized firms were former union members of the unionized parent firms, and are therefore more likely to adopt a cooperative and employee oriented (pro-union) management. They are sympathetic towards unions and consider Japanese enterprise unions necessary in contributing to productivity enhancement (Morikawa 2010; Tachibanaki and Noda 2000). There is another type of manager in non-unionized subsidiary firms. Managers who are promoted from the hierarchy of regular employees are likely to have an empathy with these staff. In addition, some other board members may have been dispatched from parent firms. Therefore, these managers from the parent firms introduce corporate cultures to the subsidiary SMEs. The managers of these firms, therefore, acknowledge the significance of the collective voice. Accordingly, a hypothesis on management attitudes toward unions based on the types of firms is derived: Hypothesis 1: Managers show a more favorable attitude towards unions in non-family firms than in family firms. Second, we will focus on voice-oriented employee associations. Koike (1977) (1981) pioneered research relating to Japanese employee associations. Koike (1981) found that there were employee associations called “clubs” or “employee reunions” in three of seven the non-unionized SMEs. Here, they discuss with their managers concerns involving wages, working conditions, production plans, and so on. According to Koike (1981), these employee organizations should be called “de facto enterprise unions” for 9
the following reasons. First, employee associations charge fees to those who choose to participate. Second, employee associations have a voice in the decision-making with respect to their working conditions. According to Intrafirm Communication Research Group (1991), there are two types of employee association: Voice-oriented employee associations and Employee associations for socializing. Voice-oriented employee associations often discuss working conditions and industrial planning with management; managers have a high regard for their functions of aggregating and communicating employee views. As described earlier, many autocratic owners of smaller businesses resist the use of formal policies that pose potential damage to the team environment (Marlow, 2002). Forth et al.(2005) show that in SMEs union membership was also less common in family firms than non-family ones, though they don’t focus on employee associations. We will examine the following hypothesis. Even if employee associations are different from unions, they have a collective voice, and their activities include discussing working conditions with managers. So, in contrast to managers of non-family firms, managers of family firms are reluctant to enable the formation of voice-oriented employee associations, if the associations have activities to discuss working conditions with managers. Hypothesis 2: Managers tend to avoid voice-oriented employee associations in small and medium-sized family firms. Third, we examine the difference in the effects of employee associations between the two types of firms by applying an exit-voice model in which unions serve to reduce employee turnover rate, as presented by Freeman and Medoff (1984). According to the theory, employees who are dissatisfied with working conditions or the management can 10
express displeasure indirectly to the management through the union, which has a functioning voice, and, as a result, the employee turnover rate is restrained. The effects of employee associations on employee turnover may vary between family and non-family firms, if employee associations possess functions like those of enterprise unions. We expect that the effect of voice-oriented employee associations on turnover differs between family firms and non-family firms. Managers in non-family firms are likely to show a better understanding of the importance of the positive effects of union voice on productivity. There are several studies showing the positive effects of unions among large Japanese firms. Bryson et al (2006) show that management responsiveness to an employee’s voice is a critical factor to succeed in improving labor productivity. In two-way communication, both sides learn new arrangements that can be used to govern the workplace and guide efficient production (Verma 2005). Such questioning establishes dialogic interactions, otherwise absent from managerial deliberations, which is helpful in finding solutions to problems. Managers in non-family firms understand that it is important for them to listen to their employees’ voices to enhance their motivation. On the other hand, managers in family firms are less likely to listen to concerns voiced through employee associations. This is because family firm owners strongly believe that they are in the best place to make decisions and therefore prefer to deal with employees personally in the form of a “negotiated order.” This leads to a low level of responsiveness to the employees’ collective voice. We can show the hypothesis in the following way: Hypothesis 3: The effect of voice-oriented employee associations on turnover is larger in non-family firms than in family firms. 11
4. Data and Methods 4.1 Data Description In this section, we explain data, methods of analysis, definitions of variables, and descriptive statistics. The data we use is from the “Questionnaire survey which concerns communication about working conditions between top executives and employees of Japanese SMEs.” The data were collected by The Japan Institute for Labor Policy and Training (JILPT) on July, 2006. They focused on 12,000 firms whose employees are less than 1,000, from 19 industries, excluding agriculture, forestry, fisheries, mining, compound services, government, and industries which they were unable to classify6. They selected 12,000 firms from “the corporate databases by Tokyo Shoko Research, Ltd. (TSR)”. The method of the survey is postal survey, wherein they distributed and collected the questionnaire by postal mail. The sample period is July 12 to September 11, 2006. A total of 2,440 firms responded, a rate of 20.3%. In this paper, we will use all the samples collected, except for the non-responders.
4.2. Definition of variables We first defined family firms from answers to the question “how is your manager promoted?”7: The possible answers were: “1. Founder, 2. Succeeding to parents, 3. Succeeding to brothers or relatives, 4. Promoted from employee, 5. Hired as a President, 6. Dispatched from parent firm, 7. Others.” Thereafter, we categorized responders who This classification is consistent with Japan Standard Industry Classification (JSIC). Even if we define a family firm as a response to the question of “how many family members or relatives of the president are on the board excluding the president?”, the result of our estimation is the same. 6 7
12
chose from 1 to 3 as family firms, and ones who chose 4 or 6 as non-family firms. When the response is 5 or 7 and more than half of the directors are family members of the representative director, we classify it as a family firm. Next, we define variables for the voice-oriented employee association. We used a questionnaire on what activities the employee association is involved in, namely: (1) discussion with managers about labor conditions such as wages, labor hours, leisure and fringe benefits; (2) activities of mutual aid such as congratulatory or condolence money and loans; (3) tasks to handle complainants; (4) activities to discuss with managers about production planning and management policy; and (5) the work of employee social clubs. If the organization has activities involving (1) or (4), we define these organizations as voice- oriented employee associations. Other variables are shown in Table 2.
4.3. Descriptive statistics Table 3 summarizes descriptive statistics. Starting with the dependent variables of the three hypotheses, the annual average voluntary employee turnover is approximately 6.9% in family firms, and 5.1% in non-family firms. The rate of voice- oriented employee associations is 10.9% in family firms, and 19.0% in non-family firms. Moreover, the results from Q16(a) to Q16(f) show that managers in family firms consider unions to be more harmful to family firms than to non-family firms. All the responses are statistically significant. For example, 71.3% of family firms do not think unions are necessary to the firm, while for non-family firms, it is 47.6%. In respect of employee associations, 8.9% of family firms have activities that involve discussions with managers regarding labor conditions, while 17.4% of non-family firms 13
have such activities. However, there are no significant differences in the activities to discuss production planning or management policy, between family firms and non-family ones.
5. Econometric specifications and Estimations 5. 1.
Analysis of the Attitude of Managers toward Unions
In this section, we estimate probit models of the managers’ attitudes toward unions to test hypothesis 1. We used six questions on their attitude towards unions as dependent variables. We asked: “Can you rate the following statements in terms of how closely they reflect your firm’s manager’s opinion?” These relate to the managers’ attitudes towards unions: (a) Unions are necessary for your company, (b) Unions are organizations that make unfair demands, (c) If there is a union in your company, outsiders will tend to interrupt management, (d) Unions are useful for managers to grasp the employee’s intentions and needs, (e) Unions are useful in conveying a manager’s intentions, (f) Even if there are no unions, managers can grasp the employee’s needs. The respondents could choose one of the following for each statement: 1. Agree, 2. Relatively Agree, 3. Relatively Disagree, and 4. Disagree. We make binary variables in this way. For example, in the case of (a), we categorized respondents who chose from 1 or 2 as one, and those who chose 3 or 4 as zero. However, in the case of (b), we categorized respondents who chose 1 or 2 as zero, and those who chose 3 or 4 as one, indicating a negative attitude towards unions. We used probit models to estimate the manager’s attitude towards unions. More specifically, we will test the hypothesis that managers in family firms have a worse impression of unions than non-family ones. This is because many managers from 14
non-family firms were promoted when they were still employees in the firm. So, they may possibly consider the needs of their former colleagues. In contrast, most managers in family firms did not work as past employees in the firm. In the case of those who did work as employees in the family firms, they were already treated as future managers, so they were assessed differently from other employees. Thus, they do not share the same needs and potential grievances as other employees do. For this reason, those managers in family firms tend to have a more negative impression of unions than those in non-family ones. To test hypothesis 1, we estimate (5.1): Pr (Neg impression to UNION=1) = α+β*family firm +xγ+u (5.1) Table 4 shows the maximum likelihood estimates of (5.1). The coefficients of the family firm dummy are significant at the 1% level. Column 1 shows that managers in family firms do not think unions are necessary to the company. Column 2 shows that they consider unions as harmful to the firm, because unions make unfair demands to the manager. Column 3 shows they think that the existence of a union will disrupt management, with unions being considered an outside organization. Columns 4 and 5 shows that they do not think that unions are useful in capturing the needs of the employees, nor do the unions convey their intentions. Column 6 shows that they can grasp the needs of the employees, even if there is no union in their firm. All the results show that managers in family firms do not think unions are useful in their firms, thus regarding unions as harmful organizations that interrupt their management.
5. 2.
Voice-oriented employee associations in family and non-family firms
Next, we estimate probit models to examine hypothesis 2. As shown in section 4.1 and table 2, we use those five variables as dependent variables. We estimate probit 15
models of the following (5.2): Pr (Firms have activities=1) = α+β*family firm dum+xγ+u (5.2) We test the hypothesis that managers in family firms do not allow employees to form organizational structures that may impede management progress. So, we assume that the employee associations which have activities (1) and (4) exist less in family firms than in non-family ones. We also define employee associations which have activities (1) and (4) as “voice-oriented employee associations”. Table 5 shows the estimates of equation (5.1). The coefficient of the dummy variable for family firms is negatively significant in columns (1) and (3). The results in column (1) show that the number of employee associations which discuss working conditions with managers is less in family firms than in non-family firms. The results verify hypothesis 2. Moreover, the coefficient in (3) is negatively significant. Although we do not include activities (3) as a definition of voice oriented employee association, managers in family firms may worry that when such associations resolve complaints, they may make demands hindering managers’ policies. In contrast, the coefficient of the dummy variable of the family firm in column (4) is not significant.
5. 3.
The effect of employee association on turnover
Next, we estimate (5.3) to test hypothesis 3: Turnover = α+β*Voice Orient Employee association +xγ+u (5.3) We assume that the coefficient of β is negative, because those who have complaints about the firm raise their voice out-with employee associations. Their voices lead to lower turnover rates by resolving their complaints. We confirmed that the voice-oriented employees’ associations also have a voice effect, as Freeman and Medoff (1984) have 16
discussed. Moreover, we divided the sample into family firms and non-family firms and focused on the difference of the coefficient β between these firms. We tested the hypothesis that the effect of voice-oriented employee associations will be weaker in family firms, because managers in family firms do not listen to their voice. Table 6 shows the estimates of (5.3). Column (1) is the result of the full sample. The coefficient β is negatively significant. This shows voice-oriented employee associations lead to lower turnover rates. Next, we divided the whole sample into family firms and non-family ones, to test the different effect of employees on turnover between these firms. Columns (2) and (3) detail the results. Although the coefficient β in column (2) is not significant, in column (3) it is negatively significant at the 10% level. For a robustness check, we estimated the voice-oriented employee association dummy and year of voice-oriented employee association separately. These results are shown in columns (4) - (9) of Table 6. They show that in general, voice-oriented employee associations are effective in lowering the turnover rate, but this only applies to non-family firms. Perhaps the effect is not found in family firms because managers from family firms “listen to the voice” of employee representations less than non-family firms, as many of those who manage in non-family firms are internally promoted, and were colleagues of the employees previously. From here, we can test hypothesis 3. However, our estimations may be insufficient, because we did not consider the size of the firms. In general, there is an inverse relation between company size and proportion of family firms. The smaller the size of the company, the greater the ratio of family firms, as table 1 shows. Perhaps we may mistakenly identify the effect of the company’s size as a family firm effect, though we control the company size by controlling the number of employees. To deal with this problem, we divided the sample by the number 17
of employees. Columns (1) and (2) of table 7 show the results of firms which have 100 or more employees, and columns (3) and (4) for firms which have 1-99 employees. Although we can verify our hypothesis in the firms which have 100 or more employees, the coefficient β is not significant in the firms which have 1-99 employees. The estimations support hypothesis 3 for relatively larger SMEs.
5. 4.
Oaxaca Decomposition
Finally, we use Oaxaca-Blinder decomposition method to explain the difference in the means of a turnover rate between family firms and non-family ones by decomposing the gap into differences in the mean values of the independent variable within the groups, and group differences in the effects of the independent variable. Table 8 shows the results of Oaxaca-Blinder decomposition. The average of turnover rate in family firm is 5.05% and that in non-family firm is 6.86%. The difference is 1.81% and statistically significant. We decompose this difference into the explained effects and the unexplained effects. The explained effect is 33.6% and the unexplained effect is 66.4%. These are also statistically significant. In regard to other variables, the largest part of the explained effects is the difference by firm size, which accounts for 38.3% of the difference of the turnover rate above mentioned. As for voice-oriented employee associations, which we pay much attention to, the dummy variable for this accounts for 4.68% of the overall differences of the turnover rate. It reveals that the difference of the turnover rate is partly attributable to the difference in the density of employee associations between family firms and non-family firms. However, the unexplained effect of voice-oriented employee associations is not significant. 18
The explained effect of the attitude toward lifetime employment accounts for the difference of turnover between family and non-family firms. As for the attitude of managers toward seniority wage, neither the explained effect nor unexplained one is significant. However, the explained effect of regular wage increase is significant at 10% level, and it accounts for 37% of the overall differences, although the unexplained effect is not significant.
6. Conclusion In this paper, we analyzed the relationship between employee associations and managers to show that industrial relations in Japanese SMEs are different between family and non-family firms. In short, we examined three hypotheses. First, managers show a different attitude towards unions between non-family firms and family ones. Second, voice-oriented employee associations are formed in non-family firms differently from family ones. Third, the voice-effect of these associations on turnover is different between family firms and non-family ones. Our results were as follows. First, managers in non-family firms have a more favorable response towards unions as organizations than those in family firms. Managers in family firms tend to regard unions as harmful organizations to their management because unions may bring in outsiders that would hinder management. On the other hand, those from non-family firms regard unions as good organizations to communicate with their employees. Second, voice-oriented employee associations tend to be formed more in non-family firms than in family ones. Third, these associations have a voice effect suppressing turnover rates in non-family firms, though not in family ones. 19
However, this paper has two limitations. First, we do not deal with the endogeneity of determining family firm and non-family firm. Second, it may be insufficient to deal with the problem of endogeneity that turnover rate might affect the formalizing voice-oriented employee associations, though we consider this problem by using years of employee associations as an independent variable. We conclude that the relationship between managers and voice-oriented employee associations differ between family firms and non-family ones in Japanese SMEs. Perhaps this is because managers in family firms do not view voice-oriented employee associations as useful to the firms. On the contrary, they can be harmful to firms, because they impede management. We have shown this by analyzing manager attitudes towards unions, though not voice-oriented employee organizations. Moreover, their attitude towards these organizations makes it difficult to form voice-oriented employee associations in family firms. So, there are less initiatives in family firms that allow employees to discuss labor conditions with their managers. In addition, we have shown that even if employee associations are formed in family firms, their voice is not strong enough to decrease turnover rates by expressing employee complaints. In conclusion, employee associations’ voice is effective in non-family firms of Japanese SMEs. However, we cannot conclude that voice-oriented employee associations can substitute for unions in family firms, because these associations are rarely formed in these type of Japanese SMEs. Moreover, employee associations are not effective in reducing the turnover rates in family firms.
20
REFERENCES Aoki, M., (1984). The Cooperative Game Theory of the Firm. Oxford: Oxford University Press. Aoki, M., Kim, H., and Okuno-Fujiwara, M. (1997). The Role of Government in East Asian Economic Development: Comparative Institutional Analysis, Oxford: Clarendon Press. Bertrand, M., and Sendhil, M. (2003). Enjoying the quiet life? Corporate governance and managerial preferences. Journal of Political Economy, 111(5): 1043-1075. Bolton Committee Report (1971), Report of the Commission of Inquiry on Small Firms, chaired by J.E. Bolton, Cmnd 4811, HMSO, London. Bouquin S, Leonardi S, Moore S (2007) Employee representation and voice in small and medium-sized enterprises. An introduction to the SMALL project. In: SMALL: Representation and Voice in Small and Medium Sized European Enterprises: Monitoring Actors, Labour Organisations and Legal Frameworks. 5th Framework Programme, pp. 19–28. Bryson, A. (2004) ‘Managerial responsiveness to union and non-union worker voice in Britain’, Industrial Relations: A Journal of Economy and Society, Vol. 43, No. 1, 213-241
Bryson, A., Charlwood, A., and Forth, J. (2006). Worker Voice, Managerial Response and Labour Productivity: An Empirical Investigation, Industrial Relations, Vol.37, No. 5: 438-455. Bryson, A., Willman, P., Gomez, R. And Kretschmer, T. (2013) 'The Comparative Advantage of Non-Union Voice in Britain, 1980-2004', Industrial Relations: A Journal of Economy and Society, 52, S1: 194-220 Forth J, Bewley H, Bryson A (2006) Small and Medium-sized Enterprises: Findings 21
from the 2004 Workplace Employment Relations Survey. London: ESRC, ACAS and PSI. Freeman, R. B. and Medoff, J. (1984). What do Unions do? New York: Basic Books. Holten AL, Crouch C (2014) Unions in small and medium-sized enterprises: A family factor perspective. European Journal of Industrial Relations 20(3): 273–290. Intrafirm Communication Research Group (1991). Kigyonai Komyunikeeshon Kenkyukai (Intrafirm Communication Research Group). Chusho Kigyo niokeru Kigyonai Komyunikeeshon no Jittai (The Reality of Intrafirm Communication in Small and Mid-Sized Firms). Tokyo: Labor Issue Research Canter. Kirton, G. and Read, I. (2007). Inequalities in Europe’s SMEs: The Challenges for a trade union agenda. SMALL: Representation and Voice in Small and Medium Sized European Enterprises: Monitor Actors, Labour Organization and Legal Framework Programme, pp. 100-110. Jacoby, S. M. (2005). The Embedded Corporation: Corporate Governance and Employment Relations in Japan and the United States. Princeton and Oxford: Princeton University Press. Koike, K. (1981). Chu-so Kigyou no Jyukuren (The Mastership of Small and Medium-sized Enterprises), Tokyo: Doubunsha. Marlow, S. (2002). Regulating Labour Management in Smaller Firms. Human Resource Management Journal, Vol. 12, No. 3: 25-43. Marlow, S. (2003). Formality and Informality in Employment Rotations: The Implication for regulatory Compliance by Smaller Firms. Environment and Planning C: Politics and Space, Vol.21: 531-547.Morikawa, M. (2010). Labor Unions and Productivity: An Empirical Analysis Using Japanese Firm-Level Data. 22
Labour Economics, 17(6), pp.1030-1037. Morishima, M. and Tsuru, T. (2000). Nonunion Employee Representation in Japan. In Kaufman, Bruce and Taras, Daphne (Eds), Nonunion Employee Representation: History, Contemporary Practice, and Policy (pp. 386-409). Armonk, NY: M.E. Sharpe. Moule, C. (1998). Regulation of Work in Small Firms: A View from the Inside. Work, Employment and Society, Vol. 12, No. 4 (December): 635-653. Mueller, H. M. and Philippon, T. (2007). Family Firms and Labor Relations. American Economic Journal: Macroeconomics, Vol. 3, No. 2 (April 2011): 218-245. Ram, M. (2001). Family dynamics in a small consultancy firm: A case study. Human Relations, Vol. 54, No. 5: 395-418. Ram, M. , Edwards, P. , Gilman, M. and Arrowsmith, J. (2001) ‘The Dynamics of Informality: Employment Relations in Small Firms and the Effects of Regulatory Change’ , Work Employment and Society 15(4): 845-861 . Rainnie A (1989) Industrial Relations in Small Firms: Small isn’t Beautiful. London: Routledge. Ryan, A. (2005). Representation, Consultation and the Smaller Firm. In S. Marlow, D. Patton and Ram, M. (Eds), Managing Labour in Small Firms, London: Routledge. Shleifer, A., and Summers, L. H. (1988). Breach of Trust in Hostile Takeovers. In edited by Alan J. Corporate Takeovers: Causes and Consequences (pp. 33-56). Chicago: University of Chicago Press. Tachibanaki, T. and Noda, T. (2000). The Economic Effects of Trade Unions in Japan, London: Macmillan Press Ltd. Van Gyes. G. (2006). Industrial Relations in Europe 2006, Luxembourg: European 23
Commission. Verma, A. (2005). What Do Unions Do to the Workplace? Union Effects on Management and HRM Policies. Journal of Labor Research, 26, No. 3: 415-449. Wilkinson, A. (1999). Employment Relations in SMEs. Employee Relations, Vol. 21, No. 3:206-217.
24
Figure 1
The rate of unionization by firm size
60
50 40 2006
30
2005
20 10 0 1,000~
100~999
1~99
Source:Ministry of Health, Labor, and Welfare “Survey on Employment Trends” Note: Defined small-medium size companies as 5-99 regular employees and large company as more than 100 regular employees
Table 1 Employee Full sample 0~5 6~20 21~50 51~100 101~300 301~
The percentage of family firm by firm size Not Founder’s family Founder’s family and Founder’s family and Not Not Founder’s family and not and promoted from Promoted from employee Promoted from employee promoted from employee employee 58 4.7 17.4 19.9 87.4 5.2 3.7 3.7 77.2 5.6 8.8 8.4 60 5.4 17.6 17.1 57.3 4.6 17.9 20.2 51.3 4.2 19.7 24.8 44 4.8 24.6 26.6
Source:Small and Medium Enterprise Agency (2002) “Survey on management strategy”
25
Table 2
Definitions of variables
Variables
Definition
Turnover Rate
average percent of voluntary quit yearly for 5 years
Wage
1= if manager answer “wage is high” to the question “what is problem with your firm”
Activity 1
1=if firms have the activity to talk with manager about labor conditions
Activity 2
1=if firms have the activity of mutual fund
Activity 3
1=if firms have the activity to handle employees’ complaints
Activity 4
1=if firms have the activity to talk with manager about production plan
Activity 5
1=if firms have the activity of recreations
V-Association
1=if firms have activity 1 or activity 4
Firm age
Year of firm age
Manager’s tenure
Years of manager’s tenure
Lifetime employment
Use choice “1. Will keep lifetime employment (LE), 2. Will do minor revision 3. Will do major revision, 4. LE is not done now
Seniority wage
Use choice “1. Will keep seniority wage (SW), 2. Will do minor revision 3. Will do major revision, 4. SW is not done now
Manager’s attitude
Use choice “1. A is near, 2. A is relatively near, 3. B is relatively near, 4. B is near” to the question “Which opinions are nearer to your manager? A: manager should listen to the employees’ needs and demands, B: manager do not have to listen to them
State of management
Use choice “1. Very good, 2. good, 3.bad, 4. very bad” to the question “what is the state of your firm”
State of competition
Use choice”1. Very hard, 2. hard, 3. relatively not hard, 4.not hard” to the question “what is the state of competition with other firms.
Regular wage increase
1= if the firm has regular wage as a system of increase as human resource management
Bonus system
1= if the firm has bonus as a system of human resource management
26
Table 3
Summary statistics family firm
non-family firm
N
mean
s.e
N
mean
s.e
turnover rate
1367
6.933
8.549
620
5.067
6.258
**
activity 1
1367
0.089
0.284
620
0.174
0.380
**
activity 2
1367
0.310
0.463
620
0.332
0.471
activity 3
1367
0.068
0.252
620
0.113
0.317
activity 4
1367
0.048
0.214
620
0.060
0.237
activity 5
1367
0.427
0.495
620
0.432
0.496
V-association
1367
0.109
0.312
620
0.190
0.393
**
Year of V-association
1344
2.757
8.826
610
4.549
10.847
**
worker
1367
0.132
0.312
620
0.240
0.846
**
sale
1264
298628 929137
595
804911 2606921 **
firm age
1367
43.399
33.003
620
35.676
23.236
**
manager's tenure
1367
17.103
13.068
620
4.306
5.172
**
wage
1367
0.067
0.251
620
0.052
0.221
Lifetime employment
1367
2.092
1.056
620
1.861
0.948
Seniority wage
1367
2.620
0.889
620
2.573
0.850
manager's attitude
1367
2.062
0.853
620
1.982
0.805
*
state of management
1367
2.404
0.641
620
2.263
0.602
**
state of competition
1367
1.770
0.749
620
1.739
0.781
q16a dummy
1367
0.713
0.453
620
0.476
0.500
**
q16b dummy
1367
0.252
0.434
620
0.137
0.344
**
q16c dummy
1367
0.495
0.500
620
0.347
0.476
**
q16d dummy
1367
0.426
0.495
620
0.284
0.451
**
q16e dummy
1367
0.465
0.499
620
0.344
0.475
**
q16f dummy
1367
0.810
0.393
620
0.706
0.456
**
Regular wage increase
1367
0.456
0.498
620
0.635
0.482
**
bonus
1367
0.725
0.447
620
0.848
0.359
**
+p<0.10; *p<0.05; **p<0.01
27
**
**
Table 4
Attitude towards Labor Unions (1)
(2)
(3)
(4)
(5)
(6)
0.231
0.100
0.166
0.130
0.133
0.081
[0.030]**
[0.022]**
[0.029]**
[0.028]**
[0.029]**
[0.026]**
0.005
0.011
0.004
-0.001
-0.013
-0.009
[0.017]
[0.014]
[0.018]
[0.017]
[0.017]
[0.014]
-0.031
-0.012
-0.008
-0.005
0.006
-0.028
[0.016]*
[0.013]
[0.016]
[0.015]
[0.015]
[0.013]*
0.000
0.000
0.000
0.000
-0.001
-0.001
[0.000]
[0.000]
[0.000]
[0.000]
[0.000]
[0.000]+
-0.035
0.134
0.075
0.098
0.067
0.051
[0.047]
[0.044]**
[0.049]
[0.047]*
[0.048]
[0.034]
0.000
0.000
-0.001
0.001
0.000
0.000
[0.001]
[0.001]
[0.001]
[0.001]
[0.001]
[0.001]
-0.009
-0.007
-0.009
-0.007
-0.005
-0.018
[0.012]
[0.010]
[0.012]
[0.012]
[0.012]
[0.010]+
0.021
-0.005
0.012
0.028
0.026
0.022
[0.014]
[0.011]
[0.014]
[0.014]*
[0.014]+
[0.012]+
0.068
0.041
0.051
0.048
0.046
0.016
[0.014]**
[0.011]**
[0.014]**
[0.014]**
[0.014]**
[0.012]
-0.044
-0.010
-0.020
-0.020
-0.035
-0.032
[0.020]*
[0.017]
[0.021]
[0.020]
[0.021]+
[0.017]+
0.007
-0.007
-0.002
0.008
0.022
-0.004
[0.016]
[0.013]
[0.016]
[0.016]
[0.016]
[0.013]
-0.022
-0.019
-0.013
-0.035
-0.024
0.001
[0.026]
[0.022]
[0.027]
[0.026]
[0.027]
[0.021]
0.021
-0.003
0.037
0.019
0.046
0.039
[0.031]
[0.025]
[0.031]
[0.030]
[0.031]
[0.027]
yes
yes
yes
yes
yes
yes
sample size
1864
1864
1864
1864
1864
1864
log likelihood
-1130.93
-925.36
-1241.62
-1192.4
-1231.05
-928.99
family firm dummy ln worker ln sale firm age wage manager's tenure Lifetime employment Seniority wage manager's attitude state of management state of competition Regular wage increase bonus industry dummy
+p<0.10; *p<0.05; **p<0.01
28
Table 5
Family Firm and Employee Association
family firm dummy ln worker ln sale firm age wage manager's tenure Lifetime employment Seniority wage manager's attitude state of management state of competition q16b dummy q16c dummy q16f dummy Regular wage increase bonus industry dummy sample size log likelihood
(1)
(2)
(3)
(4)
(5)
-0.047
0.019
-0.047
-0.010
0.011
[0.019]*
[0.028]
[0.018]**
[0.013]
[0.030]
0.006
0.037
0.015
0.006
0.043
[0.009]
[0.016]*
[0.008]+
[0.007]
[0.017]*
0.017
0.015
-0.003
-0.004
0.002
[0.009]+
[0.014]
[0.008]
[0.007]
[0.015]
0.000
0.000
0.000
0.000
0.000
[0.000]
[0.000]
[0.000]
[0.000]
[0.000]
0.007
0.022
0.030
0.006
0.047
[0.029]
[0.046]
[0.029]
[0.021]
[0.048]
0.001
0.001
0.002
0.001
0.003
[0.001]
[0.001]
[0.001]**
[0.000]
[0.001]**
0.010
-0.015
0.004
0.005
-0.002
[0.007]
[0.012]
[0.006]
[0.005]
[0.012]
-0.012
-0.026
0.002
-0.002
-0.031
[0.008]
[0.014]+
[0.007]
[0.006]
[0.014]*
-0.003
-0.002
-0.005
-0.009
-0.020
[0.008]
[0.013]
[0.007]
[0.006]
[0.014]
0.006
0.041
-0.005
-0.015
-0.012
[0.011]
[0.019]*
[0.010]
[0.008]+
[0.020]
-0.022
-0.004
-0.005
-0.006
-0.021
[0.010]*
[0.015]
[0.009]
[0.007]
[0.016]
-0.003
-0.025
0.001
-0.010
0.002
[0.019]
[0.029]
[0.016]
[0.012]
[0.032]
-0.042
0.005
-0.013
-0.006
0.000
[0.015]**
[0.025]
[0.013]
[0.011]
[0.027]
-0.059
-0.030
-0.034
-0.027
0.001
[0.019]**
[0.029]
[0.017]*
[0.014]+
[0.030]
0.053
0.045
0.042
0.028
0.055
[0.015]**
[0.025]+
0.003
0.048
0.000
-0.004
0.081
[0.019]
[0.029]+
[0.016]
[0.014]
[0.031]**
yes
yes
yes
yes
yes
1859
1859
1966
1830
1859
-598.36
-1114.4
-503.66
-368.93
-1230.41
+p<0.10; *p<0.05; **p<0.01
29
[0.014]** [0.011]**
[0.027]*
Table 6
Effect of employee association on turnover (1)
full -1.54 [0.775]* year of empl association 0.022 [0.026] Ln worker -0.101 [0.292] Ln sale -0.747 [0.216]** firm age -0.026 [0.005]** wage -1.417 [0.543]** manager's tenure 0.008 [0.014] Lifetime employment 0.547 [0.209]** Seniority wage 0.372 [0.238] manager's attitude 0.146 [0.217] state of management 1.153 [0.351]** state of competetion -0.197 [0.253] q16b dummy 0.046 [0.414] q16c dummy -0.638 [0.371]+ q16f dummy -0.1 [0.452] Regular wage increase -0.136 [0.394] bonus -0.719 [0.527] industry dummy yes sample size 1834 R2 0.12 +p<0.10; *p<0.05; **p<0.01 voice empl association
(2)
(3)
fam -1.055 [1.293] 0.015 [0.042] -0.299 [0.428] -0.515 [0.340] -0.031 [0.007]** -1.648 [0.674]* -0.015 [0.017] 0.574 [0.264]* 0.371 [0.306] 0.315 [0.279] 1.296 [0.470]** 0.2 [0.354] -0.236 [0.482] -0.972 [0.482]* -0.117 [0.642] 0.256 [0.513] -0.848 [0.647] yes 1243 0.11
non-fam -1.358 [0.793]+ 0.013 [0.027] 0.184 [0.351] -0.754 [0.249]** -0.018 [0.008]* -1.609 [0.971]+ 0.074 [0.061] 0.437 [0.268] 0.383 [0.332] -0.148 [0.356] 0.888 [0.465]+ -0.85 [0.301]** 0.876 [0.858] -0.13 [0.537] -0.064 [0.585] -0.847 [0.568] -0.107 [0.803] yes 586 0.18
(4)
(5)
(6)
full fam non-fam -1.067 -0.79 -1.075 [0.361]** [0.533] [0.436]*
-0.074 [0.292] -0.79 [0.220]** -0.025 [0.005]** -1.439 [0.538]** 0.009 [0.014] 0.638 [0.212]** 0.319 [0.239] 0.167 [0.217] 1.137 [0.346]** -0.159 [0.251] -0.014 [0.411] -0.685 [0.369]+ -0.127 [0.457] -0.042 [0.391] -0.82 [0.525] yes 1864 0.12
30
-0.201 [0.431] -0.636 [0.349]+ -0.031 [0.007]** -1.656 [0.673]* -0.015 [0.017] 0.713 [0.268]** 0.3 [0.306] 0.328 [0.279] 1.235 [0.462]** 0.224 [0.350] -0.331 [0.476] -0.973 [0.481]* -0.239 [0.654] 0.377 [0.510] -1.014 [0.645] yes 1264 0.12
0.144 [0.348] -0.695 [0.245]** -0.017 [0.008]* -1.598 [0.931]+ 0.077 [0.061] 0.387 [0.267] 0.371 [0.330] -0.133 [0.355] 0.88 [0.461]+ -0.796 [0.297]** 0.991 [0.850] -0.272 [0.531] 0.114 [0.575] -0.79 [0.557] -0.06 [0.797] yes 595 0.17
(7)
(8)
(9)
full
fam
non-fam
-0.027 [0.012]* -0.103 [0.292] -0.745 [0.216]** -0.025 [0.005]** -1.4 [0.543]* 0.008 [0.014] 0.542 [0.209]** 0.382 [0.238] 0.161 [0.217] 1.154 [0.351]** -0.195 [0.253] 0.053 [0.414] -0.619 [0.371]+ -0.109 [0.451] -0.159 [0.395] -0.716 [0.527] yes 1834 0.11
-0.019 [0.017] -0.307 [0.429] -0.504 [0.340] -0.031 [0.007]** -1.626 [0.673]* -0.015 [0.017] 0.568 [0.264]* 0.374 [0.306] 0.327 [0.279] 1.297 [0.470]** 0.196 [0.354] -0.248 [0.482] -0.963 [0.481]* -0.109 [0.643] 0.252 [0.513] -0.844 [0.647] yes 1243 0.11
-0.03 [0.015]* 0.185 [0.351] -0.757 [0.249]** -0.016 [0.008]* -1.636 [0.969]+ 0.073 [0.061] 0.435 [0.267] 0.407 [0.332] -0.142 [0.355] 0.883 [0.467]+ -0.838 [0.301]** 0.955 [0.855] -0.116 [0.538] -0.103 [0.582] -0.905 [0.568] -0.11 [0.803] yes 586 0.18
Table 7
Effect of employee association on turnover by firm size
voice empl association year of empl association ln worker Ln sale firm age wage manager's tenure Lifetime employment Seniority wage manager's attitude state of management state of competition q16b dummy q16c dummy q16f dummy Regular wage increase bonus industry dummy sample size R2
(1) (2) (3) (4) fam 100> nonfam>100 fam<100 nonfam<100 0.9 -2.477 -1.439 0.468 [2.474] [0.959]* [1.369] [1.186] -0.021 0.049 0.018 -0.042 [0.075] [0.034] [0.047] [0.042] 0.113 1.467 -0.697 -1.537 [0.592] [0.640]* [0.704] [0.780]* -0.604 -0.914 -0.303 -0.648 [0.414] [0.401]* [0.459] [0.359]+ -0.031 -0.004 -0.03 -0.026 [0.009]** [0.010] [0.009]** [0.012]* -1.618 -1.534 -1.691 0.539 [0.914]+ [1.177] [0.923]+ [1.466] -0.039 0.084 -0.008 0.066 [0.022]+ [0.087] [0.022] [0.075] 0.36 0.79 0.581 0.105 [0.309] [0.405]+ [0.345]+ [0.362] 0.167 0.038 0.467 0.676 [0.353] [0.372] [0.404] [0.511] -0.142 -0.4 0.463 0.086 [0.310] [0.300] [0.368] [0.639] 0.481 0.508 1.44 1.307 [0.539] [0.529] [0.605]* [0.689]+ 0.749 -0.704 -0.074 -0.889 [0.554] [0.363]+ [0.450] [0.484]+ 0.429 -2.371 -0.433 3.487 [0.713] [0.980]* [0.630] [1.286]** -0.706 0.947 -0.822 -0.774 [0.662] [0.738] [0.643] [0.779] -0.556 0.793 -0.034 -1.112 [0.737] [0.608] [0.868] [0.987] 0.128 -1.086 0.411 -0.646 [0.656] [0.871] [0.683] [0.742] 0.269 0.087 -1.204 -0.491 [0.737] [0.999] [0.828] [1.040] yes yes yes yes 349 276 894 310 0.27 0.27 0.1 0.26
+p<0.10; *p<0.05; **p<0.01
31
Table 8
Oaxaca Blinder Decomposition Explained
Employee association Ln worker Ln sale Firm age Wage Manager's tenure Lifetime employment Seniority wage Manager's attitude State of management State of competition q16b dummy q16c dummy q16f dummy Regular wage increase Bonus Construction Electricity Information Delivery Commerce Finance Real estate Food service Medical Education Serve Others
coef
s.d
%
coef
s.d
%
-0.085** -0.089
0.031 0.225
4.7 4.9
-0.041 1.532
0.113 2.907
2.3 -84.5
-0.695** 0.205**
0.187 0.073
38.3 -11.3
-0.687 0.506*
6.211 0.206
37.9 -27.9
0.024 0.095
0.018 0.182
-1.3 -5.2
0.004 0.488
0.072 0.308
-0.2 -26.9
-0.134* -0.010
0.061 0.013
7.4 0.6
-0.622 0.183
0.484 1.070
34.3 -10.1
-0.012 -0.158+ 0.008 0.007 0.120** 0.017 0.004 -0.100 -0.003 0.010 0.037 0.023 -0.033 0.104 0.003 -0.013 0.028 -0.020 0.063 -0.003
0.025 0.081 0.012 0.049 0.033 0.050 0.070 0.071 0.011 0.012 0.039 0.024 0.043 0.114 0.004 0.016 0.033 0.023 0.054 0.004
0.6 8.7 -0.4 -0.4 -6.6 -1.0 -0.2 5.5 0.2 -0.6 -2.0 -1.3 1.8 -5.7 -0.2 0.7 -1.5 1.1 -3.5 0.2
-0.922 -0.812 -1.784** 0.210* 0.273 0.259 -0.678+ 0.788 -0.076 -0.002 0.035 -0.045 -0.198 -0.085 0.013 0.136 0.034 -0.011 -0.206 -0.063
0.977 1.561 0.538 0.089 0.172 0.589 0.348 0.659 0.085 0.006 0.041 0.061 0.204 0.094 0.018 0.151 0.049 0.012 0.207 0.069
50.8 44.8 98.4 -11.6 -15.1 -14.3 37.4 -43.4 4.2 0.1 -1.9 2.5 10.9 4.7 -0.7 -7.5 -1.9 0.6 11.3 3.5
0.0
0.567
4.651
-31.2
33.6
-1.205**
0.356
66.4
Constant Total Prediction_1
Unexplained
-0.609**
0.223
Prediction_2
5.049 6.863
0.453 0.555
Difference
-1.814
0.326
+p<0.10; *p<0.05; **p<0.01
32