Estimation and Comparison of Treasury Auction Formats when Bidders are Asymmetric Olivier Armantier
Erwann Sbaïy
May 2005
Abstract The structural parameters of a share-auction model accounting for asymmetries across bidders, as well as supply uncertainty are estimated with a sample of French Treasury auctions. We …nd evidence of both informational and risk aversion asymmetries across bidders. A counter-factual analysis also suggests that, in the context of the French Treasury auctions, a shift from the discriminatory to the uniform-price format would simultaneously bene…t the French Treasury and the auctions’participants.
Université de Montréal, Département de sciences économiques, Pavillon Lionel-Groulx, 3150, Jean-Brillant, Montréal QC H3T 1N8. Email:
[email protected]. y Department of Economics, Commerce A Building, The University of Auckland, Private Bag 92019, Auckland, New Zealand. We are very grateful to Guillermo Caruana, Ali Hortaçsu, Soiliou Daw Namoro, Harry Paarsch, Nicolas Treich, Michaël Visser, James Wang, and Patrick Waelbroeck for insightful comments on earlier drafts. We are especially grateful to Jean-Pierre Florens for his help and support. Olivier Armantier would like to thank the Universitat Pompeu Fabra, and the Institut d’Analisi Economica where part of this research was conducted. We also thank seminar participants at the Université de Toulouse, Universitad Carlos III, Michigan Business School, University of British Columbia, Université de Montréal, University of California Davis, and the ECARES at the Université Libre de Bruxelles. All remaining errors are ours.
1. Introduction Since the early 1960s, economists have debated the most appropriate auction mechanism to sell Treasury securities. As we shall see, the various theoretic models proposed, and the numerous empirical analyses conducted, have not produced an unambiguous conclusion. In fact, two recent papers by Wang and Zender (2002), and Ausubel and Cramton (2002), suggest that a theoretical ranking of auction formats with respect to the revenue raised by the Treasury may be impossible in general. The authors actually conclude that the superiority of an auction mechanism may only be determined empirically on a case-by-case basis. Moreover, economic analyses of Treasury auctions are typically based on the empirically questionable assumption that participants are symmetric with respect to resources, information available, and aversion to risk. The object of the present paper is to estimate a structural model with a sample of French Treasury auctions to test whether participants are symmetric, and to determine which auction format is preferable in this context. At a Treasury auction, a speci…c type of security is sold to several accredited …nancial institutions. The bidders submit simultaneously a sealed bid consisting of a demand schedule. A bid therefore speci…es the number of units of the security requested at each possible price. The market-clearing price, also known as the stop-out-price, matches aggregate demand with the available supply of security. Two basic formats are typically considered: at discriminatory auctions, the most frequently used, the highest bids are …lled at the bided price until supply is exhausted; at uniform-price auctions, bidders pay the stop-out-price for all units they requested at prices exceeding the stop-out-price. Beginning with Wilson (1979), Treasury auctions have been typically modelled as common-value auctions in which symmetric bidders compete for a share of the quantity supplied.1 In practice, however, a broad range of …nancial institutions participate in Treasury auctions, and the symmetry assumption may be questioned. In France for instance, a small group of large banks submits most bids, and controls roughly 60% of the securities allocated.2 As we shall see, ignoring 1
Anton and Yao (1992), as well as Hortaçsu (2002a), are exceptions as they consider that treasury auctions have essentially a private-values component, and that bidders submit discrete demand functions. 2 This type of asymmetries is not speci…c to the French Treasury auctions. For instance, Hortaçsu (2002a) …nds that 20 (50) out of 134 participants entered 20 (less than 10) out of the 27 Turkish Treasury auctions in his sample. In addition, Hortaçsu notes that “the top 5 bidders capture 30% evenly, and the top 15 capture about 70% of the issues.”Comparable asymmetries
2
the presence of asymmetries across participants may have serious consequences on optimal bidding behavior, and it may also a¤ect the ranking of the auction formats in terms of the revenue generated by the Treasury. Indeed, our theoretic model suggests that risk averse, and/or less-informed bidders become relatively more aggressive at uniform-price auctions, since they do not have to pay their bids. This, in turns, a¤ects the allocation of the security among the di¤erent types of bidders, as well as the revenue raised by the Treasury. Our results, however, con…rm that the superiority of an auction format cannot be established in general in this asymmetric environment, as it depends on the structural parameters underlying the model. In other words, as suggested by Ausubel and Cramton (2002), the choice between the uniform-price and discriminatory auction formats in the presence of asymmetric bidders remains essentially an empirical question, that we need to address econometrically in the speci…c case of the French Treasury auctions. Our …rst objective is to develop a structural model to test whether the participants in the French Treasury auctions i) have access to information of di¤erent quality regarding the value of the security for sale, and ii) have di¤erent levels of risk aversion. To do so, we generalize the common-value share auction model of Wang and Zender (2002), in which the quantity for sale is not perfectly known at the time of the auction (due to non-competitive bids), to account for informational and risk aversion asymmetries across bidders.3 This generalized model cannot be solved analytically, and we have to rely on numerical techniques to approximate the intractable Bayesian Nash equilibrium (hereafter BNE). The structural parameters underlying our Treasury auction model are then estimated using an original application of the method of simulated moments to the estimation of games of incomplete information. This method enables in particular to take advantage of all the information available in the sample. The estimated parameters suggest that the participants in French Treasury auctions may be divided in two distinct groups. One group consisting mostly of smaller …nancial institutions characterized have been observed in Treasury auctions around the world (see e.g. Umlauf 1993 in Mexico, Malvey and Archibald 1998 in the US, and Bjonnes 2001 in Norway). 3 Non-competitive bids consist only in a (limited) quantity demanded by accredited …nancial institutions that will be …lled systematically by the auctioneer. The price paid by noncompetitive bidders is the same, but it is unknown at the time they submit their bids. Depending on the auction rule, the price is either equal to the stop-out-price, or a function of the prices paid by the competitive bidders in the subsequent auction. The quantities demanded by non-competitive bidders are only revealed after the auction. As a result, competitive bidders do not known at the time of the auction, the remaining quantity that will be available to them.
3
by a higher level of risk aversion, and receiving signi…cantly noisier signals about the true value of the security. Finally, Monte Carlo simulations based on the estimated structural parameters are conducted to compare the discriminatory and uniform-price formats. We …nd that, in the context of the French Treasury auctions, the uniform-price format would simultaneously increase (on average) the revenue of the Treasury, and the utility of both types of participants. This result may be explained by the combination of two factors. First, the uniform-price auction signi…cantly reduces the variance of the bidders pro…ts. As a result, the expected utility of the participants (who are risk averse) increases under the uniform pricing rule, even though the expected pro…ts of some bidders may slightly diminish. Second, as small bidders become more aggressive, the average price paid by a bidder (regardless of type) for a unit of the security increases under the uniform-price format. Consequently, the total revenue of the Treasury rises on average compared to the discriminatory format. The paper is structured as follows: in section 2, we summarize the literature relevant to the present paper; the share auction model accounting for asymmetry across participants and supply uncertainty is presented in section 3; the technique to approximate intractable BNEs is applied to the share auction model in section 4; section 5 brie‡y describes the market for the French Treasury securities, as well as our sample of data; in section 6 we complete the speci…cation of the structural share auction model; the econometric estimation technique is outlined in section 7; the results of the structural estimation of the French Treasury auctions are analyzed in section 8; section 9 compares the discriminatory and uniform-price auction formats; …nally, section 10 concludes.
2. Related Literature Beginning with Friedman (1960), the choice between the uniform-price and discriminatory auction formats has been often debated among economists.4 Uniformprice auctions were initially presented as the revenue maximizing mechanism to sell Treasury securities. The argument o¤ered was that discriminatory auctions reduce competition by discouraging less informed bidders from participating, and 4
For surveys of the literature on Treasury auctions, see Bikchandani and Huang (1993), Das and Sundaram (1996), Nandi (1997), or Klemperer (2000).
4
therefore facilitate collusion.5 These contentions were later on disputed on the basis of comparisons with single-unit auction models. However, building on the share auction model of Wilson (1979), Back and Zender (1993) demonstrated that conclusions drawn from single-unit auctions cannot be systematically extended to the multi-unit case. In particular, Back and Zender found that uniform-price auctions may have a continuum of undesirable collusive equilibria, some of which yielding arbitrarily low revenue to the seller. More recently, Wang and Zender (2002) extended the share auction model to account for risk aversion, and random supply generated by the presence of non-competitive bids. Wang and Zender demonstrate that the presence of random supply drastically reduces the set of implausible equilibria.6 In fact, they show in an example that the uniform-price equilibrium is unique when supply is random. More importantly, Wang and Zender observe that it is in general impossible to compare the uniform and discriminatory pricing rules in terms of the revenue raised by the Treasury. Adopting a slightly di¤erent approach, Ausubel and Cramton (2002) …nd as well that the theory does not enable to rank unambiguously the two auction formats. In fact, they conclude that “determining the better pricing rule is necessarily an empirical question.”The superiority of an auction format, in the context of the French Treasury, therefore depends on speci…c empirical factors, such as the bidders’individual valuations of the Treasury securities, and/or their levels of risk aversion. From an empirical perspective, two approaches should be distinguished: the reduced-form and the structural approach. The reduced-form approach has been the most frequently applied to rank auction formats in terms of revenue. After the 1992 “Salomon scandal”, the US Treasury shifted momentarily from the discriminatory to the uniform-price format to sell some of its securities.7 This natural experiment prompted a series of reduced-form analysis to evaluate the consequences of such a decision. For instance, Simon (1994) estimated that the US government lost large amounts of money by modifying the auction format, while Mester (1995), Nyborg and Sundaresan (1996), as well as Malvey and Archibald (1998) found that the uniform-price auction had a positive, but often insigni…cant e¤ect on the Treasury revenue. Other reduced-form analyses conducted after natural experiments in di¤erent countries (e.g., Umlauf 1993 in Mexico, Tenorio 1993 in 5
Note that these early arguments were rather informal since the strategic nature of the Treasury auctions was typically ignored. 6 A similar argument has been advanced by Klemperer and Meyer (1989) who found that demand uncertainty in procurement auctions reduces the set of equilibria to a singleton. 7 See Jegadeesh (1993) for details.
5
Zambia, or Berg, Boukai and Landsberger 1999 in Norway), seem to give a slight edge to the uniform-price format. However, conclusions from the reduced-form approach are often considered too inconsistent to contribute unambiguously to the debate pertaining to the choice of Treasury auction mechanism. In fact, the results in Malvey and Archibald (1998) suggest that reduced-form analyses following natural experiments may not be the most appropriate approach to assess the superiority of an auction format. Indeed, the authors note that after shifting to the uniform pricing rule, the auctions’outcomes became much more volatile from one auction to the next. As we shall see, this noise may be an intrinsic property of the uniform-price format, but it may also re‡ect the learning process experienced by bidders immediately after shifting from a pricing rule to the other.8 As a result of this added noise, a before/after reduced-form analysis may not be able to identify unambiguously the revenue di¤erences between auction formats, especially if these di¤erences are small. The second empirical approach has been adopted only recently, following the developments in the estimation of structural models of incomplete information.9 This approach appears most promising to address the question of auction format in speci…c contexts, such as the French Treasury auctions, in which no natural experiment has been conducted. Hortaçsu (2002a) adopts such a structural approach to estimate non-parametrically a symmetric private-values model, in which the quantities demanded belong to a …nite grid. Considering a sample from Turkish Treasury auctions, the author …nds the discriminatory format to yield higher revenues than the uniform-price mechanism. Fevrier, Preguet and Visser (2002) estimate with a relatively small sample from the French Treasury the share auction model originally proposed by Wilson (1979). They …nd that the uniformprice format would have lowered by 8% (on average) the Treasury’s revenue. Finally, Castellanos and Oviedo (2002) applies the structural approach developed by Fevrier et al. (2002) to a sample of Mexican Treasury auctions. In contrast with the previous studies, Castellanos and Oviedo …nd that a uniform-price auction would increase the Mexican Treasury’s revenue by 1.44%. The authors explain this result by a higher estimated variation in the Mexican participants’ signals 8
Moreover, one cannot exclude that during a natural experiment, bidders act strategically not to maximize their immediate pro…ts, but to in‡uence the auction format the Treasury will ultimately adopt. 9 See e.g., Paarsch (1992), Donald and Paarsch (1993, 1996), La¤ont, Ossard and Vuong (1995), Guerre, Perrigne and Vuong (2000), as well as Florens, Protopopescu and Richard (2002).
6
about the true value of the security. To conclude, note that the pertinence of the structural approach has been questioned as it relies on simplifying, and often empirically questionable assumptions (e.g., symmetry and/or risk neutrality), in order to solve the theoretic model analytically, or to enable the application of an econometric estimator. The present paper, although based on the structural approach, di¤ers in several aspects from the three previously mentioned analyses. First, unlike Hortaçsu (2002a), we consider a common-value model with continuous bid functions. Both assumptions are generally considered reasonable to describe Treasury auctions.10 Second, our model accounts for risk aversion and demand uncertainty. As we shall see, these elements better describe the French Treasury auctions, they eliminate non-realistic equilibria, and ignoring them may have a signi…cant impact on the ranking of auction mechanisms. Third, the theoretical model is developed so that we can test for informational and risk aversion asymmetries.11 Fourth, instead of simplifying the model for tractability purposes, we rely on approximation techniques to solve the complex theoretic model. Finally, we apply an alternative estimation approach that enables to take advantage of all the information available in the sample.
3. A Share Auction Model with Asymmetric Bidders and Risk Aversion The model adopted is largely inspired from Wang and Zender (2002). A speci…c quantity of a perfectly divisible good is for sale to N competitive bidders (N 2) each maximizing his ex-ante expected utility.12 The quantity supplied to the 10
For arguments supporting the use of the common-value paradigm and continuous bids in Treasury auctions see e.g., Wilson (1979), Das and Sundaram (1996), Wang and Zender (2002), as well as Ausubel and Cramton (2002). 11 Hortaçsu (2002a) also considers the e¤ect of a potential distributional asymmetry. He …nds that the presence of informational asymmetry would not modify the overall nature of the results he obtained under the symmetry assumption. 12 Prior to the auction, potential bidders are assumed to decide simultaneously whether or not to participate (i.e. submit a non-zero competitive bid). This decision is assumed to be fully exogenous (i.e. independent of the auction characteristics, the other bidders’participation decisions, and any private information), but observable by others. Therefore, N is common knowledge. Moreover, following most of the Treasury auction literature, non-competitive bids are assumed to result from exogenous decisions made prior to the auction. Therefore, noncompetitive bidding will not be explicitly modelled, and it is assumed to a¤ect only the quantity
7
bidders by the auctioneer is unknown at the time of the auction.13 From the players perspective, the quantity supplied is a random variable Q 2 Q , with cumulative distribution function (c.d.f.) G (Q). The actual value V 2 V of the good is the same to each bidder, but it is unknown at the time of the auction. The c.d.f. of the true value, denoted F0 (V j ), depends on a parameter to be estimated. We consider that two groups of asymmetric bidders, respectively composed of N1 and N2 bidders (N1 + N2 = N ), participate in the auction.14 Bidders within a given group are symmetric, but bidders are asymmetric across groups. To derive this asymmetric model, we will therefore consider a representative bidder in each of the two groups. Bidder i in group l = 1; 2 receives a signal, si;l 2 S containing some private information about the value of the good. This signal is generated from a conditional distribution with c.d.f. Fl (si;l jV; l ), where ( 1 ; 2 ) are parameters to be estimated.15 From a player’s perspective, G (:), F0 (:j ), N1 , N2 , F1 (:j:; 1 ) and F2 (:j:; 2 ) are all common knowledge. After bidder i in group l receives the private signal si;l , she submits a sealed bid. This bid consists of a schedule specifying the share of the good demanded 'i;l (p; si;l ) for any price p > 0. The demand schedules are assumed to be (piecewise) continuously di¤erentiable. The market clearing price p0 is de…ned as the non-negative price at which aggregate competitive demand equals total supply: N1 X i=1
0
'i;1 p ; si;1 +
N2 X
'j;2 p0 ; sj;2 = Q
given p0
0 .
(1)
j=1
At Treasury auctions, the above price is often called the stop-out-price. Winning bids are those submitted for prices greater than the stop-out-price. In other available to competitive bidders. The competitive bidders will be referred, in the remainder, as the “bidders”, the “players”, or the “participants” unless mentioned otherwise. 13 In practice, the quantity available to competitive bidders is uncertain because noncompetitive bids, which are frequently used in French Treasury auctions, are only revealed after the auction. In addition, some of the uncertainty also originates from the fact that the French Treasury announces only a bracket for the total quantity of securities to be supplied to competitive and non-competitive bidders. 14 The methodology developed below trivially generalizes to a larger number of asymmetric groups. Interviews with representants of the French government in charge of conducting the auctions indicated that participants in French Treasury auctions could essentially be divided in two distinct groups. 15 We assume in the remainder that the distributions of the private signals, and the distributions of the private signals conditional on the common value have the same support for both types of bidders.
8
words, bidder i in group l receives a quantity 'i;l (p0 ; si;l ). In order to derive the equilibrium strategies for both auction formats simultaneously, we adopt the notation of Viswanathan and Wang (2000), and denote the payment of bidder i in group l as pZmax i 0 0 p 'i;l p ; si;l + 'i;l (p; si;l ) dp , (2) p0
pmax i
where is the highest price for which bidder i’s demand is strictly positive. Within this formulation, = 0 corresponds to the price paid under the uniformprice format, and = 1 corresponds to the price paid under the discriminatory format. The ex-post pro…t realization of bidder i in group l may then be written as
i;l
p0 'i;l p0 ; si;l
'i;l ( ); p0 ; V; si;l = V
pZmax i
'i;l (p; si;l ) dp .
(3)
p0
To account for the possibility of risk aversion for bidder i in group l, we will consider a CARA utility function of the form Ui;l 'i;l ( ); p0 ; V; si;l ;
l
=
exp
l
i;l
'i;l ( ); p0 ; V; si;l
,
(4)
where l > 0 is the constant level of absolute risk aversion for players in group l.16 We adopt the CARA speci…cation because, unlike other speci…cations often used with private-values auctions, it enables one to optimize an individual’s utility without requiring to know his wealth. In addition, the CARA speci…cation is well suited for common-value auctions as the utility remains de…ned for any gain and loss. Note however, that the absolute risk aversion level of an individual is typically considered to vary with its wealth. In lack of full information regarding bidders’identity and wealth, we assume that auctions’pro…ts do not signi…cantly a¤ect the wealth of the participants. In other words, l will be assumed to remain constant over the period spanned by our sample of French Treasury auctions. 16
According with part of the …nancial literature, we suspect that, more than the …nancial institution itself, it is the manager(s) in charge of bidding in Treasury auctions that may exhibit risk aversion, as his job or his remuneration may depend on how he performs. Note however, that risk aversion is not an assumption imposed in the model, it is an hypothesis that will be tested.
9
4. CSE Approximation for Auctions of Shares To the best of our knowledge, the asymmetric share auction model we just presented cannot be solved analytically. Approximation methods therefore appear to be the only feasible approach to solve the model without imposing simplifying assumptions.17 We adopted the Constrained Strategic Equilibrium (hereafter CSE) technique developed by Armantier, Florens and Richard (2005a) (hereafter AFR) to approximate intractable BNE. The CSE approach is explained in details in Appendix 1. The basic idea of the approach however, consists in calculating an equilibrium within each element of a family of expanding constrained sets of amenable strategies. As further explained in Appendix 1, this sequence of CSE may be shown to converge toward a BNE under standard conditions. Moreover, this approach provides the proper combination of accuracy and computational speed necessary to solve and estimate the asymmetric French Treasury auction model.18 We now present the CSE approximation method in the speci…c context of the share auction model introduced in the previous section. (k) Let us denote 'i;l (p; si;l ; di;l ), the constrained strategy of player i in group l within the constrained set H (k) H, where di;l 2 Rk is a parameter, and H is the set of all possible strategies. The stop-out-price p0 is then de…ned by the implicit equation B p0 ; s; d; Q =
N1 X
(k)
'i;1 p0 ; si;1 ; di;1 +
i=1
N2 X
(k)
'i;2 p0 ; sj;2 ; dj;2
Q=0 ;
(5)
j=1
where d = (d1;1 ; :::; dN1 ;1 ; d1;2 ; :::; dN2 ;2 ). We can then write p0 as a function p0 (s; d; Q) of the strategies, the quantity available to competitive bidders, and the signals s = (s1 ; s2 ), where sl = (s1;l ; :::; sNl ;l ) and l = 1; 2. The pro…t function of bidder i in group l becomes i;l
(d; V; s; Q) = V
(k)
p0 (s; d; Q) :'i;l p0 (s; d; Q) ; si;l ; di;l
pZmax i
(k)
'i;l (p; si;l ; di;l ) dp ;
p0(s;d;Q)
(6) 17
Hortaçsu (2002b) also argues in favor of the use of approximations methods to solve Treasury auction models, and in particular discriminatory auction models, which are often analytically intractable. The approximation technique he adopts, although slightly di¤erent, relies on comparable principles as the method we consider in this paper. 18 See AFR (2005b) for details on how to calculate the CSEs numerically in practical applications.
10
and her (unconditional) expected utility may then be written as ei;l (d; l ) = EQ;V;s [exp [ l i;l (d; V; s; Q)]] U Z Z Z = exp [ l i;l (d; V; s; Q)] d (Q; V; s) Q
(7)
;
N S
V
where (Q; V; s) is the joint distribution of the quantity supplied, the true value V , and the vector of private signals s. We can then derive the …rst order conditions de…ning the constrained bestresponse (i.e. the best-response when one is constrained to use a strategy within H (k) ) of a representative player i in group l to her opponents strategy pro…le Z Z Z @ @ e Ui;l (d; l ) = l exp [ l i;l (d; V; s; Q)] : i;l (d; V; s; Q) d (Q; V; s) = 0 , @di;l @di;l Q
V
N S
(8)
where @ @di;l
i;l
()=(
1)
@ @di;l (k) i;l
@ 0 (k) p ( ) :'i;l ( )+ V @di;l (k) i;l
(p; si;l ; di;l )jp=pmax i
p0 ( ) @ @di;l
(k) i;l
@ (k) @ 0 @ (k) 'i;l ( ) p ()+ ' () @p @di;l @di;l i;l (p; si;l ; di;l )jp=p0
;
(9) 1
(k)
( ) is the primitive of 'i;l ( ) with respect to p, @d@i;l p0 ( ) = @d@i;l B ( ) @p@ 0 B ( ) , N1 N2 P P (k) (k) (k) @ @ @ @ @ 0 B ( ) = ' ( ), and B ( ) = ' (p ; s ; d )+ ' (p0 ; sj;2 ; dj;2 ). i;1 i;1 @di;l @di;l i;l @p0 @p0 i;1 @p0 i;2 i=1
j=1
In the remainder, we concentrate on pure strategy equilibria in which players within a group behave symmetrically. In other words, the CSE is such that (k) (k) 'i;l;CSE = 'l;CSE , or equivalently di;l;CSE = dl;CSE (8i = 1; :::; Nl and 8l = 1; 2). Since the parameter dl;CSE is of dimension k, and since we only have to consider a representative player in each group, the determination of the CSE reduces to …nding the …xed point of a system of 2k non-redundant …rst order conditions of the form (9). The integrals in this system of equations may be approximated with arbitrary precision by standard Monte Carlo techniques. For instance, the expectations may be replaced by empirical means of simulated points. However, given the relatively high dimension of the integrals involved, such an approach would be 11
prohibitively time consuming. Instead, Quasi Monte Carlo techniques, developed to improve coverage, are used to increase the precision of the approximation, while relying on fewer number of simulations (see Judd 1998). Moreover, note that the resolution of the system of non-linear equations leading to the CSE is not as complex as it …rst appears. Indeed, for an appropriate se(k) (k) @ (k) lection of constrained strategies, the expressions @p 'i;l ( ), @d@i;l 'i;l ( ), @d@i;l i;l ( ) may be derived analytically, which considerably reduces the computational burden. In addition, the problem is more straightforward from a numerical perspective, than most of the traditional auction models (see e.g., AFR 2005a). Indeed, the utility functions in traditional auction models are discontinuous in players actions and strategies. Consequently, smoothing techniques must be used to solve e¢ ciently these problems numerically. In the present context, the utility functions are continuous which simpli…es signi…cantly the numerical integrations.
5. The Market and the Data 5.1. The market Our sample consists of discriminatory auctions held for two types of French government securities, the OAT and the BTAN. The OAT are the government’s long-term debt instruments with maturities ranging from seven to thirty years. The BTAN represent medium-term government debts with a maturity of either two or …ve years. The timing of these auctions unfold as follows: auctions for OAT and BTAN are held respectively the …rst and the third Thursday of each month. Four business days before the auction, the “Agence France Trésor”, which is in charge of conducting the auction, announces the details of the di¤erent “lines” to be auctioned. A line consists of either an OAT or a BTAN with speci…c characteristics including the nominal yield, the maturity, as well as a bracket for the volume of security (expressed in Euros) to be served to competitive and non-competitive bidders. Part of the announced Treasury security may then be traded on a primary (or “when-issued”) market until the date of the auction by a limited number of authorized dealers. Competitive bidders may submit a demand function. A quantity demanded is in fact an amount in Euros representing a share of the quantity sold by the Treasury.19 Prices are expressed as a percentage (formulated with two decimal digits) 19
During the period spanned by our data the French Treasury imposed a minimum purchase
12
of the nominal value of the security (one Euro).20 Moreover, pre-quali…ed bidders may submit a non-competitive o¤er for any line, consisting in a (limited) amount that will be systematically served at a price equal to the (quantity weighted) average price of the awarded competitive bids. Bids by eligible institutions, for all lines to be auctioned that day, must be submitted either electronically or in sealed envelops at least 10 minutes prior to the auction. Before the bids submitted are observed, the French Treasury sets privately the exact quantity that will be supplied to competitive and non-competitive bidders.21 Competitive bids are then ranked in descending order, and the stop-out-price is determined in such a way that the aggregate competitive and non-competitive demand matches the exact quantity supplied. In order to adjust the quantity issued as precisely as possible, the Agence France Trésor reserves the right to scale-down bids at the lowest accepted price on a pro-rata basis. Auction results are announced within …ve minutes after the end of the auction, and the Banque de France completes the delivery-versus-payment orders with the auction winners within three business days. The security may then be traded to the general public on a secondary market.22 Although occasional bidders may participate, the French State’s policy issuance essentially relies on a network of primary dealers (aka “Spécialistes en requirement of 1 million Euros for the BTAN and 2 million Euros for the OAT. French Treasury o¢ cials however, consider these minimum bids mostly symbolic compared to the amounts exchanged in Treasury auctions, and they are not believed to put any signi…cant constraints on the participants’bidding behavior. 20 The Treasury securities are expressed in Euros since 1999. The 1998 auctions expressed in French Francs, were converted in Euros at the rate of 1 Euro for 6.55957 Francs. 21 To the best of our knowledge, the French Treasury does not act strategically when setting the exact quantity to be supplied. Conversations with French Treasury auctions specialists indicate that the …nal quantity decision appears to be an adjustment to exogenous short term shocks. Note also that, unlike Back and Zender (2001), the French government does not have an incentive to set endogenously the amount of security supplied, as the quantity available to competitive bidders in French Treasury auctions would still be random, due to the presence of non-competitive bids. 22 The opening price of a security on the secondary market is often considered to be an imperfect measure of its actual value at the time of the auction. Indeed, i) there is a delay between the auction and the beginning of the trading period on the secondary market; ii) the secondary market may not be perfectly liquid; iii) actors on the secondary market may have heterogenous transaction costs; and iv) only a share of the auctioned securities are immediately traded on the secondary market as banks often hold temporarily some of their reserves in the form of government securities. Therefore, the true value of the security may be assumed to be an unobserved random variable whose distribution needs to be estimated.
13
Valeurs du Trésor”). The role of these primary dealers is to advise and assist the French Treasury in marketing appropriately its debt. In particular, the primary dealers must be active on the primary market, and maintain a liquid secondary market.23 During the period studied, the primary dealers were composed of 19 institutions accounting for over 90% of the securities bought. The involvement of the primary dealers to each French Treasury auction may vary notably between …nancial institutions. In particular, the Agence France Trésor identi…ed …ve large …nancial institutions (Crédit Agricole, Deutsch Bank, BNP-Paribas, Morgan Stanley, and Société Générale) who participated in most auctions, and were allocated during our sample period more than 60% of the securities issued. Finally, note that the common-value assumption …nds support in the fact that most of the bonds purchased at French Treasury auctions are eventually resold on the secondary market, or directly to the bidders’ own clients (e.g. mutual funds, insurance companies, individuals).24 Moreover, the ‡ow of pre-auction orders submitted by their own clients, may partially explain why participants may form di¤erent forecasts about the future market value of the bond (see also the argument in Fevrier et al. 2002 who conclude as well that the common-value paradigm best …ts the French Treasury auctions).25 To conclude this section, note that the presence of non-competitive bids, and the dominating participation of large …nancial institutions, suggest that a practitioner should account for supply uncertainty and asymmetries across bidders, in order to test whether these factors play a signi…cant role in French Treasury auctions. 5.2. Data The sample consists of 118 auctions (60 OAT and 58 BTAN) which took place at 64 di¤erent dates between May 1998 and December 2000. For each auction we observe i) the security pre-announced characteristics: the nominal yield, the 23
Since 2003, a “Spécialiste en Valeurs du Trésor” is also required to account for at least 2% of the volume auctioned over the last 12 months in order to maintain its status. 24 In particular, unlike the Turkish Treasury auctions analyzed by Hortaçsu (2002a, 2002b), the primary dealers are not required by the French Treasury to hold a portion of their reserves in the form of Treasury bonds. 25 It may be argued that the French Treasury auctions also possess a private-values component, since a bank must purchase bonds to …ll its clients pre-auction orders. However, these orders may be …lled by purchasing bonds either at the auction, or on one of the markets (i.e. primary or secondary). Therefore, as mentioned in section 2, the literature typically considers the common value paradigm more appropriate to describe Treasury auctions.
14
maturity, whether the line is an OAT or a BTAN, and the upper and lower bounds of the bracket for the quantities served to the competitive and noncompetitive bidders; ii) the number of bidders in each group;26 iii) the quantity demanded for all prices by each individual bidder; and iv) the auction’s outcomes: the stop-outprice, and the quantity served to each bidder. In addition, although our sample does not enable to identify any individual participant, it speci…es whether a bidder belongs to the class of large or small …nancial institutions. Summary statistics describing the auctions in our sample may be found in Table 1. Participation in French Treasury auctions appears to be dominated by smaller …nancial institutions (14.6 small banks versus 4.5 large banks). Although the number of bidders within groups may vary, the average number of participants (roughly 19) is rather stable across auctions and lines. As expected, the yield and maturity of the OAT are signi…cantly larger than the BTAN’s (respectively 5.5% and 16 years for the OAT, versus 4.1% and nearly 3.5 years for the BTAN). The average volume of securities o¤ered to competitive bidders (around 1,560 million Euros) may vary markedly from one auction to the next. This volatility may be only partially explained by non-competitive bids which represent on average slightly less than 3% of the total quantity supplied. Although in the minority, large banks received a larger share of the security (63.8% on average). This result is consistent with the fact that, on average, large banks submit higher prices for the initial units demanded (101.193 versus 100.922 for small banks), and pay slightly more per unit awarded (101.185 versus 100.180).27 According with economic intuition, we also …nd a strong negative correlation between the average price paid and the quantity supplied by the Treasury. Interestingly, there is also a negative correlation between the quantity supplied, and the share awarded to large banks. In other words, small banks receive a greater percentage of the securities issued in large auctions. Note also that the stop-out-price is slightly, but not signi…cantly smaller for BTAN (99.804) than for OAT (102.476). Finally, the revenue generated by the French Treasury during the period sampled (187 Billion Euros) may be almost equally divided between the auctions for BTAN and OAT, 26 As previously mentioned, and following most of the structural literature on auctions, participation at a French Treasury auction is assumed to be exogenous and common knowledge. The common knowledge assumption may be partially justi…ed by the fact that a bidder’s participation may be inferred from its activity on the primary market, as well as from pre-auction communications, which are prevalent according to French Treasury auctions specialists. 27 To remain consistent with the French Treasury auctions practices, prices are expressed as a percentage of one euro. In other words, when we mention a price of 101.193, it actually corresponds to a true price of 1.01193 euros.
15
and it essentially originates from the contribution of large banks (roughly 63%). The number of di¤erent bids submitted by a large (small) bank was 4.67 (3.43) on average per auction. These statistics do not necessarily imply that participants did not spread their bids across di¤erent prices. Indeed, if we concentrate on the price range for quantities actually allocated to a bidder (i.e. between the stop-outprice and the highest price submitted by the bidder), large (small) banks placed a non-zero bid for 4.16 (1.78) out of the 5.66 (2.07) possible prices in that range In other words, bidders appear to take advantage of the multi-unit nature of the auction over the price range that truly matters.
6. Model Speci…cation 6.1. Speci…cation of the Constrained Strategies In practice, we de…ne the family of constrained strategies H (k) for bidders in group l = 1; 2 as the two-dimensional polynomials of highest degree k: (k) 'i;l
(p; si;l ; dl ) = 'i;l If'i;l >0g where 'i;l = dl (0)
j k X X
dl (m) (e si;l )(j
0
j)
(e p)j
0
;
j=1 j 0 =0
(10) m = j (j + 1)=2 + j 0 , pe = p ( V 4 V ), sei;l = si;l ( V 4 V ), and ( V ; V ) are the mean and the standard deviation of the true value. To be more speci…c, the French Treasury auction model will be estimated in a subsequent section with the constrained equilibrium CSE(2), derived within H (2) , the set of constrained polynomial strategies of highest degree two:28 'i;l = dl (0) + dl (1)
1 + dl (2) pe + dl (3) sei;l
1 sei;l
2
+ dl (4)
pe + dl (5) pe2 sei;l
: (11)
To evaluate the approximation quality of the CSE(2), the convergence criterion C1 de…ned in appendix 1 will be calculated with two alternative constrained equilibria, the CSE(1) and the CSE(3), derived in the constrained sets H (1) and H (3) .29 28
In fact, a distinct CSE(2) will be calculated for each auction in our sample, as the exogenous variables, such as the number of each type of bidders or the expected value of the security, vary from one auction to the next. 29 Recall that the other convergence criteria introduced in appendix 1 do not depend on an additional constrained strategy other than the CSE itself. In particular C2 and C3 rely on the unconstrained best-response to the CSE(2).
16
As we shall see, the di¤erent convergence criteria will be used to establish that the CSE(2) provides an excellent approximation, and that the use of a higher order polynomial is not necessary. At this point four remarks are in order. First, in practice, the standardization of the prices and private signals (p; si;l ) into (e p; sei;l ) is necessary in order for the constrained bid function (11) to be non-linear. Indeed, the bid function (11) would otherwise be essentially linear for any parameter value dl , since the variables si;l and p are de…ned in the French Treasury auctions over very small intervals roughly centered around 100. Second, although non-negativity constraints on bids are implicit in Wang and Zender (2002), numerical simulations of their model suggest that the probability of demanding negative equilibrium quantities is far from negligible for a wide range of parameter values. To avoid such undesirable outcomes at any step of our numerical algorithm, we explicitly impose non-negative quantities. Third, although we impose dl (t) > 0 for all t (which (k) (k) implies @'i;l ( ) =@p < 0, and @'i;l ( ) =@si;l > 0) to speed up computation, we …nd ex-post that these constraints are non-binding at the equilibrium. The CSE is therefore strictly monotonic in prices and signals which is an essential attribute to conduct a structural estimation. Fourth, to facilitate convergence at any step of the approximation algorithm, we only consider parameters for the constrained strategies such that i) the bidders’ average pro…ts are non negative, and ii) the stop-out-price systematically falls within the range of prices actually observed in the French Treasury auction for which the CSE is calculated. Once again, these constraints are found to be non-binding at the equilibrium, but they considerably reduce computational time. We now brie‡y motivate the choice of the family of constrained strategies in (10), over alternative candidates. First, when k = 1 the CSE is consistent with uniform-price auction examples in Wilson (1979), and Fevrier et al. (2002). Second, the constrained strategies are bounded above when the private signals become large, which, in our experience, is a crucial property to derive e¢ ciently the CSE numerically. Third, as illustrated in AFR (2005b), polynomial CSEs performed remarkably well to approximate accurately the equilibrium strategies derived analytically in speci…c examples of symmetric uniform-price auctions by (e.g.) Wilson (1979), Fevrier et al. (2002), and Wang and Zender (2002). Fourth, it outperformed several alternative speci…cations (e.g., other polynomial or piecewise linear functions with a similar number of parameters) both in terms of approximation quality, and computational time. In addition, the family of constrained strategies de…ned in (11) has adequate 17
properties to address in practice the questions of the CSE existence, uniqueness, and its relevance as an approximation. Indeed, to apply AFR approximation theorem one must show that the family of constrained sets is dense in the set of possible strategies. In the present context, if the (unconstrained) bid functions may be assumed to be continuous in (p; si;l ), and (p; si;l ) have compact supports bounded away from zero, then the generalization of the Weierstrass approximation theorem to functions of two variables guarantees that any (unconstrained) bid function may be approximated with arbitrary precision by a polynomial strategy of the form (11). In other words, the selected family of constrained sets is dense in the set of possible strategies, which implies that any BNE of the game may be approximated by a sequence of CSEs. Moreover, the existence of a CSE is established numerically in practice, by applying theorems and algorithms developed in interval analysis for the solution of nonlinear systems in the presence of computing rounding errors. In particular, if a nonlinear system of equations F (x) = 0, F : Rp ! Rp , is Lipschitz continuous, then the application of the Krawczyk operator enables one to construct a box within which the existence and uniqueness of a solution may be formally veri…ed numerically (see Neumaier 1990 and Kearfott 1996). Therefore, the existence and the uniqueness of a CSE in H (k) may be veri…ed by applying such an algorithm to the set of …rst order conditions (9), in the neighborhood of an approximate solution derived numerically.30 The uniqueness result, however, is only local. In other words, as is often the case in games of incomplete information, we cannot formally prove the global uniqueness of a CSE.31 However, we were able to construct a box, centered on the approximated solution dCSE = (d1;CSE ; d2;CSE ), and with bounds [0; 2dCSE ], within which the uniqueness of the CSE was formally established after applying the Krawczyk operator.32 In addition, the CSE was re-calculated 106 time with an 30 The GLOBSOL project (http://www.mscs.mu.edu/~globsol/) maintains a list of Fortran subroutines based on interval arithmetic to solve optimization problems and non-linear system of equations. 31 To facilitate the presentation, the discussion that follows concentrates on the uniqueness of a CSE and a BNE in a speci…c model. Recall however that the characteristics of the model, and therefore the CSE calculated, are distinct for each auction in our sample, as the exogenous variables di¤er. In other words, the calculations described below to address the question of uniqueness, were in fact (successfully) repeated for each auction in our sample. 32 The fact that the uniqueness could not be established for some CSEs in wider boxes does not necessarily implies that the solution is not unique, but rather that the uniqueness test was inconclusive.
18
independent and random selection of starting values, and all solutions converged (in quadratic norm) toward the same CSE up to an " = 10 12 . This result therefore strongly suggests that the CSE calculated is indeed unique within a range of reasonable strategies. n o (k) Finally, the sequence of CSEs 'CSE in H (1) to H (5) was also calculated k=1;:::;5
106 time with an independent and random selection of starting values. As further explained in section (8.2), each of the 106 sequences converged toward the same BNE up to an " = 10 11 .33 This result therefore strongly suggests that, there is no other (well-behaved) BNE in addition to the equilibrium we approximated. To reinforce this result, we also conducted the approximation with a di¤erent family of e (k) of piecewise-linear strateconstrained strategies. Namely, we consider the set H gies with k equidistant breaking points (see AFR 2005b). Due to computational n o (k) e (1) to H e (7) was only calculated 104 time, the sequence of CSEs ' e CSE in H k=1;:::;7
time with an independent and random selection of starting values. Once again, we …nd that each of these 104 sequences converged toward the same BNE up to an " = 10 10 . In addition, the largest di¤erence (in quadratic norm) between the e (7) is " = 4:8 10 7 .34 In other words, whether we use a polynoCSEs in H (5) and H mial or a piecewise-linear family, the approximation method still converges toward the same BNE, thereby reinforcing the presumption that this approximated BNE is unique. However, if the game happened to possess additional equilibria, then the previous calculations show that the BNE approximated may nevertheless be considered as a strong, sensible attractor. Under these circumstances, it may be reasonably assumed, when we estimate the structural model, that agents have coordinated on the BNE we approximated. 33
This result contrasts sharply with similar calculations we originally conducted under the assumption that the quantity supplied to competitive bidders is deterministic and common knowledge. Indeed, in this case the sequences of CSEs would either not converged, or they would converged toward di¤erent BNEs. The introduction of random supply is therefore not only empirically relevant, but, as suggested by (e.g.) Wang and Zender (2002), it also appears to eliminate multiple equilibria. 34 As illsutrated in AFR (2005b), convergence is slower and more computationally demanding with piecewise-linear strategies. This partially explained why the polynomial family was preferred for the structural estimation.
19
6.2. Speci…cation of the Econometric Model Before we turn to the speci…cation of the structural model, we must estimate the distribution of Qt , the quantity actually supplied at auction t to competitive bidders. We assume that Qt is exogenously determined by the following relationship Qt =
+ 1 M eanBrackett + 2 SpreadBrackett + ; 3 M aturityt + 4 Y ieldt + 5 T ypet + t 0
(12)
where M eanBrackett = (Qt + Qt )=2, SpreadBrackett = (Qt Qt )=2, Qt and Qt are the upper and lower bounds of the quantity bracket announced by the French Treasury before auction t, and t is an identically and independently normally distributed error term with mean zero and variance 2 .35 The results of the regression presented in Table 2 indicate that the quantity supplied, cannot be explained solely by the bracket announced by the auctioneer. Indeed, the characteristics of the security for sale (i.e., the maturity, yield and type) appear to have a non-negligible impact on the quantity o¤ered to competitive bidders. Since the parameter associated with the spread of the quantity bracket is not signi…cantly di¤erent from zero, we re-estimated the model without this variable (see Table 2). The estimated parameters now fully characterize the probability distribution of the quantity supplied to competitive bidders. In the remainder, it is assumed that bidders know this distribution of Qt when they derive their equilibrium strategy. As discussed further, the model may only be identi…ed parametrically. Therefore, to complete the econometric speci…cation, we assume that Vt , the true value of the security at auction t, is normally distributed with mean Vt = 2 0 + 1 Y ieldt + 2 M aturityt + 3 T ypet , and variance V . The conditional dist tribution of si;l , the private signal at auction t of bidder i in group l (l = 1; 2), is assumed to be a normal with mean Vt and variance 2l .36 Note that the assumption that the variables Q, V , and si;l are normally distributed is partially supported by the graphs of the variables respective (estimated) values. Moreover, unlike Fevrier et al. (2002) and Castellanos and Oviedo (2002) who adopted a 35
On rare occasions, the French Treasury is known to supply a quantity slightly larger than Qt . Consequently, we leave the distribution of Qt unbounded. 36 To guarantee that a sequence of CSE approximates an equilibrium we have previously assumed that the support of the private signals is compact. To remain consistent with this assumption, we can truncate the distribution of the private types far in the tail. Therefore, when approximating a CSE, we only consider signals within 5 standard deviations around their mean. This type of truncation was adopted by (e.g.) AFR (2001) and Eklöf (2003), and it is inconsequential for the econometric estimation.
20
exponential distribution, the private signals are symmetrically distributed around the true value, which appears to be a natural assumption.
7. Estimation of the Structural Model The literature on the structural estimation of auction models may be roughly divided in two branches: a …rst branch consists of estimators relying on the …rst order conditions of the problem (e.g. Guerre et al. 2000, Fevrier et al. 2002, Hortaçsu 2002a); while a second branch encompasses di¤erent estimators based on the actual BNE strategy (e.g. Paarsch 1992, Donald and Paarsch 1993 and 1996, Florens et al. 2002). In our Treasury auction model, the presence of random quantities and two forms of asymmetries (in distribution and in risk aversion) is such that the …rst order conditions characterizing the BNE yield a complex set of Euler equations. It is unclear in this context how one can devise an estimator based on this set of Euler equations. In particular, the method developed by Fevrier et al. (2002) for symmetric Treasury auctions with risk neutral bidders and deterministic quantities does not trivially generalize to the present model.37 Instead, we adopt the second approach, and construct an estimator based on the BNE approximated by the CSE technique. In addition, following Paarsch (1992), Donald and Paarsch (1993, 1996), La¤ont et al. (1995), as well as Fevrier et al. (2002), we adopt a parametric approach. The objective of the inference method presented here, is therefore to estimate the unknown structural parameter = ( ; 1 ; 2 ; 1 ; 2 ), where = ( 0 ; 1 ; 2 ; 3 ; V ) characterizes the distribution of the true value of the security. To do so, we apply the method of simulated moments (MSM) as originally introduced by McFadden (1989), and Pakes and Pollard (1989). Consider the identically and independently distributed sequence of observaj;t j;t tions qi;l ; Zlj;t , where qi;l is the endogenous variable representing the quantity 37
The methods based on the …rst order conditions are typically carried out in two steps: the distribution of (a function of) the bids is estimated non-parametrically in step one, and this estimator is used in step two to recover the structural parameters. The quality of the structural parameters’estimates therefore depends crucially on the precision of the non-parametric estimation in step 1. The di¤erent such non-parametric estimations we experimented with our data (e.g. for the distribution of the bids, or the probability of winning) were invariably of poor quality due the relatively large number (i.e. nine, including four discrete variables) of somewhat volatile exogenous variables in our model. As a result, even if a method based on the …rst order conditions was implementable, one may wonder whether it would be reasonably accurate in our application.
21
demanded at price pj (j = 1; :::; Jt ) by bidder i (i = 1; :::; Nl;t ) in group l (l = 1; 2) at auction t (t = 1; :::; T ), and Zlj;t = (1; pj ; zlt ) is a 11 1 vector of exogenous variables, in which zlt accounts for some of the characteristics of group l and of auction t.38 j;t The observed bid qi;l is assumed to be determined, up to an error term, by the CSE(k) bid function derived at auction t:39 (k)
j;t qi;l = 'l;CSE pj ; sti;l + ! j;t i;l
;
(13)
where sti;l is the private signal of bidder i in group l at auction t, and ! j;t i;l is an j;t j;t identically and independently distributed error term satisfying E ! i;l jZl = 0. The error term may be interpreted as a combination of two exogenous factors: measurement errors due to the fact that bidding is only permitted in practice on a grid of prices, and approximation errors due to the use of a CSE instead of the BNE. As we shall see however, the error term ! j;t i;l is tightly distributed around zero, thereby indicating that the model estimated with the approximated equilibrium …ts the data well. Note also that the addition of the error term ! j;t i;l to any (constrained or unconstrained) equilibrium bid function is necessary to estimate the multi-unit auction model structurally. Indeed, the common-value model assumes that a bidder receives a unique private signal about the true value of the good. In single-unit auctions with monotonic strategies, the inversion of the equilibrium bid function for any observed bids systematically results in a unique private signal. In multiunit auctions however, one may not necessarily …nd a unique private signal to rationalize the multiple bids submitted by the same bidder. In other words, the inversion of an equilibrium bid function at each of the observed bids submitted by a bidder at all possible prices may yield di¤erent private signals, thereby contradicting the model’s assumptions. The error term ! j;t i;l therefore enables to reconcile the di¤erent bids submitted by a bidder with the assumption that she receives a unique private signal. 0
38
In practice, we consider zlt = Y ieldt ; M aturityt ; T ypet ; N1;t ; N2;t ; Qt ; Qt ; QN CBt ; Largel where Largel is a dummy variable equal to 1 when l = 1 (i.e. when the bank belongs to the group of large …nancial institutions), and QN CBt is the percentage of the total quantity supplied demanded by non-competitive bidders at auction t. 39 It is important to understand that our structural approach still assumes that bidders in French Treasury auctions are actually behaving according to the BNE, not the CSE. The CSE is only used as an approximation for the intractable BNE.
22
Zlj;t ;
h
(k) 'l;CSE
pj ; sti;l
Zlj;t
i
Let us denote h = E j the expected quantity demanded at price pj by a bidder in group l during auction t, conditionally on the vector of exogenous variables Zlj;t . We can then generate a set of moment conditions of the form: j;t E Zlj;t qi;l
h Zlj;t ;
(14)
=0 :
The generalized method of moments estimator is based on the empirical counterpart of the previous orthogonality conditions: X j;t j;t bGM M = Arg min [A0 A] where A = Zl qi;l h Zlj;t ; , (15) 2
t;j;l;i
and is a 11 11 symmetric, positive de…nite matrix that may be chosen in order to minimize the variance of the estimator. Note that this model is over-identi…ed, as there are eleven moment conditions to estimate a parameter of dimension nine. In the present context, the generalized method of moments estimator is not directly implementable since the expectations h Zlj;t ; cannot be derived analytically. Following the MSM technique, as reviewed by Carasco and Florens (2002), we propose replacing h Zlj;t ; by a Monte Carlo approximation hM C Zlj;t ; = M PC (k) 1 'l;CSE pj ; seti;l (m) , where M C is the size of the Monte Carlo simulation, MC m=1
and seti;l (m) is a simulated private signal randomly generated (using the common random number technique) from the distribution f : j ; Zlj;t . Gourieroux and Monfort (1995) show that the MSM estimator is strongly consistent and asymptotically normal when M C is …xed. In addition, they show that the optimal matrix , which minimizes the variance of the estimator, is given by (
)
1
j;t = V ar Zlj;t qi;l h Zlj;t ; + h 1 (k) V ar Zlj;t 'l;CSE pj ; seti;l (m) MC
h Zlj;t ;
i
(16) :
However, cannot be derived directly as it depends on the unknown distribution. Following Gourieroux and Monfort (1995), is replaced by a sequence of consistent estimators: 2 3 j;t j;t b B q ; Z ; X 2 r 0 1 i;l l 1 j;t b r+1 5 , (17) = Zlj;t Zlj;t 4B1 qi;l ; Zlj;t ; br + M t;l;j;i MC 23
where
"
j;t j;t B1 qi;l ; Zlj;t ; br = qi;l
#2
,
(18)
#2 MC 1 X2 (k) t ' pj ; si;l (m) , B2 = (1) M C2 m=1 l;CSE (19) M is the sample size, seti;l (1) is the …rst element of the sequence seti;l (m) m=1;:::;M C , sti;l (m) m=1;:::;M C is a new sequence of M C2 simulated signals randomly and j;t qi;l ; Zlj;t ; br
"
MC 1 X2 (k) ' pj ; sti;l (m) M C2 m=1 l;CSE
(k) 'l;CSE
pj ; seti;l
2
independently generated from the distribution f : j br ; Zlj;t ; br (8r 1) is the MSM estimator of calculated with the weighting matrix b r 1 , and b 0 is the identity matrix. In practice we set r = 2, M C = 106 and M C2 = 108 . Note that unlike Fevrier et al. (2002), we take full advantage of each observation (i.e., all price-quantity pairs submitted by all winning and non-winning bidders), rather than only the quantities submitted at the stop-out-price by the winning bidders.40 More precisely, not only do we take into considerations every price at which a bid is submitted (i.e., the points at which an observed (step) demand function strictly decreases), but we also account in the estimation process for all possible prices for which a bidder did not require an additional share (i.e., the prices at which a demand function remains ‡at). This latter set of data points should not be ignored, as it also contains information about the bidders’strategy. Indeed, such observations indicate that at a given price the bidder did not wish to modify the quantity she demanded. As is often the case with structural models, the global identi…cation of the model is far from trivial to establish nonparametrically. In fact, we were only able to derive a numerical procedure that allows us to con…rm that our model is locally identi…ed around the parameters estimated in the subsequent section (see appendix 2).41 As suggested by Athey and Haile (2002), as well as Campo, Guerre, Perrigne and Vuong (2002), this identi…cation result, although not trivial to understand intuitively, may be explained by the fact that we exploit the observed 40
The sample used in our estimation method consists of 40,496 observations, while it would have been reduced to 1,158 observations had we taken into account only the quantities observed at the stop-out-price. 41 Although parametric assumptions are necessary to identify the model, experiments with alternative types’distributions and families of constrained strategies indicate that the identi…cation of the model is not contingent on the normality assumption, nor the polynomial structure of the strategies.
24
heterogeneity between the auctions in our sample. In particular, the fact that we can observe in each auction whether a bidder belongs to the group of larger or smaller …nancial institutions is a key identifying feature of our sample. Indeed, it enables in particular to infer the private signals’distribution for each type of banks. Moreover, we are able to disentangle the risk aversion and information asymmetries from the variation in the number of each type of bidders from one auction to the next. Indeed, since the private values’distributions are independent of the number of bidders, the changes in behavior observed in the data when N1 and N2 vary allow us to capture the risk aversion parameters. Note however that the sample is not rich enough to test some of the hypotheses on which the structural model was built, such as (e.g.) the common-value assumption.
8. Estimation Results 8.1. Estimated Structural Parameters The value of the estimated parameters are presented in Table 3. In order to evaluate the …t of the model, the outcomes observed for each auction in our sample are compared with 106 Monte Carlo simulations generated with the estimated parameters. The results of these simulations are summarized in Table 4. Let us concentrate …rst on the parameters ( k ; V ) characterizing the mean and standard deviation of the value of a security. As expected, 1 is signi…cantly greater than zero, re‡ecting the fact that the value of a security increases (on average) with its yield. Table 3, also indicates that long term securities are on average slightly less valuable to bidders ( 2 < 0). Note, however, that after controlling for the maturity, and according with opinions expressed by French Treasury specialists, we do not …nd any evidence indicating that the value of the two types of short and long term securities di¤ers signi…cantly (i.e., 3 is insigni…cant). When we impose the restriction 3 = 0, we …nd that the values of the estimated parameters vary only slightly (see Table 3). In the remainder, we only rely on this new set of signi…cant structural parameters when conducting Monte Carlo simulations. The average value of a security in our sample is evaluated at 101.772, 0.610 above the average stop-out-price (see Table 4). The estimated di¤erence between the true value and the stop-out-price is signi…cantly smaller than the one found by Fevrier et al. (2002) (i.e. 1.85). Recall, however, that Fevrier et al. studied the French Treasury auctions over a di¤erent period (1995), and that the sample they use is substantially smaller. Finally, note that the true value of a security conditional 25
on the exogenous variables is somewhat variable, since the standard deviation V is estimated at 0.632 (Table 3).42 We now turn to the estimation of the standard deviations of private signals. Table 3 indicates that small banks receive noisier signals (i.e., 2 > 1 ). To test for informational symmetry (i.e., 2 = 1 ) we adopt the extension to the general method of moment framework of the Wald test (see e.g., Newey and West 1987). The Wald statistic is 113.291, which corresponds to a P-value of 2.665E-4. In other words, we can reject the hypothesis that participants to the French Treasury auctions have access to equally accurate sources of information regarding the value of the security for sale. Nothing indicates, however, whether the informational advantage of large banks is due to better market research, inferences from the ‡ow of pre-auction orders submitted to large banks by their own customers (as suggested by Bikchandani and Huang 1993), or informal pre-auction communications (as suggested by Nandi 1997 and Hortaçsu 2002a). Finally, Table 3 also indicates that the CARA parameter of small banks is more than one hundred time larger.43 The CARA speci…cation however, does not include risk neutrality as a special case. Therefore, we must adopt a nonnested approach to test whether bidders are risk neutral. Following Singleton (1985), we create a more general structural model nesting as special cases both Treasury auction models under the CARA (model M1) and risk neutrality (model M2) assumptions.44 The implementation of the test however, only requires to re-estimate the model under the risk neutrality assumption. The outcomes of this estimation are reported in the last column of Table 3. Observe that although the parameters remain of comparable magnitude, the estimated standard deviations of the private signals (i.e., 1 and 2 ) are signi…cantly larger when risk neutrality is imposed. In addition, the risk neutral model does not appear to track the data as well, since ! j;t i;l is signi…cantly more volatile. To formalize this observation, we now turn to the outcome of the speci…cation test. We …nd that the statistic 42
The standard deviation of the true value and the standard deviation of the privates signals are not explicitly given in Fevrier et al. (2002). Therefore, we have not been able to compare our estimates with theirs. 43 The estimated absolute risk aversion parameters may appear rather low, if not compared to the pro…ts of the bidders. Indeed, the relative risk aversion levels range between 0.02 and 0.9 when calculated with the pro…ts only. These …gures, although still low since they do not include the actual wealth of the participants, appear however more reasonable. 44 The risk neutral model is derived and approximated along the same lines as the CARA model, except that bidders maximize their expected pro…ts in equation (3), instead of their expected utility in equation (4).
26
associated with the test of M1 against M2 (respectively M2 against M1) is 1.789 (9.180), which corresponds to a P-value of 0.181 (2.446E-3). Therefore, we are lead to conclude in favor of the presence of risk aversion. We also performed a test similar to the one previously conducted to verify informational symmetry, in order to test for the equality of the risk aversion parameters between the two groups of bidders (i.e., 2 = 1 ). The test statistic is 24.406, which corresponds to a P-value of 7.803E-7. In other words, we can reject the hypothesis that both types of bidders have comparable level of risk aversion. These results, however, are not su¢ cient to compare bidders in terms of relative risk aversion. Indeed, small and large banks typically have di¤erent levels of wealth. Individual data on the participants’ wealth were not accessible to us. However, the simulations conducted in Table 4 indicate that the average pro…ts per auction of a small and a large bank are respectively around 0.14 and 1.27 million Euros. Therefore, if it may be assumed, as a simpli…cation, that a bank’s wealth is roughly proportional to its pro…ts in the French Treasury auctions, then small banks’relative level of risk aversion is 13.3 time larger. In other words, the estimation of the structural parameters con…rms that large …nancial institutions possess better information, and are willing to take more risks. It is interesting to note that the informational and risk aversion asymmetries have unequal consequences on the auction outcomes in general, and the Treasury revenues in particular. Indeed, if small banks were to receive private signals generated from the same distribution as their larger counterparts, then, all things being equal otherwise, this would raise the Treasury’s revenue by 12%, while the average pro…ts of a large (small) bank would decrease (increase) by 21% (8%).45 Alternatively, if small banks had the same CARA parameter as large banks (but still receive noisier information), then the Treasury’s revenue would barely change (+3%), while the small (large) banks’ pro…ts would only increase (decrease) by 3% (7%). In other words, bene…ts to the French Treasury would be non-negligible if participants had access to similar sources of information. This result may be of importance, since, unlike risk aversion, policy makers may be able to curb down the informational asymmetry. Indeed, it may be possible, for instance, to regulate pre-auction communications, which is often believed to be one of the principal sources of informational asymmetry. Table 4 also indicates, as previously mentioned, that large and small banks 45
The unequal e¤ect of a reduction of the informational asymmetry on small and large banks may be explained by the fact that the security is now allocated to a larger number of small banks.
27
expected pro…ts are roughly 1.27 and 0.14 million Euros per auction.46 These …gures, however, do not include any research or administrative costs typically incurred while participating in Treasury auctions. Finally, it is important to note that large banks appear to be facing a non-negligible winner’s curse problem.47 Indeed, the share of securities awarded to a large bank, who is using a more aggressive equilibrium strategy, is bought at an average price exceeding the true value of the security 8.5% of the time. In sharp contrast, small banks, which behave more prudently, are a¤ected by the winner’s curse for only 1% of the shares they received. Finally, an assessment of how well the structural model estimated with the approximated equilibrium …ts the data may be obtained by looking at the distribution of ! j;t i;l , the error term from which the moment conditions have been derived. Table 3 indicates that, as expected, the estimated mean of ! j;t i;l is not signi…cantly j;t di¤erent from zero. In addition, the standard deviation of ! i;l is 7.365E-3, which is modest in comparison with the average range of bids submitted during an auction by the bidders in our sample (i.e. 0.368). The estimated parameters are therefore such that the bids predicted by our approximated equilibrium are tightly distributed around the actual bids observed in our sample. This also con…rms that the continuous polynomial bid functions adopted to estimate the structural model …t reasonably well the step function strategies actually used by the bidders in the French Treasury auctions. An additional measure of …t is provided in Table 4 where the outcomes of the Monte Carlo simulations are summarized. A comparison with Table 1 suggests that the estimated model is sensible, as it replicates fairly well the outcomes observed in our sample of French Treasury auctions. For instance, the simulated stop-out-price, the average price paid by unit, the highest price at which a positive quantity was demanded, the repartition of the security between each type of banks, and the revenue generated by the Treasury, are very similar in Tables 1 and 4. In 46
This result is consistent with Umlauf (1993) who found that large bidders earn signi…cantly larger pro…ts in Mexican Treasury bill auctions. 47 The winner’s curse is often loosely de…ned as the state in which a winning bidder realizes that the price he paid exceeds the value of the object he was awarded (see e.g. Krishna 2002). Under this de…nition, rational bidders are not fully immunized against the winner’s curse, as it stems from incomplete information, and not necessarily judgemental failures. An alternative and somewhat more formal de…nition, states that the winner’s curse occurs when bidding above the expected value of the item conditional on having the high signal (see e.g. Kagel and Levine 1986). Under this de…nition, a bidder can never face the winner’s curse when rational and risk neutral. In the present paper, we adopt the …rst de…nition.
28
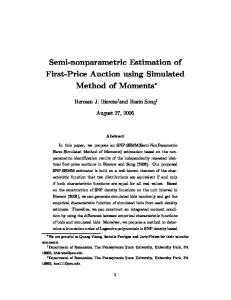
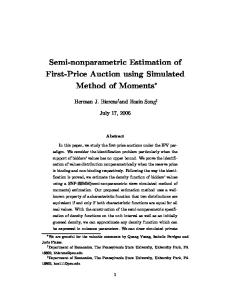
addition, the negative correlations observed in the sample between the quantity of security issued on one hand, and the average price paid or the share allocated to large banks on the other hand, are also identi…ed with our simulated model. 8.2. Approximated Equilibrium Although apparently sensible, the quality of the previous results is crucially contingent on the fact that the CSEs considered for the estimation of the structural model are accurate approximations of the equilibrium in each Treasury auction in our sample. Therefore, we now turn to the evaluation of the CSE(2), its theoretical properties, and the di¤erent convergence criteria. The parameters of a CSE(2), derived for both types of players and speci…c values of the exogenous variables, are reported in Table 5. The corresponding bid functions are illustrated by the solid lines in Graph 1, and the in‡uence of the private signals on the bids submitted may be appreciated in Graph 2. Finally, the convergence criteria may be found in Table 6.48 Graph 1 con…rms that small banks behave more prudently. Indeed, the demand functions submitted by small banks are not only shifted downward, but they are also slightly ‡atter than the demand functions of their larger counterparts. In other words, small banks systematically ask fewer shares at any possible price, and they are not willing to pay as much to obtain an additional unit of the security. Monte Carlo simulations suggest that the di¤erences between the bid functions of each group of players cannot be imputed solely to either the information or the risk-aversion asymmetry. In fact, the shape of the strategies appears to be almost equally in‡uenced by the two sources of asymmetry. Graph 2 indicates that private signals have a signi…cant impact on the bid functions.49 For instance, in comparison with the average private signal of 101.772, private signals of 101.807 and 101.912 (the mean of the private signals plus 0.5 and 2 standard deviations), yield a large bank a share approximately 10% and 30% larger on average. Although the demand functions in Graph 1 appear essentially linear, the equilibrium parameters in Table 5 indicate that the approximated BNE is a non-linear 48 The convergence criteria reported in Table 6 are aggregated across both types of players. These criteria, however, do not di¤er signi…cantly when calculated separately with the group of small or large …nancial institutions. 49 The relative impact of private signals on the demand function submitted by both types of players is roughly similar. Therefore, we only report in Graph 2 the e¤ect of private signals on the strategy of large banks.
29
function of both prices and private signals (i.e., d (4) and d (5) are di¤erent than 0). This observation is con…rmed by the convergence criterion C3 in Table 6, which indicates that any player has a strong incentive (especially in absolute terms given the large amounts of money involved in Treasury auctions) to deviate by selecting an unconstrained strategy when her opponents play the linear constrained equilibrium CSE(1). Indeed, criterion C3 indicates that when her opponents use the CSE(1), a bidder can increase her pro…ts by 6.3% by using an unconstrained best-response strategy.50 The convergence criteria in Table 6 indicate that the CSE(2) is an excellent approximation of the equilibrium since i) it almost perfectly matches its unconstrained best-response (criterion C2 ); ii) a bidder has no signi…cant incentive to deviate from the CSE(2) by selecting an unconstrained strategy as it would only increase her pro…ts by at most 0.05% (criterion C3 );51 and the CSE(2) is in fact a BNE in a game with an almost identical distribution (criterion C4 ). Criterion C4 also con…rms that the speci…cation error due to the use of the approximated equilibrium CSE(2) instead of the actual BNE did not signi…cantly a¤ect the estimation of the structural parameters of the model in Table 3. Note also that although a higher order polynomial considerably increases computational time, it does not improve signi…cantly the quality of the approximation. Indeed, the convergence criteria in Table 6 are only marginally better for the CSE(3) compared to the CSE(2). This result is consistent with our experience with other auction models. Indeed, as illustrated in AFR (2005b), although analytically complex and often intractable, BNE in auction models are typically well behaved monotonic functions that may be approximated accurately by a low order polynomials or piecewise-linear functions. In other words, the CSE(2) adopted for the estimation of the structural model, provides a parsimonious, yet sensible approximation. An alternative approach to assess the pertinence of the approximated equilibrium is to verify whether its properties are consistent with theoretical results established analytically in the symmetric case.52 In accordance with Ausubel and 50
In fact, if a small (respectively, large) bank best-responds with a quadratic constrained strategy belonging to H (2) to its opponents who all use the linear constrained equilibrium CSE(1), then this player would increase its pro…ts by 5.70% (respectively 5.93%) on average. In other words, bidders have a strong incentive in this situation to shift from a linear, to a non-linear strategy belonging to H (2) . 51 Best responding to the CSE(2) by a step bid function yields a pro…t 0.02% lower. This therefore con…rms again that continuous polynomial strategies provide a reasonable …t to the step bid function actually used by the bidders in the French Treasury auctions. 52 Failure to be consistent with symmetric models does not necessarily invalidate our asymmet-
30
Cramton (2002), and Wang and Zender (2002), we …nd that in our asymmetric model i) both types of bidders shade their bids relative to their marginal valuation of the security; ii) the intensity of a player’s bid shading increases with his risk aversion and private signal; iii) equilibrium bid schedules, as well as the seller’s expected revenue, increase with the number of participants (of any group), and the expected value of the security, but they decrease with the bidder’s level of risk aversion and the variance of the true value; and iv) the probability of the winner’s curse is not zero, it increases with the variance of the true value and the number of participants, while it decreases with the bidder’s parameter of risk aversion. In other words, the CSE(2) also appears to be sensible in the sense that it shares its main properties with known symmetric equilibria. Finally, to test the validity of the model we can also verify that the CSE approximations obtained in section 8.1 are reasonably close to their corresponding “objective best responses”, where an objective best response is de…ned as the strategy a bidder should use knowing the actual distribution of his opponents’bids.53 To determine each bidder objective best response, we …rst need to estimate Gl (RS j Z), the cumulative distribution of the residual supply available to a bidder in group l = 1; 2 as a function of the exogenous variables 0 Z = p; Y ield; M aturity; T ype; N1 ; N2 ; Q; Q; QN CB .54 To mitigate partially the curse of dimensionality, we model the cumulative distribution of the residual supply as a single-index problem Gl (: j a Z), where a is a 1 9 vector of parameters estimated with the semiparametric maximum likelihood approach developed by Ai (1997). We can then derive the objective best response for each type of participants and each auction in our sample by solving a single agent problem under uncertainty, in which a representative bidder i in group l must determine his utility maximizing demand schedule 'BR i;l (p; si;l ) while facing a random residual supply bl (:). To implement the method, we parametrize the with cumulative distribution G objective best response strategy as in (11), and we calculate the parameter dBR l yielding the highest expected utility for bidders in group l. A 105 Monte Carlo simulation of each auction in our sample indicates that the di¤erence between the objective best response 'BR p; si;l ; dBR , and the corresponding CSE calcui;l l ric model, since properties from symmetric models do not systematically extend to asymmetric models. 53 We would like to thank the editor and the referees for suggesting this approach. 54 The residual supply available to a bidder at a given price is derived by subtracting the quantity actually demanded at that price by the other bidders, from the quantity available to competitive bidders in that auction.
31
(2)
lated with the parameter we estimated in the previous section 'l;CSE pj ; sti;l is respectively 6.35% and 8.29% for small and large banks. Although moderately accurate, these results may be considered acceptable when one takes into consideration the relatively poor quality of the semiparametric estimation of the residual supply distributions, which may be traced to the large number of exogenous variables involved (i.e nine, including four discrete variables).55
9. Discriminatory Versus Uniform-Price Formats Using the structural parameters estimated in the previous section (i.e. third column in Table 3), we now approximate with a CSE(2) what would have been the bidders equilibrium behavior, had the French Treasury conducted the auctions in our sample with a uniform pricing rule. The parameters of a CSE(2) in the uniform-price auctions are presented in Table 7, and the corresponding equilibrium bid schedules are plotted in Graph 1 (dotted line). Then, using these approximated equilibria, a Monte Carlo simulation has been conducted to compare the auctions outcomes in the uniform-price format (Table 9), with those previously found in the discriminatory format (Table 4).56 Note that when comparing the two pricing rules, we implicitly assume that the variables considered exogenous, such as the quantity available to competitive bidders or the number of competitive bidders, remain una¤ected after switching to a di¤erent auction format. This assumption may be questioned since participation and/or non-competitive bids could be expected to di¤er between a discriminatory and uniform-price auction. However, to the best of our knowledge, the di¤erent empirical analyses conducted after natural experiments did not …nd any conclusive evidence suggesting that a pricing rule signi…cantly a¤ects the variables that have been assumed exogenous in the present paper. This result may be partially explained by the fact that the number of participants, and the number of banks 55
Note that this test was signi…cantly easier to carry out than the structural estimation in section 7, since i) we only had to solve an optimization problem to derive the “objective best response” (not a an optimization problem combined with a …xed point problem as with the CSE), and ii) we were not interested in recovering the primitives of the model. 56 The Monte Carlo simulation relies on the common random number technique. In other words, Tables 4 and 9 are constructed with the same exogenous variables and pseudo-random private signals, and therefore, they can be directly compared. In addition, the standard deviations in Tables 4 and 9 are calculated across simulations, and across auctions in our sample. In other words, these standard deviations should not be confused for a measure of the accuracy of an estimate, as typically presented along the results of a regression.
32
allowed to submit non-competitive bids, are typically inelastic in the short term. Indeed, in French Treasury auctions, bidders must …rst pre-qualify by receiving an accreditation from the government. Before describing the equilibrium behavior in the uniform-price auction, let us point out that the approximated equilibrium bid function CSE(2) is once again remarkably precise, as indicated by the convergence criteria in Table 8. In addition, the approximated equilibrium in the uniform-price auction appears sensible, as its properties are consistent with Ausubel and Cramton (2002), and with a comparable symmetric example in Wang and Zender (2002). For instance, we …nd that i) both types of bidders shade their bids; ii) the intensity of bid shading falls compared to the discriminatory case; iii) bid shading diminishes with added competition (from any group), iv) reducing the severity of the winner’s curse through information revelation about the true value and/or the amount of non-competitive bidding, increases the seller’s expected revenue; v) the seller’s expected revenue increases with the average value of a security, and the number of competitive bidders (from any group), while it decreases with risk aversion, and the variance of the true value; vi) …nally, the demand of a bidder is strictly positive when the signal and the price are simultaneously equal to the average (2) true value of the security (i.e., 'l;CSE (pj ; si;l ) > 0 when si;l = pj = V ). To understand the di¤erence between equilibrium behavior under each auction format, it is important to remember that a fundamental characteristic of uniformprice auctions is that bidders do not pay their bid for each unit they receive. Instead, a winning bidder pays a single price, the stop-out-price, for every unit she is allocated. As a result, bidders are inclined to announce higher prices than at discriminatory auctions, for the …rst units demanded. Indeed, strategic bidders realize that the stop-out-price they will have to pay will be lower than the price they announce for these initial shares. This intuition is con…rmed in Table 9 and Graph 1. Indeed, the highest prices at which bidders demand a strictly positive share is lower for both types of bidders under the discriminatory format (101.204 and 100.945 for large and small banks, versus 101.449 and 101.325 in uniform-price auctions). To compensate for the high prices submitted for the initial units, we can also see in Graph 1 that the demand functions are ‡atter in the uniform-price auction (dotted lines), in order to keep the stop-out-price as low as possible. As expected however, the stop-out-price is always higher in the uniform-price auction. Interestingly, the average stop-out-price in the uniform-price auction lays between the average price paid in the discriminatory format by large and small winning banks. 33
Note also that a shift from the discriminatory to the uniform-price format leads small banks to take relatively more risk compared to their larger counterparts. Indeed, Graph 1 shows that the demand function of small banks shifts upward, and is only marginally ‡atter in the uniform-price format. In other words, knowing that they will not have to pay the price they announced, small banks are willing to buy larger amounts of the security at any relevant price. The bid function of large banks, on the other hand, pivots and becomes signi…cantly ‡atter. As a result, large banks are willing to pay more than in a discriminatory auction for small quantities, but they do not wish to spend as much to obtain a large share of the security. According to our model, these strategy adjustments on the part of both types of bidders when switching to the uniform-price format imply: i) the percentage of the security awarded to small banks is signi…cantly higher (55% versus 37% in the discriminatory format); ii) a larger number of small banks is likely to be awarded a share of the security; and iii) the increase in the share allocated to small banks is relatively higher at auctions with low quantities issued by the Treasury. In other words, the negative correlation between the quantity supplied and the share allocated to large banks is reduced under the uniform-price format. These theoretical predictions are consistent with the empirical observations in Malvey and Archibald (1998) who report that the average share awarded to the top …ve and top ten dealers declined by about 10% to 17% after the US Treasury shifted to the uniform pricing rule. The combined e¤ect of the uniform-price auction on the stop-out-price and the allocation process, has in turn surprising consequences in terms of the banks’ utility, and the Treasury’s revenue. Indeed, Table 9 indicates that the expected utilities of both types of banks, and the revenue of the Treasury would simultaneously increase under the uniform-price format. This result may be explained by the combination of two factors. First, a comparison of Tables 4 and 9 indicates that the uniform-price format signi…cantly reduces the variance of the pro…ts for both types of bidders.57 This reduction in pro…ts’volatility is such that the expected utility of small banks, who are relatively more risk averse, increases on average under the uniform pricing rule, even though their expected pro…ts are 57
This reduction may be essentially explained by a decline, under the uniform-price format, of the negative correlation between the quantity supplied by the Treasury on one hand, and both the average price paid and the share allocated to large banks on the other hand. In other words, under the uniform pricing rule, banks (regardless of type) receive more uniform shares and pay more uniform prices independently of the quantity of security issued.
34
actually 2.8% lower (on average). The expected utility of large banks increases as well in the uniform-price auction, since not only their pro…ts volatility diminishes, but also their expected pro…ts rise following a sharp reduction of the winner’s curse problem (from 8.5% to 0.7% of the shares allocated).58 Second, as previously mentioned, a comparison of Tables 4 and 9 indicates that the average stop-out-price in the uniform-price auction (101.184) is larger than the average price paid by small banks (101.179), but only slightly smaller than the average price paid by large banks (101.186) under the discriminatory format. As a result, the average price paid by a bank (regardless of type) for a unit of the security is larger under the uniform-price format. This implies that the revenue raised by the French Treasury during our sample period would have been higher under the uniform-price format. The uniform-price format therefore appears do dominate the discriminatory format in French Treasury auctions, both from the Treasury’s perspective, but also from a social welfare perspective. Although the Treasury’s revenue increase is modest in relative terms (4.8%), it is quite consequent in absolute terms. Indeed, we estimate that the French Treasury would have accumulated an additional 9 billion Euros during our sample period, had it used a uniform-price auction. Our simulations however, suggest a potential drawback associated with the uniform pricing rule. Indeed, the standard deviations of the per-auction Treasury revenues in Tables 4 and 9 indicate that the revenue raised by the Treasury is signi…cantly more variable from one auction to the next under the uniform-price format.59 In other words, although the Treasury revenue is higher under the uniform-price format, the precise amount of money an auction will generate becomes less predictable. Under these circumstances, it may be more di¢ cult for the French government to use the uniform-price Treasury auction as an e¢ cient short-term tool to manage its public debt.60 Our results are therefore consistent with the reduced-form analysis conducted by Malvey and Archibald (1998) after the US Treasury decided to experience with the uniform pricing rule. Indeed, the authors found: i) the revenue of the Treasury increased slightly in relative terms, but not signi…cantly; and ii) the revenue 58 Unlike Castellanos and Oviedo (2002), the reduction of the winner’s curse alone cannot explain why the uniform-price auction generates higher revenues for the French Treasury. 59 This increase in the variability of the Treasury revenue under the uniform-price format may be explained by the reduction of the negative correlation between the revenues generated by the French Treasury during an auction from the large and small banks. 60 Our simulations actually suggest that the revenue of the French Treasury would be larger at 66.8% of the auctions in our sample, if they were conducted with the uniform pricing rule instead of the discriminatory format.
35
raised by the US Treasury became more variable from one auction to the next. Moreover, our simulations illustrate why most reduced-form analyses conducted after natural experiments have failed to produce an unambiguous ranking of auction mechanisms. Indeed, we …nd that the uniform pricing rule would only result in a relatively marginal increase in revenue, while simultaneously generating more variable outcomes. In such a noisy environment, it may be di¢ cult to identify such a small revenue di¤erence with a reduced-form analysis. The task may be rendered even more di¢ cult with …eld data, as they might be polluted by other sources of noise generated by time e¤ects, variations in the values of the exogenous variables, or players adjusting to the new environment. As mentioned in the introduction, our results are context speci…c, and they may not extend directly beyond the French Treasury experience. Indeed, Monte Carlo simulations suggest that alternative values of the structural parameters may yield di¤erent conclusions. In particular, like Fevrier et al. (2002), we …nd that the discriminatory format would generate higher revenues for the Treasury than the uniform-price auction if bidders were symmetric, risk neutral and small banks received private signals drawn from the same distribution as their larger counterparts. Our results however, appear to be robust in the context of the French Treasury auctions, since the conclusion holds in a neighborhood of the estimated parameters.61 Monte Carlo simulations also indicate that similar conclusions may be obtainable under a single source of either risk aversion or informational asymmetry. In the case of the French Treasury auction, however, it appears that, given the estimated values of the structural parameters, both informational and risk aversion asymmetries are necessary.
10. Conclusion The purpose of this paper was to test whether bidders in French Treasury auctions are symmetric, and to determine which of the discriminatory or uniform-price format is the most appropriate in this context. To address these questions, we generalized the share auction model with supply uncertainty of Wang and Zender (2002) to account for informational and risk aversion asymmetries. The structural estimation of the model suggests that participants in French Treasury auctions 61
More precisely, given our parameter estimates, we are able to construct the following 95% con…dence intervals for the gains of the di¤erent parties after shifting to the uniform-price format: revenue gains for the French Treasury [2:761%; 7:328%], utility gains for large banks [2:887%; 9:841%], utility gains for small banks [4:708%; 8:617%].
36
may be divided in two distinct groups, di¤erentiated by their level of risk aversion, and the quality of their information about the value of the security to be sold. A counter-factual analysis also indicates that, under our model’s hypotheses, both the French Treasury and the auctions’ participants would have bene…ted, if the auctions in our sample had been conducted under the uniform-price format instead of the discriminatory format. This result contrasts with a previous structural analysis conducted in France under the symmetry and risk neutrality assumptions. Indeed, Fevrier et al. (2002) …nd that discriminatory auctions increase the revenue of the French Treasury. Failure to account for potential risk aversion and asymmetries in Treasury auctions, may therefore have serious consequences, as it may lead to conclude in favor of the incorrect auction format. Moreover, although speci…c to the French Treasury, our analysis may be considered of general interest. Indeed, just like in France, most Treasury auctions around the world seem to involve asymmetric bidders, and are conducted with the discriminatory format. Our results suggest that in such context, the determination of the best pricing rule crucially depends on the underlying structural parameters of the model. The theoretic and econometric methodology developed in the present paper could therefore be applied to other Treasury auctions to test in each individual case which auction mechanism appears to be the most advantageous to the auctioneer. To conclude, it is interesting to note that the spirit of our results is somewhat consistent with the basic intuition in Friedman (1960). Indeed, Friedman suggested that the uniform-price format was preferable as it may provide an incentive to small and/or uniformed bidders to participate. Although participation is considered to be fully exogenous in our model, we …nd that shifting to the uniform-price format may incite less informed and more risk averse participants to behave more aggressively. As it turns out, this increased competition may bene…t not only the Treasury, but also the auctions’participants.
11. References Ai C. 1997. A Semiparametric Maximum Likelihood Estimator. Econometrica, 65, 4, 933-963. Anton JJ, Yao DA. 1992. Coordination in Split-Award Auctions. Quarterly Journal of Economics, 107.2. Armantier O, Florens JP, Richard JF. 1998. Equilibre Approximatif et Règle In-
37
tuitive : une Application aux Appels d’O¤res dans l’Industrie Spatiale. Economie et Prévision, 1.2., 179-190. Armantier O, Florens JP, Richard JF. 2001. Nash Equilibrium Approximation in Games of Incomplete Information. Working Paper, SUNY Stony Brook, available at http://www.sunysb.edu/economics/research/jour_wp.html. Armantier O, Florens JP, Richard JF. 2005a. Approximation of Bayesian Nash Equilibria. Working Paper, Universite de Montreal, available at http://www.sceco.umontreal.ca /liste_personnel/armantier/. Armantier O, Florens JP, Richard JF. 2005b. Constrained Strategic Equilibrium: Numerical Aspects. Working Paper, Universite de Montreal. Athey S, Haile P. 2002. Identi…cation in Standard Auction Models. Econometrica, 70 (6), 2107-2140. Ausubel LM, Cramton P. 2002. Demand Reduction and Ine¢ ciency in Multi-Unit Auctions. Working Paper, University of Maryland. Back K, Zender J. 1993. Auctions of Divisible Goods: On the Rationale for the Treasury Experiment. Review of Financial Studies, 6, 733-764. Back K, Zender J. 2001. Auctions of Divisible Goods with endogenous supply. Economics Letters, 73, 29-34. Berg SA, Boukai B, Landsberger M. 1999. Bid Functions for Treasury Securities; Across Countries Comparison. Working Paper, Haifa University. Bjonnes GH. 2001. Bidder Behavior in Uniform Price Auctions: Evidence from Norwegian Treasury Bond Auctions. Working Paper, Norvegian School of Management. Bikhchandani S, Huang C. 1993. The Economics of Treasury Security Markets. Journal of Economic Perspectives, 7, 117-134. Campo S, Guerre E, Perrigne I, Vuong Q. 2002. Semiparametric Estimation of First-Price Auctions with Risk Averse Bidders. Working Paper, University of Southern California. Castellanos S, Oviedo M. 2002. Optimal Bidding in the Mexican Treasury Securities Primary Auctions: A Structural Econometrics Approach. Working Paper, Yale University. Carasco M, Florens JP. 2002. Simulation Based Method of Moments and E¢ ciency. Journal of Business & Economic Statistics, special issue for the 20th Anniversary of GMM, Vol. 20, No. 4, 482-492. Das S, Sundaram R. 1996. Auction Theory: A Summary with Applications and Evidence from the Treasury Markets. Financial Markets, Institutions and Instruments, v5(5), 1-36. Donald S, Paarsch H. 1993. Piecewise Pseudo-Maximum Likelihood Estimation in
38
Empirical Models of Auctions. International Economic Review, 34, 121–148. Donald S, Paarsch H. 1996. Identi…cation, Estimation and Testing in Parametric Empirical Models of Auctions within the IPV. Econometric Theory, 12, 517-567. Eklöf M. 2003. Assessing Social Costs of Ine¢ cient Procurement Design. Working Paper. Fevrier P, Preguet R, Visser M. 2002. Econometrics of Share Auctions. Working Paper, CREST, Paris. Florens JP, Protopopescu C, Richard JF. 2002. Inference in a Class of Game Theoretic Models. Working Paper, University of Pittsburgh. Florens JP, Sbaï E. 2002. Identi…cation in Empirical Games. Working Paper, GREMAQ, University of Toulouse. Friedman M. 1960. A Program for Monetary Stability. New York, NY : Fordham University Press. Gourieroux C, Monfort A. 1995. Simulation Based Econometric Methods. Louvain, CORE Lectures Series; Oxford Univ. Press. Guerre E, Perrigne I, Vuong Q. 2000. Optimal Nonparametric Estimation of FirstPrice Auctions. Econometrica, 68, 525-574. Hortaçsu A. 2002a. Mechanism Choice and Strategic Bidding in Divisible Good Auctions: An Empirical Analysis of the Turkish Treasury Auction Market. Working Paper, Stanford University. Hortaçsu A. 2002b. Bidding Behavior in Divisible Good Auctions: Theory and Evidence from the Turkish Treasury Auction Market. Working Paper, Stanford University. Jegadeesh N. 1993. Treasury Auction Bids and the Salomon Squeeze. Journal of Finance, vol. 48, 1403-19. Judd K. 1998. Numerical Method in Economics. MIT Press, Cambridge Mass. Kagel JH, Levin D. 1986. Winner’s Curse and Public Information in Common Value Auctions. American Economic Review, Vol. 76. Kearfott RB. 1996. Rigorous Global Search: Continuous Problems. Kluwer, Dordrecht. Klemperer P. 2000. The Economic Theory of Auctions. (ed.), Edward Elgar (pub.), Cheltenhaum, UK. Klemperer P, Meyer M. 1989. Supply Function Equilibria in Oligopoly under Uncertainty. Econometrica, 57(6), 1243-77. Krishna V. 2002. Auction Theory. Academic Press. La¤ont JJ, Ossard O, Vuong Q. 1995. Econometrics of First Price Auctions. Econometrica, 63, No. 4, 953-980.
39
McFadden D. 1989. A Method of Simulated Moments for Estimation of Discrete Response Models without Numerical Integration. Econometrica, 57, 995-1026. Malvey PF, Archibald CF. 1998. Uniform-Price Auctions: Update of the Treasury Experience. U.S. Treasury. Mester LJ. 1995. There’s More than One Way to Sell a Security: The Treasury’s Auction Experiment. Federal Reserve Bank of Philadelphia Business Review, July/August, p.3-17. Nandi S. 1997. Treasury Auctions : What Do the Recent Models and Results Tell Us? Federal Reserve Bank of Atlanta Economic Review, Fourth Quarter. Neumaier A. 1990. Interval Methods for Systems of Equations. Cambridge University Press, Cambridge. Newey WK, West K. 1987. Hypotheses Testing with E¢ cient Method of Moments Testing. International Economic Review, 28: 777-787. Nyborg KG, Sundaresan S. 1996. Discriminatory versus Uniform Treasury Auctions: Evidence from When-Issued Transactions. Journal of Financial Economics, Vol 42:1, 63-105. Paarsch H. 1992. Deciding between the Common and Private Value Paradigms in Empirical Models of Auctions. Journal of Econometrics, 51, 191–215. Pakes A, Pollard D. 1989. Simulation and the Asymptotics of Optimization Estimators. Econometrica, 57, 1027-1057. Simon D. 1994. The Treasury’s Experiment with Single-Price Auctions in the Mid 1970’s: Winner’s or Taxpayer’s curse? Review of Economics and Statistics, 76, 754-760. Singleton K. 1985. Testing Speci…cations of Economic Agents’ Intertemporal Optimum Problems in the Presence of Alternative Models. Journal of Econometrics, 30, 391-413. Tenorio R. 1993. Revenue Equivalence and Bidding Behavior in a Multi-Unit Auction Market: An Empirical Analysis. The Review of Economics and Statistics, Vol. 75, No. 2., 302-314. Umlauf S. 1993. An Empirical Study of the Mexican Treasury bill Auctions. Journal of Financial Economics, 33, 313-40. Viswanathan S, Wang J. 2000. Auctions with When-Issued Trading : A Model of the US Treasury Markets. Working Paper, Duke University. Viswanathan S, Wang J, Witelski T. 2002. Optimal Bidding in Multi-Unit Discriminatory Auctions: Two Bidders. Working Paper, Duke University. Wang J, Zender J. 2002. Auctioning Divisible Goods. Economic Theory, vol. 19, 673-705. Wilson R. 1979. Auctions of Shares. The Quarterly Journal of Economics, 93,
40
675-689.
12. Appendix 1: Constrained Strategic Equilibrium The object of this appendix is to present the CSE concept developped by Armantier, Florens and Richard (2005a) (AFR hereafter). In addition, we will propose several criteria to evaluate the CSE approximation quality, and illustrate the accuracy of the approximation method through di¤erent examples. We start by placing ourself within the general framework of a game of incomplete information. There are N players, each endowed with a privately known signal i 2 i , where i Rp . The signals = ( 1 ; :::; N ) are drawn from a joint distribution with cumulative distribution function F ( ). After observing their own signal, players select simultaneously an action xi 2 Xi , where Xi denotes the set of possible actions player i can take. Players are endowed with individual Von Neuman-Morgenstern utility functions Ui (x; ), where x = (x1 ; :::; xN ). A strategy pro…le ' = ('1 ; :::; 'N ), where ' 2 H and H =
N Q
Hi is the set of possible
i=1
strategies, is de…ned by N measurable functions transforming signals into actions
'i i
: i ! Xi ! xi = 'i ( i ) ;
i = 1; :::; N
(12.1)
:
The number of players N , the joint distribution F , the utility functions fUi gi=1;:::N , and the sets of strategies fHi gi=1;:::N are assumed to be common knowledge. The de…nition of a CSE parallels that of a BNE in strategic form, except that strate(k) Hi , where k is a scalar to be de…ned below. A gies are restricted to subsets Hi CSE in the set of constrained strategies H (k) = (k)
mentation of the game 'CSE =
N Q
(k)
Hi
i=1 (k) (k) '1;CSE ; :::; 'N;CSE
(k)
is therefore a strategic imple(k)
with 'CSE 2 H (k) , whereby the
'i;CSE ’s are mutually best responses in the strategic form game ei '(k) ; '(k) U i;CSE i;CSE
ei '(k) ; '(k) U i i;CSE
(k)
8'i
(k)
2 Hi ; 8i = 1; :::; N
; (12.2)
ei (') = E [Ui (' ( ) ; )]. The CSE may also be expressed as a …xed point where U solution of the constrained best response correspondence ei ' ; ' 'i;CSE 2 Arg maxU i (k)
(k)
(k) (k) 'i 2Hi
41
(k) i;CSE
8i = 1; :::; N
:
(12.3)
(k)
The determination of this …xed point is greatly simpli…ed when the strategies in Hi are parametrized by a vector of dimension k . This approach provides a major computational advantage, since it requires to optimize over a …nite set of parameters rather than an in…nite set of functions as it is the case with the BNE. AFR determine conditions for the existence of a CSE. The authors also show in a broad class of games of incomplete information, that if the family of constrained sets H (k) k=1;:::;1 is such that i) H (k) H (k+1) and ii) [ H (k) is dense in H , then any k 1 n o (k) sequence of CSEs 'CSE approximates a BNE of the game. In addition, if k=1;:::;1 n o (k) (k) 'CSE constitutes a convergent sequence, and 'CSE is the unique CSE in k=1;:::;1
H
(k)
(8k > 0), then the sequence of CSEs converges toward the unique BNE of the game. Finally, AFR propose a powerful algorithm, based on Monte Carlo simulations, to derive the CSE numerically at a high level of generality. Moreover, AFR propose four criteria to evaluate in practice the quality of the CSE approximation, and to decide when to stop the numerical approximation procedure consisting in calculating a CSE in expanding constrained sets H (k) .62 The …rst criterion is similar to traditional approximation stopping rules, as it veri…es whether the sequence of CSEs converges: C1 (k) = pares the CSE to
(k)
'CSE
(k+1)
8t > 0. The next two criteria com-
'CSE
(k)
BR
'CSE , its best response in the unconstrained set of strategies (k)
(k)
H , both in terms of distance C2 (k) = 'CSE
BR
'CSE
, and expected util-
e ' e .63 In particular, C3 (k) close U ity C3 (k) = U BR 'CSE ; 'CSE CSE to zero indicates that players have virtually no incentive to deviate from the CSE to adopt a more elaborated (unconstrained) strategy. Finally, the CSE is reinterpreted in the fourth criterion as an actual BNE in a perturbed game, in which private signals are generated from a distribution F'(k) rather than the actual distribution F . The CSE approximation quality is then evaluated by the distance between the original and the (k)
(k)
perturbed game, as measured by C4 (k) = F
(k)
F'(k)
. Note that when the distri-
CSE
62
See AFR for details related to the evaluation of these criteria with Monte Carlo simulations in practical applications. (k) (k) 63 More precisely, BR 'CSE is a vector of dimension N , such that BR;i 'CSE is the best response of player i (i = 1; :::; N ) in the unconstrained set of strategy Hi , (k) when his opponents use the CSE 'CSE; i . Moreover, the ith component of vector (k) (k) (k) (k) e ei ;' is in fact U ;' : U BR ' BR;i ' CSE
CSE
CSE
42
CSE; i
bution F is estimated, the criterion C4 (k) also provides some information about the speci…cation error due to the use in the structural econometric model of the approxima(k) tion 'CSE instead of the actual BNE. Indeed, C4 (k) su¢ ciently close to zero indicates that the speci…cation error is marginal, since a consistent estimation of F'(k) with the CSE
(k)
correctly speci…ed structural model (i.e., using the corresponding BNE 'CSE ), would have yielded an estimate essentially similar to the original distribution F .
13. Appendix 2: Identi…cation of the Model To address the issue of the model’s identi…cation, we built on the general procedure proposed by Florens and Sbaï (2002) for auction models with risk averse bidders. The procedure is based on the local identi…cation principle. Before we de…ne this notion more precisely, let us recall that the parameters of interest are the vectors = ( 0 ; 1 ; 2 ; 3 ; V ) which characterizes the distribution of the true value of the security, ( 1 ; 2 ) the variances of the bidders’private signals, and = ( 1 ; 2 ) the risk aversion parameters. Let us also denote = ( ; 1 ; 2 ).
De…nition 13.1. The parameters ( ; ) and ( ; (( ; ) ( ; )) i¤ G = G , where G = F ';
) are observationally equivalent 1 1 are ' ; and G = F the c.d.f. of the observed actions of a representative player, and ' ; ; ' ; belong
to the set of admissible strategies.
De…nition 13.2. The parameters ( ; ) 2 R9 are locally identi…ed i¤ there exists a neighborhood V( ; ) of ( ; ) in R9 such that 8( ;
) 2 V( ; ); ( ;
Lemma 13.3. ( ;
)
( ; ) =) ( ;
)=( ; ) :
(20)
) is observationally equivalent to ( ; ) i¤ F
G '
;
=0 :
The proof is trivial: if ( ; ) ( ; ) then G = G , and F = G ' ; G ' ; . Conversely, equation (21) implies G = G from the de…nition of G .
(21) =
The next theorem is an adaptation of a result in Florens and Sbaï (2002) to our model.
43
Theorem 13.4. The asymmetric model '1; ; '2; ; ; , where 'l ; is a strategy function for players in group l = 1; 2, is locally identi…ed if the operator ( ) 2 X @sl F ; T ; = @( ; ) F :@( ; ) 'l (22) @sl 'l ; l=1 is one to one 8 ( ; ) 2 R9 , where F is the joint distribution of (s1 ; s2 ) a pair of signals of a representative player in each group. Proof: Consider the application
A : R9 R9 ! R )] 7 ! A (( ; ) ; ( ; )) = F
[( ; ) ; ( ; ;
(23) G '
;
;
1
;
where ' ; = '1 ; '2 , and G = F '; is the c.d.f. of the observed pair of actions of a representative players of each group. Note that A (( ; ) ; ( ; )) = 0. It follows from the implicit function theorem that, if the di¤erential of A ( ) w.r.t. ( ; ) is injective at (( ; ) ; ( ; )), then there exists a neighborhood V( ; ) of ( ; ) such that ( ; ) = ( ; ) is the unique solution to the equation A (( ; ) ; ( ; )) = 0 for ( ; ) 2 V( ; ). In this case, it follows from Lemma 13:1 that ( ; ) is locally identi…ed. The di¤erential of A ( ) w.r.t. ( ; ) evaluated at (( ; ) ; ( ; )) is characterized by the operator
@(
; )F
@(
; )
G '
;
= @(
; )F
@(
which may also be written
@(
; )F
2 X
@' ; G '1; ; '2; l
; )
h
G
:@(
'1;
; ) 'l
;
; '2;
i
(24)
;
(25)
:
l=1
Moreover, we know that G @sl F and
;
'
= F , which implies that @sl 'l ; :@' ; G ' l
@' ; G ' l
;
=
@sl F @sl 'l ;
:
;
= (26)
Note that the CSEs are fully de…ned by a parameter dl which may be expressed as ; a function of ( ; ). Therefore, 'l , the strategy function of players in group l, may
44
be written as 'dl( invertible:
T
; )
;
. Then, our model will be identi…ed if the following operator is
= @(
; )F
2 X l=1
(
@sl F @sl 'dl(
:@(
; ) 'dl ( ; )
; )
)
(27)
:
Since the distributions and strategies belong to known parametric families, we can easily derive @sl F , @( ; ) F and @sl 'dl( ; ) . The derivation of @( ; ) 'dl ( ; ) , however is usually not as straightforward, since dl ( ; ) is typically an implicit function of ( ; ). As suggested in Florens and Sbaï (2002), we can derive @( ; ) 'dl ( ; ) in this situation by applying the Implicit Function Theorem to the …rst order conditions de…ning the CSE. Following Florens and Sbaï (2002), we …nd that
@(
; ) 'd( ; )
= @(
; ) 'd1 ( ; ) ; @( ; ) 'd2 ( ; )
0
= @d 'd(
; ) :@( ; ) d (
; )
(28)
;
where
@(
; )d (
; )=
@d
@d1 U~1 (d1 ; d2 ; ; @d2 U~2 (d1 ; d2 ; ;
1) 2)
1
:@(
; )
@d1 U~1 (d1 ; d2 ; ; @d2 U~2 (d1 ; d2 ; ;
1) 2)
(29) @d21 U~1 (d1 ; d2 ; ; 1 ) @d2 @d1 U~1 (d1 ; d2 ; ; 1 ) = @d1 @d2 U~2 (d1 ; d2 ; ; 2 ) @d22 U~2 (d1 ; d2 ; ; 2 ) h i ~ ~ :@( ; ) @d1 U1 (d1 ; d2 ; ; 1 ) ; @d2 U2 (d1 ; d2 ; ; 2 ) :
1
(30)
Since the expected utility is a known parametric function, the derivatives in the previous expression may be calculated without di¢ culty in most practical applications. Once, @( ; ) 'dl ( ; ) has been determined, we can then verify whether the operator T ; is invertible.
45
Table 1 Summary Statistics (Average per auction unless mentioned otherwise)
Number of auctions Total Number of Competitive Bidders
Large Banks Small Banks
Yield Maturity (in days) Quantity Supplied (in Million Euros) Non Competitive Bids (in Million Euros) Stop-Out-Price♣ Average Price Paid Large Banks Per Unit Purchased♣ Small Banks Share Awarded to Total Large Banks (in %) Per Bank Share Awarded to Total Small Banks (in %) Per Bank Probability that a Small Bank is Awarded a Share of the Security Highest Price Submitted♣
Large Banks Small Banks
Per Auction Revenue for Treasury
Total From Large Banks (Million Euros) From Small Banks Total Revenue for Treasury During the Sample Period ♣
Total 118 19.025 (0.797) 4.508 (1.443) 14.568 (1.536) 4.826 (1.186) 3,541.627 (3,462.798) 1,559.500 (959.273) 44.122 (59.100) 101.163 (6.975) 101.185 (5.985) 101.180 (12.482) 0.638 (0.006) 0.167 (0.121) 0.362 (0.007) 0.024 (0.042)
OAT 60 18.983 (0.871) 4.800 (1.542) 14.217 (1.603) 5.492 (1.191) 5,746.683 (3,391.702) 1,535.544 (1,044.719) 47.640 (63.302) 102.476 (8.898) 102.508 (6.130) 102.501 (11.310) 0.645 (0.006) 0.168 (0.096) 0.355 (0.008) 0.024 (0.048)
BTAN 58 19.069 (0.686) 4.207 (1.237) 14.931 (1.366) 4.138 (0.679) 1,260.534 (570.006) 1,584.283 (816.756) 40.611 (57.610) 99.804 (3.738) 99.816 (3.401) 99.813 (3.774) 0.625 (0.005) 0.166 (0.098) 0.375 (0.006) 0.025 (0.041)
0.643
0.645
0.640
101.193 (6.700) 100.922 (11.032) 1,582.619 (664.794) 989.652 (424.910) 592.967 (293.821)
102.519 (8.227) 102.360 (13.295) 1,579.370 (535.822) 994.441 (384.113) 584.929 (285.573)
99.821 (2.403) 99.419 (3.206) 1,585.981 (473.006) 984.697 (441.201) 601.283 (298.933)
186,749.153
94,762.249
91,986.904
Prices are expressed as a percentage of one Euro. Standard deviations are in parenthesis.
Table 2 Quantity Supplied to Competitive Bidders Parameter Estimates
α0
α1
(Constant)
(MeanBracket)
1381.547* (376.208) 1426.927* (351.162)
0.674* (0.106) 0.681* (0.092)
α2 (SpreadBracket)
-0.268 (0.860) .
α3
α4
α5
συ
(Maturity)
(Yield)
(Type)
-0.201* (0.029) -0.193* (0.032)
-353.198* (61.214) -376.245* (55.007)
1184.680* (186.789) 1208.732* (182.404)
492.941* (98.143) 475.207* (96.651)
Number of Observations: 118 * Indicates parameters significant at a 5% significance level. Standard deviations are in parenthesis.
Table 3 Structural Parameter Estimates Parameter δ0
Model with Risk Aversion 80.783* 81.165* (14.721) (14.913) (Constant) 4.822* 4.782* δ1 (Yield) (1.726) (1.697) -7.219E-4* -7.223E-4* δ2 (Maturity) (2.308E-5) (2.160E-5) -0.592 δ3 __ (2.851) (Type) 0.630* 0.632* σV (0.010) (0.010) (Standard Deviation of True Values) 0.071* 0.070* σ1 (Standard Deviation of Large Banks Private Signals) (0.023) (0.021) 0.172* 0.178* σ2 (Standard Deviation of Small Banks Private Signals) (0.058) (0.063) 7.615E-8* 5.732E-8* λ1 (CARA Parameter for Large Banks) (7.604E-9) (4.908E-9) 8.774E-5* 6.907E-6* λ2 (CARA Parameter for Small Banks) (2.580E-7) (1.401E-7) 2.034E-4 5.731E-4 E ωi j,l,t (5.558E-3) (3.237E-3) (Mean of the error term) 4.215E-3* 7.365E-3* Std ωi j,l,t (1.623E-3) (9.842E-4) (Standard Deviation of the error term) Number of Observations: 40,496
[ ]
[ ]
* Indicates parameters significant at a 5% significance level. Standard deviations are in parenthesis.
Risk Neutral Model 87.622* (10.756) 5.460* (1.983) -8.616E-4* (7.809E-5) -0.321 (2.444) 0.605* (0.023) 0.112* (0.047) 0.256* (0.080) __ __ 8.152E-4 (8.638E-3) 8.970E-3* (2.068E-3)
R2 0.769 0.765
Table 4 Simulation of Discriminatory Treasury Auctions (Average per auction unless mentioned otherwise)
True Value Stop-Out-Price♣ Average Price Paid Large Banks Per Unit Purchased♣ Small Banks Share Awarded to Total Large Banks (in %) Per Bank Share Awarded to Total Small Banks (in %) Per Bank Probability that a Small Bank is Awarded a Share of the Security Highest Price Submitted♣
Large Banks Small Banks
Profit Per Bank
Large Banks
(Million Euros)
Small Banks
Expected Utility
Large Banks Small Banks
Percentage of Issue Awarded Subject to the Winner’s Curse Per Auction Revenue For Treasury
Large Banks Small Banks
Total From Large Banks (Million Euros) From Small Banks Total Revenue for Treasury During the Sample Period ♣
Total 101.772 101.162 (6.981) 101.186 (6.037) 101.179 (13.546) 0.631 (0.005) 0.163 (0.129) 0.369 (0.007) 0.028 (0.046)
OAT 103.125 102.474 (9.325) 102.508 (5.878) 102.501 (10.871) 0.636 (0.006) 0.165 (0.104) 0.364 (0.008) 0.027 (0.051)
BTAN 100.381 99.805 (3.848) 99.818 (3.769) 99.812 (3.976) 0.624 (0.004) 0.164 (0.136) 0.376 (0.005) 0.025 (0.039)
0.642 101.204 (6.725) 100.945 (11.131) 1.267 (0.631) 0.141 (0.125) -0.943 (0.013) -0.468 (0.023) 0.085 (0.091) 0.010 (0.004) 1,583.601 (594.126) 882.175 (451.730) 701.426 (372.631)
0.646 102.520 (8.239) 102.340 (13.108) 1.328 (0.716) 0.156 (0.132) -0.939 (0.013) -0.437 (0.022) 0.083 (0.099) 0.009 (0.05) 1,581.641 (553.246) 883.431 (416.526) 698.210 (343.202)
0.639 99.831 (2.386) 99.444 (3.180) 1.215 (0.582) 0.128 (0.116) -0.945 (0.014) -0.485 (0.024) 0.086 (0.087) 0.012 (0.004) 1,585.629 (603.007) 880.803 (449.642) 704.826 (398.155)
186,864.942
94,898.461
91,966.481
Prices are expressed as a percentage of one Euro. Standard deviations are in parenthesis.
Table 5 Parameters of the CSE Bid Function Discriminatory Auction (N1=5, N2=15, other exogenous variables are taken at their means)
Large Banks 9.033E-1 -1.133E-1 -1.184E-1 -1.204E-1 -8.397E-2 -6.211E-1
d(0) d(1) d(2) d(3) d(4) d(5)
Small Banks 4.521E-1 -5.534E-2 -1.621E-1 -5.087E-2 -5.945E-3 -5.381E-1
Table 6 Convergence Criteria Discriminatory Auction (N1=5, N2=15, other exogenous variables are taken at their means)
Criteria
Alternative CSE(1) . 1.656E-3 6.328 2.307E-2
C1 C2 C3 (in %) C4
CSE(2) Used in Estimation 9.871E-3 2.012E-5 0.052 7.365E-5
Alternative CSE(3) 4.725E-6 8.377E-6 0.050 5.952E-5
Table 7 Parameters of the CSE Bid Function Uniform-Price Auction (N1=5, N2=15, other exogenous variables are taken at their means)
Large Banks 7.300E-1 -8.074E-2 -8.467E-5 -9.087E-2 -2.648E-4 -6.836E-1
d(0) d(1) d(2) d(3) d(4) d(5)
Small Banks 6.358E-1 -6.309E-2 -3.592E-2 -8.856E-2 -7.091E-3 -5.798E-1
Table 8 Convergence Criteria Uniform-Price Auction (N1=5, N2=15, other exogenous variables are taken at their means)
Criteria C1 C2 C3 (in %) C4
Alternative CSE(1) . 4.638E-4 6.351 6.377E-3
CSE(2) Used in Simulations 2.096E-2 7.826E-6 0.043 1.326E-5
Alternative CSE(3) 1.028E-6 4.914-6 0.038 9.794E-6
Table 9 Simulation of Uniform-Price Treasury Auctions (Average per auction unless mentioned otherwise)
True Value Stop-Out-Price♣ Share Awarded to Total Large Banks (in %) Per Bank Share Awarded to Total Small Banks (in %) Per Bank Probability that a Small Bank is Awarded a Share of the Security Highest Price Submitted♣
Large Banks Small Banks
Profit Per Bank
Large Banks
(Million Euros)
Small Banks
Expected Utility
Large Banks Small Banks
Percentage of Issue Awarded Subject to the Winner’s Curse Per Auction Revenue For Treasury
Large Banks Small Banks Total
From Large Banks (Million Euros) From Small Banks Total Revenue for Treasury During the Sampling Period ♣
Total 101.772 101.184 (7.782) 0.447 (0.018) 0.100 (0.116) 0.553 (0.003) 0.032 (0.031)
OAT 103.125 102.506 (10.633) 0.449 (0.019) 0.102 (0.106) 0.550 (0.003) 0.029 (0.030)
BTAN 100.381 99.817 (4.420) 0.443 (0.016) 0.097 (0.128) 0.557 (0.003) 0.033 (0.033)
0.946 101.449 (10.571) 101.325 (15.039) 1.322 (0.311) 0.137 (0.047) -0.902 (0.008) -0.433 (0.015) 0.007 (0.005) 0.005 (0.003) 1,659.410 (623.409) 589.233 (418.840) 1,070.177 (330.616)
0.943 102.780 (12.122) 102.676 (18.137) 1.379 (0.340) 0.151 (0.051) -0.889 (0.008) -0.427 (0.013) 0.006 (0.005) 0.004 (0.004) 1,668.581 (588.977) 593.956 (410.876) 1,074.625 (327.996)
0.950 100.055 (8.063) 99.862 (9.938) 1.278 (0.284) 0.124 (0.041) -0.911 (0.009) -0.436 (0.016) 0.005 (0.004) 0.005 (0.002) 1,649.922 (627.637) 584.818 (421.643) 1,065.104 (335.754)
195,810.333
100,114.858
95,695.476
Prices are expressed as a percentage of one Euro. Standard deviations are in parenthesis.
Figure 1 Bid Functions (N1=5, N2=15, Other Exogenous Variables and Private Signals are taken at their means)
Share Demanded
0.25 0.20 0.15 0.10 0.05 0.00 101.05
101.10
101.15
101.20
101.25
Price
Large Firm Discriminatory
Small Firm Discriminatory
Large Firm Uniform
Small Firm Uniform
Figure 2 Effect of Private Signals on Quantity Demanded by a Large Firm in a Discriminatory Auction (in Deviation from the Quantity Demanded for an Average Private Signal)
Increase in the Share Demanded (in %)
70 60 50 40 30 20 10 0 101.12
101.13
101.14
101.15
101.16
101.17
Stop-out Price Average + 0.5 Standard Deviation
Average + 1 Standard Deviation
Average + 2 Standard Deviation
Average + 3 Standard Deviation
101.18