Firms, (Trade) and Violent Crime Evidence from the Mexican Drug War Haˆ le Utar
Bielefeld University, and CESIfo
z Apart from the direct consequences of violence on people involved, does a violent environment matter for firms, productivity, the way the businesses are conducted?
• Study causal impact of violence on manufacturing firms – employ plant-level panel data from INEGI for 2005-2010 – exploit a plausibly exogenous shift in violence across Mexican cities • I show that increased violence (doubling the homicide rate) in the local environment leads to: – ⇓ capacity utilization ≈ -4% – ⇓ plant-level output ≈ -6% – ⇓ product scope ≈ -2% – ⇓ employment ≈ -4.5% , prod. workers -6% – ⇑ production worker wages ≈ 7%
2500 2000 1500
2010m6
1 m
1
12
20 10
m
1 20
08
m 20 06
m
1
1 m 04 20
20
20 02
00
m
m
1
1
1
3
5
7
9
Homicide Rate (per 100K) 1 20
20 1
12 m
0m
1
1 20 12
m
1 20 10 m
m 20 08
20 0
1
1 4m
1
0m 20 0
20 02 m
1
1
3
5
7
9
Homicide Rate (per 100K) 1 20
12
m
1 20 10 m
1
1 1
20
No of Observations First-Stage F Panel C. Dep. Var.
Violence
• Drug cartel locations (Coscia and Rios ’12) No of Observations First-Stage F
Plant-level variables Log Production No of Products Export Indicator
Panel D. Dep. Var.
High Intensity Drug War Zones Mean SD 9.82 2.64 3.14 2.82 0.32 0.47
No of Observations First-Stage F
-0.278*** (0.092) 33,240 28.40
0.151 (0.124) 32,567 28.21
Avg Wage
-0.405*** (0.127) 28,695 28.21
White-Collar Blue-Collar Wage Wage
-0.080 (0.076) 31,344 27.57
-0.278* (0.169) 32,188 26.80
Capacity Utilization
0.416** (0.176) 28,131 27.13
White-Collar Productivity Emp Share
-23.107*** (5.876) 32,521 27.04
0.060*** (0.023) 27,101 28.40
-0.331* (0.181) 27,712 26.89
Other Locations Mean 9.76 3.20 0.35
SD 3.04 3.09 0.48
Diff 0.06 -0.05 -0.02
t-stat 0.46 -0.42 -1.22
Table 4: HETEROGENOUS Impact of the Violence on EMPLOYMENT- 2SLS Results Sample
Below Median Above Median
Empirical Strategy lnYikjt = α0 + α1V iolencejt + Xtj + τkt + ηi + �ikjt
(1)
Female Intensity Domestic Material Intensity
• Yikjt : plant i’s outcome in industry k located in municipality j and time period t • V iolencejt : the number of intentional homicides per 1,000 people in municipality j at time t / or the quartic rule / or the log
Domestic Sales Intensity Geog. Diversity of Materials Geog. Diversity of Sales Automation Intensity
-0.184* (0.108) -0.056 (0.137) -0.091 (0.176) -0.382*** (0.136) -0.461*** (0.143) -0.593*** (0.181)
-0.480** (0.193) -0.419*** (0.114) -0.329*** (0.110) -0.131 (0.124) 0.006 (0.137) 0.000 (0.112)
Note: Each cell shows the 2SLS estimation of violence on the logarithm of the total number of employees when the sample divided according to the median value of the variable on the left of the respective row.
9
1 20
12
m
1 20
10
m
1 20
08
m
1 06
m
1 20
20
20
04
m 02
m
1
1 m 00
Panel C. Dep. Var. Violence
Production Quantity
No of Products
-0.095*** (0.027) 33,373
-0.096** (0.042) 31,205
-0.051*** (0.016) 33,373
Employment
Total Hours Worked
Employees on Payroll
-0.063*** (0.019) 32,567
-0.071*** (0.019) 28,695
-0.065*** (0.019) 33,240 Production Workers
Production Hours
Blue-Collar W on Payroll
-0.067*** (0.019) 31,344
-0.078*** (0.021) 32,188
-0.068*** (0.019) 28,131
3
5
7
9
No of Observations Panel D. Dep. Var. Non-Production Non-Production White-Collar Emp Employees Hours on Payroll
1
1
m 12 20
20
10
m
1 20
08
m
1 20
06
m
1 20
04
m
1 m 02 20
20
00
m
1
1
Homicide Rate (per 100K) 1 20
12
m
1 20
10
m
1 20
08
m
1 20
06
m
1 20
04
m
1
Production Value
7 5 3
No of Observations
1
Homicide Rate (per 100K) 1
12 15 18 9 6
m
No of Observations Panel B. Dep. Var.
Tehuacán (population 260,923)
3
• The Mexican Drug War, apart from the direct effect on people’s lives, is an important hurdle on manufacturing activities.
Table 2: The Impact of Violence on Plant-level Outcomes
Violence
20
20
20
12
m
1 10
m
1 08
m
1 20
20
20
06
m
1 04
m
1 m
8m
1
• Cocaine prices from the US Office of National Drug Control Policy
OLS Results
Puebla (population 1,485,941)
5 10 15 20 25 30 35
02
20 0
20
20 06
m
1 04 m
1 20 02
m
1
• Homicide and other municipality-level data from INEGI
1000 500
2004m6
0
20
Employment White-Collar Blue-Collar Emp Emp
Findings
0
02
-0.155** (0.074) 33,373 28.11
Conclusions
Gómez Palacio (population 304,515)
20
Panel B. Dep. Var.
-0.392* (0.220) 31,205 27.81
• Robust SEs are clustered at municipality-level
Juárez (population 1,313,338)
1
08 20
15 10 5 0
3. Encuesta Nacional de Empleo, Salarios, Tecnolog´ıa y Capacitaci´on en el Sector Manufacturero (ENESTyC) 2005
Violence
1
No of Observations First-Stage F
Violence
• 5,300 plants located across 32 states in Mexico
Identifying Variation
m
-0.411** (0.174) 33,373 28.11
Violence
No of Products
2. La Encuesta Industrial Anual (EIA), 2003-2007
Panel A. Dependent Variable
00
m
1 m 06 20
20 02
20 04 m
1
1 m
1
0 2 4 6 8 10 12 14 16
00 m 20
1. La Encuesta Industrial Mensual Ampliada (EIMA), 2005-2010
Production Quantity
• τkt: 3-digit Industry by Time FEs (Recession), ηi: Plant FEs
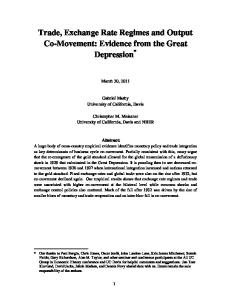
Figure 1: Upsurge in violence in Mexico (Monthly figures on intensional homicides are from INEGI)
m
Panel A. Dependent Variable Production Value
Data
– Pre-trends in homicide rates – control for: crop production, gold, silver, uranium and other metals, oil and natural gas sector (Dube and Vargas ’13)
Time
00
Table 3: The Impact of the Drug War on Plant-level Outcomes
• Xtj : vector of time-varying municipality characteristics
2000m6
Homicide Rate (per 100K)
(2)
F Ast = 1 if state s since year t participates in the fed. military operations. DCj is an indicator for municipality j if there is an active criminal organization during the sample period. Ptcoke denotes the inflation and purity adjusted retail cocaine prices in the US.
Table 1: Pre-Shock (Year 2005) Plant Characteristics
• Dramatic upsurge in violence in Mexico: nation-wide homicides were tripled between 2007 and 2010 – In numbers of violent deaths in 2010, Mexico had more than three times as many killings as Iraq and Afghanistan combined ! – Why? : due to unexpected and unintended consequences of ∆ in drug policy enforcement (President Calder´on’s kingpin strategy) fueled by a plausibly exogenous increase in cocaine prices during the period (Dell ’15, Lindo and Padillo-Romo ’15, Castillo et. al. ’16)
20
Hermosillo (population 701,838)
Violence
The Mexican Drug War
Homicide Rate (per 100K)
Instrjt ≡ F Ast ∗ DCj ∗ Ptcoke
Let’s define municipalities as High Intensity Drug War if the differences between pre- and post- period number and rate of homicides are larger than the mean differences.
• The impact is not homogenous across different plants – More affected: ∗ Plants relying more on domestic sales ∗ Plants relying more on domestic materials ∗ Plants with less geographically diversified sales ∗ Plants with less geographically diversified material use ∗ Plants with manual intensive tech
20
• Instrument for the homicide rate: Municipalities w/ drug cartel operations whose state participated in federal military operations is interacted with the inflation and purity adjusted cocaine prices in the US
• 6,533 plants located across 32 states in Mexico, 90% of the nation-wide manuf. vad • Average plant employs 240 people • Average plant produces 3 varieties
This Paper
Number of Homicides
00 m
• Homicide rates in 2010 : Juarez: 283 vs El Paso: 0.8 ! – The distance between the two cities is just a few miles, but the levels of violence are of orders of magnitude apart.
Homicide Rate (per 100K)
• A common ‘condition’ : violence and conflict – 1 in 4 people on the planet, (> 1.5 billion), live under very high levels of criminal violence (World Development Report 2011)
IV Results
Tequisquiapan (population 208,462)
Chihuahua (population 758,791)
20
Even after taking observed differences in production factors into account, there is still very large ‘unexplained’ cross-country variation in income (Caselli ’05). It matters not only what types and amount of production factors employed, but also the environment in which production takes place. • Misallocation ⇒ 60-120% ↓ in output (Hsieh and Klenow ’09)
Homicide Rate (per 100K)
Hidalgo del Parral (population 103,519)
20 06 m
Introduction
No of Observations
-0.009 (0.022) 32,521
0.031 (0.030) 27,101
-0.030 (0.020) 27,712
– Using a back-of-an-envelope calculation, the estimates suggest that the Mexican Drug War accounted for close to 60% of the aggregate decline in manufacturing employment over 2007-2010 period. • Production workers are more affected than non-production workers and violence changes plants’s input intensities towards nonproduction employees. Why? – Security concerns, e.g. roadblocks, increased risk in travelling after night may lead to worker absenteeism especially among nightshift production workers and increases their reservation wage – Recruiting efforts of criminal organizations, as they are in need of manpower, may lead to increase in production (unskilled) workers’ wages z Results so far points to these channels through which the violence affects manufacturing – Production/Blue-Collar/Unskilled worker absenteeism – Local demand decline e.g. due to conspicuous consumption (Mejia and Restrepo, ’16) or relocation of local businesses/people – Disruptions in supply chains