Feasibility Study of Pharmacy Robotic System (PRS) at Hospital Outpatient Pharmacy Siang-Li CHUA1, Bee-Hoon HENG1, Jason Tiang-Seng CHEAH2 1 2
Health Services & Outcomes Research, National Healthcare Group, Singapore Clinical Projects Management & Planning, National Healthcare Group, Singapore
1. Background A Pharmacy Robotic System (PRS) to replace manual drug picking and packing at a hospital outpatient pharmacy was being designed. The simplest technology to be implemented on PRS is to pack blisters and foils which make up 50% of the total items dispensed daily. Thus, 50% savings in manpower is expected with implementation of PRS. As drugs come in many forms of packaging, with a PRS that can only pack blisters and foils, a prescription can be packed in one of the three ways – Full PRS where all items are packed by PRS, Partial PRS where some items are packed by PRS and others by man, and Full Manual where all items are packed by man. 2. Objective The objectives of this operations research study are to: 1. assess the efficiency of PRS vs the manual system; 2. determine the number of staff needed to maintain current patient Wait Time (WT); 3. determine the number of staff needed to meet service target WT of 30 minutes in 95th percentile. 3. Method Two simulation models (Figure 1) are built to compare the current pharmacy process and process with PRS. The models consider the arrival rate of prescriptions, staff schedule and service rates. In the current process, when a patient arrives with prescription, he will be given a queue number and the typist will type the prescription into the system. After typing, the packers will pack the drugs. The dispensers will check that the packed drugs is correct before calling the patient for dispensing. WT is from the time patient arrives till the time he is called for dispensed.
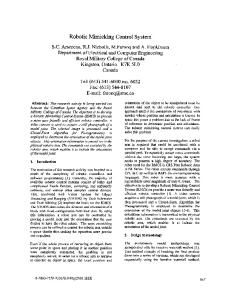
Proportion of Prescriptions
Proportion of Items
Full Manual 47%
Full PRS 12%
Packed by Man 58%
Partial PRS 41%
Packed by PRS 42%
Figure 3. The proportion of prescriptions and items to be packed by PRS
Currently, the WT is about an hour at 95th percentile. Efficiency of PRS Compared to the current process, simulation results (Table 1) show PRS prolongs the WT. If packers are reduced by 50%, the WT would be doubled. Table 1. Simulation results: Packers required to maintain current WT Current Process (Baseline Simulation)
Scenario
Event Wait Time (minutes) Q time to type Q time to pack by man Q time to pack by PRS Q time to dispense % Utilization of packers % Utilization of dispensers % Utilization of 1 PRS
Ave 23.7 0.4 0.3 13.2
95th Percentile 59.0 7.4 5.3 44.2 67.6 94.6 -
What-if PRS Process (current manpower) 95th Ave Percentile 24.6 62.7 2.6 9.2 0.7 1.0 1.2 4.5 11.1 41.5 55.6 94.9 68.9
What-if PRS Process (reduce packers by 50%) 95th Ave Percentile 50.3 120.9 30.7 106.0 1.5 13.6 4.2 18.8 6.6 30.6 97.2 88.4 62.2
What-if PRS Process (reduce packers by 18%) 95th Ave Percentile 25.2 63.5 1.2 12.0 0.4 6.1 5.9 22.7 10.8 41.7 76.6 94.8 66.8
Manpower required to maintain current WT With PRS, manpower saved on packers is only 18%. Manpower required to achieve WT target PRS does not help to meet the WT target of 30 minutes in 95th percentile because it does not remove the current bottleneck (Table 1) which is at the dispensing where patient counseling is also conducted. In the current manual process (Table 2), the WT target can be achieved with two more dispensers. But with PRS, WT target cannot be achieved even with the additional dispensers. Table 2. Simulation results: Manpower required to achieve WT target Current Process (Baseline Simulation)
Scenario
Figure 1. The Simulation Models
In the PRS process, all activities are similar except packing (boxed under Figure 1) and the packing rate. After typing, typist will determine whether the prescription will be packed by PRS. If a prescription is full manual, the rest of the process is similar to the current process. If a prescription is partial or full PRS, it will be fed into PRS. PRS will pack one drug item at a time. It will first pick and then pack. As PRS has 2 arms, it can pick and pack different item at the same time. Picking an item takes 20 seconds and packing takes another 20 seconds. Finally, all items in a prescription will be consolidated in a tray which takes another 6 seconds. Thus, for example, a 2-item prescription will take 66 seconds to pack (Figure 2). Pick Item 1 Pick Item 2 (20 sec) (20 sec) 1st Arm |-------------------|-------------------|
2nd Arm
Tray in/out (6 sec) |-----------------|
Pack Item 1 Pack Item 2 (20 sec) (20 sec) |-------------------|-------------------|
A 2-item prescription = 66 seconds
Figure 2. An example of PRS time taken to pack 2-item prescription
For full PRS, the packer will assemble all the items ready for dispenser to check while for partial PRS, the packer will pack the rest of the items in addition to assembling the items. 5. Results Data analysis shows that only 12% of the prescriptions are full PRS, 41% partial PRS and 47% full manual (Figure 3). Therefore, having 50% of the total items dispensed by PRS does not translate into 50% manual workload reduction.
Event Wait Time (minutes) Q time to type Q time to pack by man Q time to pack by PRS Q time to dispense % Utilization of packers % Utilization of dispensers % Utilization of 1 PRS
Ave 23.7 0.4 0.3 13.2
95th Percentile 59.0 7.4 5.3 44.2 67.6 94.6 -
Current Process (What-if add 2 dispensers)
Ave 11.5 0.4 0.3 0.9
95th Percentile 26.9 7.4 5.3 8.7 67.6 72.7 -
What-if PRS Process (same packers, add 2 dispensers) Ave 13.7 0.1 0.1 5.9 0.8
95th Percentile 36.0 4.7 3.0 22.2 8.8 55.6 72.9 66.8
What-if PRS Process (reduce packers by 18%, add 2 dispensers) 95th Ave Percentile 15.0 37.9 1.2 12.0 0.4 6.1 5.9 22.7 0.6 8.1 76.6 72.8 66.8
Specification of PRS to achieve WT target With PRS, a bottleneck (Table 2) is created at the packing stage because its speed is not able to cope with the workload. To achieve WT target in PRS system, its time taken to pack must be halved with two additional dispensers (Table 3). Table 3. Simulation results: Required speed of PRS to achieve WT target Scenario Event Wait Time (minutes) Q time to type Q time to pack by man Q time to pack by PRS Q time to dispense % Utilization of packers % Utilization of dispensers % Utilization of 1 PRS
Current Process (What-if add 2 dispensers) Ave 11.5 0.4 0.3
95th Percentile 26.9 7.4 5.3
0.9
8.7 67.6 72.7 -
What-if PRS Process (add 2 dispensers, PRS service time halved) Ave 95th Percentile 11.4 26.4 0.7 9.4 0.2 5.0 0.4 0.4 0.9 8.0 71.1 72.9 37.9
6. Conclusion The current packing process is more efficient than PRS because of the slow speed of latter. PRS with a faster speed needs to be explored. With PRS, manpower saved on packers is only 18%. To meet WT target, with or without PRS, two more dispensers will be required. Contact Details: Siang-Li CHUA Health Services & Outcomes Research National Healthcare Group 6 Commonwealth Lane Level 6 GMTI Building Singapore 149547 Email:
[email protected]