JASN Express. Published on January 31, 2007 as doi: 10.1681/ASN.2006091034
Ferric Gluconate Is Highly Efficacious in Anemic Hemodialysis Patients with High Serum Ferritin and Low Transferrin Saturation: Results of the Dialysis Patients’ Response to IV Iron with Elevated Ferritin (DRIVE) Study Daniel W. Coyne,* Toros Kapoian,† Wadi Suki,‡ Ajay K. Singh,§ John E. Moran,储 Naomi V. Dahl,¶ and Adel R. Rizkala;¶ the DRIVE Study Group *Department of Medicine, Washington University School of Medicine, St. Louis, Missouri; †Department of Medicine, University of Medicine and Dentistry of New Jersey–Robert Wood Johnson Medical School, New Brunswick, New Jersey; ‡The Kidney Institute, Inc., Houston, Texas; §Department of Medicine, Harvard Medical School, Boston, Massachusetts; 储Satellite Healthcare, Inc., Mountain View, California; and ¶Clinical Affairs, Watson Laboratories, Inc., Morristown, New Jersey Few data exist to guide treatment of anemic hemodialysis patients with high ferritin and low transferrin saturation (TSAT). The Dialysis Patients’ Response to IV Iron with Elevated Ferritin (DRIVE) trial was designed to evaluate the efficacy of intravenous ferric gluconate in such patients. Inclusion criteria were hemoglobin <11 g/dl, ferritin 500 to 1200 ng/ml, TSAT <25%, and epoetin dosage >225 IU/kg per wk or >22,500 IU/wk. Patients with known infections or recent significant blood loss were excluded. Participants (n ⴝ 134) were randomly assigned to no iron (control) or to ferric gluconate 125 mg intravenously with eight consecutive hemodialysis sessions (intravenous iron). At randomization, epoetin was increased 25% in both groups; further dosage changes were prohibited. At 6 wk, hemoglobin increased significantly more (P ⴝ 0.028) in the intravenous iron group (1.6 ⴞ 1.3 g/dl) than in the control group (1.1 ⴞ 1.4 g/dl). Hemoglobin response occurred faster (P ⴝ 0.035) and more patients responded after intravenous iron than in the control group (P ⴝ 0.041). Ferritin <800 or >800 ng/ml had no relationship to the magnitude or likelihood of responsiveness to intravenous iron relative to the control group. Similarly, the superiority of intravenous iron compared with no iron was similar whether baseline TSAT was above or below the study median of 19%. Ferritin decreased in control subjects (ⴚ174 ⴞ 225 ng/ml) and increased after intravenous iron (173 ⴞ 272 ng/ml; P < 0.001). Intravenous iron resulted in a greater increase in TSAT than in control subjects (7.5 ⴞ 7.4 versus 1.8 ⴞ 5.2%; P < 0.001). Reticulocyte hemoglobin content fell only in control subjects, suggesting worsening iron deficiency. Administration of ferric gluconate (125 mg for eight treatments) is superior to no iron therapy in anemic dialysis patients who receiving adequate epoetin dosages and have a ferritin 500 to 1200 ng/ml and TSAT <25%. J Am Soc Nephrol ●●: ●●●–●●●, ●●●●. doi: 10.1681/ASN.2006091034
I
ntravenous iron therapy is required by almost all hemodialysis patients to maintain iron stores and permit adequate erythropoiesis (1). Iron deficiency can occur in virtually all hemodialysis patients as a result of continuing blood losses and increased iron utilization as a result of erythropoiesis-stimulating protein therapy. Hemodialysis patients are estimated to lose 1 to 3 g of iron per year (2). Consequently, regular intravenous iron administration to hemodialysis patients is recommended (1). Serum ferritin and transferrin saturation (TSAT) are the standard laboratory tests to evaluate iron stores, and the limits for diagnosis of iron deficiency and adequate iron in healthy adults
Received September 21, 2006. Accepted December 11, 2006. Published online ahead of print. Publication date available at www.jasn.org. Address correspondence to: Dr. Daniel W. Coyne, Washington University School of Medicine, 660 S. Euclid Avenue, Campus Box 8129, St. Louis, MO 63110. Phone: 314-362-7211; Fax: 314-747-3743; E-mail:
[email protected] Copyright © ●●●● by the American Society of Nephrology
are fairly well defined. Although these tests are used routinely to guide iron therapy in dialysis patients, studies have shown that ferritin and TSAT cutoffs for diagnosis of iron deficiency must be much higher than that used in the general population (3,4). In addition, studies that have administered intravenous iron to dialysis patients have found ferritin and TSAT repeatedly to be poorly predictive of hemoglobin responsiveness (4 –7). Following the recommendations of the National Kidney Foundation’s 1997 and 2001 Anemia Guidelines to maintain ferritin between 100 and 800 ng/ml, intravenous iron has been administered regularly to most hemodialysis patients, generally as maintenance therapy that is reduced as ferritin approaches 800 ng/ml (1,2). Consequently, the mean ferritin in the US hemodialysis population has been stable between 590 and 630 ng/ml since 2001 (8). The 2006 Anemia Clinical Practice Recommendations (CPR) state that there is insufficient evidence of responsiveness to iron when ferritin is ⬎500 ng/ml, ISSN: 1046-6673/●●●●-0001
2
Journal of the American Society of Nephrology
and “routine administration” cannot be recommended, although intravenous iron use should be considered after weighing “ESA [erythropoiesis-stimulating agent] responsiveness, [hemoglobin] and TSAT level, and the patient’s clinical status” (9). Rigidly withholding iron when ferritin is ⬎500 ng/ml on the basis of the new CPR’s opinion-based statement without considering the factors noted above as directed by the recommendation would have significant implications for a large portion of the hemodialysis population, especially if significant numbers of patients with higher ferritin have absolute or functional iron deficiency. The Dialysis Patients’ Response to IV Iron with Elevated Ferritin (DRIVE) study is a controlled, multicenter trial that randomly assigned hemodialysis patients to 1 g of ferric gluconate (Ferrlecit; Watson Laboratories, Morristown, NJ) or no iron therapy if they were anemic, had serum ferritin of 500 to 1200 ng/ml, had TSAT ⱕ25%, and were receiving adequate epoetin dosages. The trial was designed specifically to determine the response rate to intravenous iron over this broad ferritin range and to determine what upper limit, if any, should be used.
Materials and Methods The study was an open-label, randomized, controlled, multicenter trial conducted in 37 centers across the United States. It was conducted in compliance with the Declaration of Helsinki and approved by the human studies committee at each center. This trial was registered with the National Institutes of Health through the National Library of Medicine at http://www.clinicaltrials.gov/.
Patient Selection Eligible patients provided informed consent, were at least 18 yr of age, were on hemodialysis for ⱖ90 d, were receiving a stable dosage of epoetin ⱖ225 IU/kg per wk or ⱖ22,500 IU/wk for ⱖ2 wk, and received no more than 125 mg/wk intravenous iron during the 4 wk preceding screening/baseline. Other entry criteria were most recent ferritin 500 to 1200 ng/ml, TSAT ⱕ25%, and hemoglobin ⱕ11.0 g/dl. Exclusion criteria were use of any investigational agent within 30 d, lactating
J Am Soc Nephrol ●●: ●●●–●●●, ●●●●
women or women with positive pregnancy tests, known sensitivity to ferric gluconate, planned surgical procedure, evidence of significant blood loss within the previous 6 wk, or hematologic disorders or malignancies. At screening, patients could not have had any active infection that required systemic antibiotics, missed more than three hemodialysis treatments in the previous 8 wk, received a transfusion within 4 wk, or been hospitalized within 2 wk.
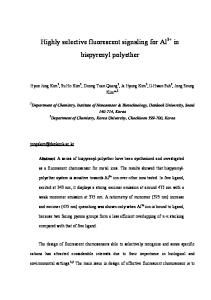
Study Design and Procedures The screening/baseline period (week 0; Figure 1) lasted ⱕ1 wk. Any oral and intravenous iron was discontinued during screening. Patients who met all of the entry criteria underwent central laboratory screening to ensure that their hemoglobin, TSAT, and ferritin levels continued to meet the study criteria. Central laboratory screening panel was drawn before the first or second treatment of the week and included complete blood count, reticulocyte count, complete metabolic panel, and complete iron studies. All study samples were analyzed at the central laboratory (Spectra Renal Research, Rockleigh, NJ). Patients were randomly assigned when central laboratory results showed ferritin from 500 to 1200 ng/ml, TSAT ⱕ25%, and hemoglobin ⱕ11 g/dl, and these results were considered their baseline biochemical values. Patients who failed screening could be rescreened later if they continued to meet all entry criteria at the time of rescreening. Medical, demographic, and renal history, previous intravenous iron and epoetin regimens, Kt/V, and dialysis access were collected only on patients who passed screening and were randomly assigned. Randomly assigned patients could not reenter the study. Patients were stratified by baseline ferritin, ⱕ800 or ⬎800 ng/ml, at a 1:1 ratio. Using a computer-generated randomization scheme, within each stratum, patients were centrally randomly assigned 1:1 to either no iron (control group) or 1 g of ferric gluconate (Ferrlecit) administered in eight consecutive 125-mg doses beginning with the first dialysis session of week 1 (intravenous iron group). Patients who missed a dose of iron could receive the dose until the second treatment of week 5. Epoetin dosage was raised by 25% in both groups, and this dosage was maintained for the entire study. Hemoglobin and reticulocyte hemoglobin content (CHr) were obtained weekly before the second dialysis session, and the complete laboratory panel was obtained before the second dialysis session of week 6 or at early termination.
Figure 1. A schematic of the study procedures. Screening occurred at week 0, treatment occurred during weeks 1 through 5, and the end point laboratory screening panel was drawn during week 6. Epoetin dosage changes were prohibited after the initial 25% increase with the first hemodialysis treatment of week 1. L, comprehensive laboratory testing; H, hemoglobin and reticulocyte hemoglobin content (CHr) testing; X, 125 mg of ferric gluconate.
J Am Soc Nephrol ●●: ●●●–●●●, ●●●●
High Ferritin and Intravenous Ferric Gluconate Effectiveness
Primary and Secondary Objectives
the log-rank test. All statistical tests were conducted at ␣ ⫽ 0.05 significance level. All statistical analyses were conducted using SAS 8.2 (SAS Institute, Cary, NC).
The study’s predefined primary objective was to compare the difference between treatment groups in change from baseline (CFB) to week 6 in hemoglobin. Secondary efficacy objectives were percentage of responders (defined as hemoglobin increase of ⱖ2 g/dl during the study) and time to response. Because both groups received an increase in epoetin dosage, we expected the control group hemoglobin to increase and therefore adopted a stricter definition of a responder than others have in the past (4,5,7). Secondary objectives included a comparison between the two groups in CFB in CHr. For addressing safety concerns, secondary objectives included CFB in TSAT, serum ferritin, and C-reactive protein (CRP).
Statistical Analyses The primary predefined analysis was based on the intention-to-treat (ITT) analysis, which included participants who received at least one study treatment and had at least one postbaseline hemoglobin level. Lacking any published data on the efficacy of intravenous iron when ferritin is ⬎500 ng/ml, the statistical assumptions (difference in hemoglobin and SD) were based on unpublished clinical data that were collected by the lead investigator of patients who had elevated ferritin levels and did or did not receive 1 g of ferric gluconate. On the basis of statistical power of 90% and type I error of 5%, assuming that the hemoglobin difference between groups would be 0.67 g/dl, and assuming an SD of 1.13 g/dl, 61 patients were required in each treatment group (i.e., a minimum overall total of 122 patients). A predefined confirmatory per-protocol (PP) analysis was performed, which excluded patients who had any serious protocol deviations and received ⬍75% of scheduled epoetin doses or ⬍1000 mg of ferric gluconate (if randomly assigned to intravenous iron). To allow for dropouts and inadvertent iron administration to control patients, we set recruitment within each treatment group, as well as within each stratum, at 75. Continuous variables were summarized using means and SD or medians and interquartile ranges. Categorical variables were summarized using frequencies and percentages. Differences between the two groups in CFB of continuous variables were analyzed using analysis of covariance (ANCOVA). Within-group CFB was compared with zero using one-sample t test. The Cochran-Mantel-Haenszel test was used to compare response rates in the groups while taking into account the ferritin stratum. Time to response in the groups was compared using
3
Results Patient Disposition and Characteristics A total of 503 patients were screened through the central laboratory from September 2004 to April 2006. Table 1 shows the baseline characteristics of the screen failures and the randomly assigned patient populations. Screen failures were due to hemoglobin ⬎11.0 g/dl (65%), TSAT ⬎25% (37%), and ferritin too low (24%) or too high (14%). Patients could have more than one reason for screen failure. Patients who failed screening had higher hemoglobin level (P ⬍ 0.001) and TSAT (P ⬍ 0.001). A total of 134 patients were randomly assigned to the trial, 77 in the lower ferritin stratum and 57 in the upper ferritin stratum (Figure 2). Among the randomly assigned patients, 37.9% of the control group and 33.8% of the intravenous iron group had received intravenous iron during the 4 wk before randomization. A total of 29 of the 134 patients had failed screening at least once before successfully rescreening; they received a mean of 44 ⫾ 76 mg of intravenous iron during the 4 wk before successful screening, which was not significantly different from those who passed screening with the first attempt (P ⫽ 0.189). The study was terminated before the planned 150 patients were randomly assigned, because we encountered slow enrollment in the upper ferritin stratum. Because the primary analyses did not rely on differentiation between strata and the a priori power analysis required only 122 patients to detect a potential difference between groups (61 in each treatment group), it was decided that early termination of the study would not compromise scientific validity of its results. Of the 134 patients, 66 were randomly assigned to the control group (38 in lower ferritin stratum, 28 in higher ferritin stratum) and 68 were randomly assigned to the intravenous iron group (39 in lower stratum, 29 in higher stratum; Figure 2). Five patients had no postbaseline hemoglobin levels, leaving 129
Table 1. Characteristics of the randomized and screen failure patientsa Parameter
Randomized Patients (n ⫽ 134)
Screen Failures (n ⫽ 369)
P
Age (yr) Women (n 关%兴) Hemoglobin (g/dl) CHr (pg) Serum ferritin (ng/ml) TSAT (%) WBC (1000/mm3) MCV (mcm3) MCH (pg/cell) Serum albumin (g/dl) C-reactive protein (mg/L)b
58.7 ⫾ 14.8 66 (49.3) 10.3 ⫾ 0.8 31.2 ⫾ 2.7 761 ⫾ 189 18.6 ⫾ 4.3 6.9 ⫾ 2.5 94.8 ⫾ 8.4 29.9 ⫾ 3.0 3.8 ⫾ 0.4 27.0 ⫾ 33.7
59.6 ⫾ 14.6 178 (48.2) 11.2 ⫾ 1.1 31.7 ⫾ 3.0 775 ⫾ 380 23.6 ⫾ 8.3 6.7 ⫾ 2.5 96.3 ⫾ 8.4 30.3 ⫾ 3.0 3.8 ⫾ 0.5 22.0 ⫾ 34.7
NS NS ⬍0.001 NS NS ⬍0.001 NS NS NS NS NS
a CHr, reticulocyte hemoglobin content; MCH, mean corpuscular hemoglobin; MCV, mean corpuscular volume; TSAT, transferrin saturation; WBC, white blood cells. b C-reactive protein (CRP) values were obtained using the high-sensitivity assay.
4
J Am Soc Nephrol ●●: ●●●–●●●, ●●●●
Journal of the American Society of Nephrology
Figure 2. A schematic of patient disposition. Of the 503 patients who were screened through the central laboratory, 134 were randomly assigned. Patients could have failed screening for more than one reason. Five randomly assigned patients withdrew before any postbaseline hemoglobin values were obtained. ITT, intention-to-treat; TSAT, transferrin saturation.
patients in the ITT analysis. Two dropouts (one control, one intravenous iron group) were hospitalized after randomization and withdrawn. Three other iron group dropouts were due to one voluntary withdrawal, one major protocol violation, and one by investigator as a result of psychiatric hospitalization. These five dropouts had mean hemoglobin of 9.9 g/dl, ferritin of 726 ng/ml, TSAT of 18.0%, and epoetin dosage of 30,750 IU/wk. Of those who were included in the ITT analysis, 93 met the definition to be included in the PP analysis (control 50; intravenous iron 43). Baseline demographic and laboratory characteristics are summarized in Table 2. Baseline laboratory tests, including hemoglobin levels, were drawn before the first hemodialysis session of the week in 39 (60%) and 31 (48.4%) patients in the control and intravenous iron groups, respectively. Baseline hemoglobin was similar in both groups whether drawn before the first or the second dialysis session of the week. Baseline hemoglobin levels that were drawn before the first and second sessions were 10.2 ⫾ 0.8 and 10.1 ⫾ 0.6 g/dl, respectively, in the control group, and 10.4 ⫾ 0.6 and 10.3 ⫾ 0.9 g/dl, respectively, in the intravenous iron group. There were no significant differences between groups in any of the characteristics. CRP levels, obtained using the high-sensitivity assay, were significantly elevated, suggesting inflammation in these patients with high ferritin.
Primary Outcome Table 3 and Figure 3 summarize hemoglobin changes from baseline to the end of the study. Baseline hemoglobin levels were 10.2 ⫾ 0.7 g/dl in the control group and 10.4 ⫾ 0.8 g/dl
in the intravenous iron group (P ⫽ NS). The final hemoglobin levels were higher in both control and intravenous iron groups (11.3 ⫾ 1.4 and 11.9 ⫾ 1.3 g/dl, respectively; P ⬍ 0.0001 for both). The primary end point—the CFB hemoglobin—was significantly greater in the intravenous iron group than in the control group by 0.5 g/dl (95% confidence interval 0.1 to 1.0 g/dl; P ⫽ 0.028). The PP analysis confirmed the superiority of intravenous iron and the magnitude of the difference between groups (CFB hemoglobin difference 0.5 g/dl; P ⫽ 0.012). Adjusted for baseline CRP, the difference in CFB hemoglobin widened further in favor of intravenous iron (0.6 g/dl; P ⫽ 0.014). Exploratory analyses using ANCOVA showed that intravenous iron amount given in the 4 wk before the study, type of hemodialysis access, and screening day (first versus second dialysis session of the week) had no influence on CFB in hemoglobin (P ⫽ 0.958, P ⫽ 0.332, and P ⫽ 0.711, respectively). Intravenous iron was consistently superior to no iron in improving hemoglobin levels by 0.5 g/dl (P ⬍ 0.05). An exploratory ANCOVA model that controlled for whether baseline epoetin dosage was above or below the median of 30,000 IU/wk showed that higher epoetin dosage resulted in a greater CFB in hemoglobin by 0.5 g/dl (P ⫽ 0.022), although intravenous iron continued to be superior to no iron by 0.5 g/dl (P ⫽ 0.025). There was no relationship between magnitude of the responsiveness to intravenous iron relative to the control group and ferritin stratum (ⱕ800 ng/ml stratum, intravenous iron greater by 0.5 g/dl; ⬎800 ng/ml stratum intravenous iron greater by 0.5 g/dl). Similarly, there was no relationship between the magnitude of responsiveness to intravenous iron relative to the control and whether the baseline TSAT was ⱖ19% (median baseline TSAT in both groups). The PP analysis yielded similar findings.
Secondary Outcomes The percentage of responders—those who achieved an increase in hemoglobin ⱖ2 g/dl at any point—was 46.9% in the intravenous iron and 29.2% in the control group, a difference that was both clinically and statistically significant (P ⫽ 0.041; Table 3). Six patients need to be treated with intravenous iron for one additional patient to be a responder. Similarly, in the PP analysis, 51.2% of the intravenous iron group responded compared with only 24.0% in the control group (P ⫽ 0.007). Again, response rates and the superiority of intravenous iron were similar within each ferritin stratum (lower stratum 45.9 versus 29.7%; higher stratum 48.1 versus 28.6%). Patients who received intravenous iron also responded faster (Figure 4), with a median time to response of 6 wk (P ⫽ 0.035). To investigate the effect of baseline epoetin dosage on responder rate, we performed an exploratory Cochran-Mantel-Haenszel test while stratifying patients by median baseline epoetin dosage. Baseline epoetin dosage had no effect on response rate (P ⫽ 0.145), and intravenous iron continued to be superior to no iron (P ⫽ 0.035). As shown in Table 3, both groups had similar mean CHr levels at baseline, which were higher than the target CHr level
J Am Soc Nephrol ●●: ●●●–●●●, ●●●●
High Ferritin and Intravenous Ferric Gluconate Effectiveness
5
Table 2. Baseline demographic and biochemical parameters and history of kidney disease by treatment groupa Parameter
Control (n ⫽ 65)
Intravenous Iron (n ⫽ 64)
Age (yr) Women (n 关%兴) Weight (kg) Height (cm) Race (n 关%兴) white lack Hispanic Asian/Pacific Islander other Hemodialysis access (n 关%兴) AV fistula AV graft temporary catheter permanent catheter Dialysis vintage (yr) WBC (1000/mm3) MCV (mcm3) MCH (pg/cell) Most recent Kt/V Serum albumin (g/dl) CRP (mg/L)b Intravenous iron in previous 4 wk (n 关%兴) Intravenous iron given in previous 4 wk (mg) Epoetin dosage (IU/wk)
58.7 ⫾ 15.2 37 (56.9) 75.0 ⫾ 22.3 168.1 ⫾ 9.8
61.2 ⫾ 13.0 27 (42.2) 76.4 ⫾ 21.0 171.9 ⫾ 36.1
20 (30.8) 33 (50.8) 9 (13.8) 2 (3.1) 1 (1.5)
20 (31.3) 30 (46.9) 9 (14.1) 5 (7.8) 0 (0.0)
30 (46.2) 21 (32.3) 3 (4.6) 11 (16.9) 4.2 ⫾ 3.1 6.3 ⫾ 2.3 94.8 ⫾ 9.0 30.0 ⫾ 3.2 1.7 ⫾ 0.3 3.7 ⫾ 0.4 25.5 ⫾ 29.3 24 (36.9) 70 ⫾ 108 35,128 ⫾ 17,769
33 (51.6) 20 (31.3) 2 (3.1) 9 (14.1) 5.1 ⫾ 5.0 7.5 ⫾ 2.6 95.6 ⫾ 7.7 30.1 ⫾ 2.8 1.6 ⫾ 0.4 3.8 ⫾ 0.4 29.3 ⫾ 39.2 22 (34.4) 61 ⫾ 103 33,498 ⫾ 17,377
a
There were no statistically significant differences between the two groups in any of the baseline demographic and biochemical characteristics or history of kidney disease. AV, arteriovenous. b CRP values were obtained using the high-sensitivity assay.
Table 3. Hematologic, chemical, and iron indices and rate of responders in treatment groupsa Controlb (n ⫽ 65)
Parameter
Hemoglobin (g/dl) Respondersd (%) CHre (pg) Serum ferritin (ng/ml) TSAT (%)
Baseline
Final
10.2 ⫾ 0.7
11.3 ⫾ 1.4 29.2 30.2 ⫾ 2.8 591 ⫾ 274 21.1 ⫾ 5.8
31.0 ⫾ 2.8 765 ⫾ 193 19.0 ⫾ 4.1
Intravenous Ironb (n ⫽ 64) CFB
Baseline
Final
CFB
1.1 ⫾ 1.4f
10.4 ⫾ 0.8
1.6 ⫾ 1.3f
⫺0.9 ⫾ 1.6f ⫺174 ⫾ 225f 1.8 ⫾ 5.2f
31.4 ⫾ 2.7 759 ⫾ 190 18.2 ⫾ 4.2
11.9 ⫾ 1.3 46.9 31.4 ⫾ 2.5 929 ⫾ 297 25.6 ⫾ 7.6
0.0 ⫾ 2.2 173 ⫾ 272f 7.5 ⫾ 7.4f
Pc
0.028 0.041 0.011 ⬍0.001 ⬍0.001
a
CFB, change from baseline. Control group received no iron treatment; intravenous iron group received 1 g of ferric gluconate (125 mg during eight consecutive dialysis treatments). c P value comparing between-group difference in CFB (hemoglobin, CHr, serum ferritin, and TSAT) and in proportion of responders in the two groups. d Responders all were patients who experienced a CFB in hemoglobin ⱖ2 g/dl at any point in the study. e CHr was obtained using the Advia 120 analyzer (Bayer Diagnostics, Tarrytown, NY). f Within-group CFB is statistically significant (P ⬍ 0.05). b
recommended by the 2006 Kidney Disease Outcomes Quality Initiative (KDOQI) CPR of ⬎29 pg. CHr increased significantly during intravenous iron administration (weeks 2 and 3; Figure 5) while slowly declining in the control group. At 6 wk, CHr fell
by 0.9 ⫾ 1.6 pg in the control group (P ⬍ 0.001) and did not change in the intravenous iron group (0.0 ⫾ 2.2 pg; difference between groups P ⫽ 0.011). This CHr difference between groups was similar in both ferritin strata.
6
J Am Soc Nephrol ●●: ●●●–●●●, ●●●●
Journal of the American Society of Nephrology
Figure 3. Changes in weekly hemoglobin (⫾SE) in the intravenous iron group (solid line) and the control group (dashed line) from baseline to week 6. The arrows indicate 125 mg of ferric gluconate doses administered to the intravenous iron group. Hemoglobin increased significantly in both groups (P ⬍ 0.001) but increased significantly more in the intravenous iron group (P ⫽ 0.028 with last observation carried forward [LOCF]). *P values of the comparison change in hemoglobin between groups by analysis of covariance (ANCOVA) at weeks 2 through 5 are 0.859, 0.151, 0.055, and 0.013, respectively.
Figure 5. Changes in weekly CHr (⫾SE) in the intravenous iron group (solid line) and the control group (dashed line) from baseline to week 6. The arrows indicate 125 mg of ferric gluconate doses administered to the intravenous iron group. In the intravenous iron group, CHr increased significantly in weeks 2 and 3 during iron administration (P ⬍ 0.05 versus baseline) and returned to baseline levels at week 6. In the control group, CHr fell steadily and at week 6 was significantly below baseline (P ⫽ 0.001) and the week 6 CHr in the intravenous iron group (P ⫽ 0.011 LOCF). *P values of the comparison of the groups’ weekly CHr by ANCOVA at weeks 2 through 4 are ⱕ0.001 and 0.004 at week 5.
P ⫽ 0.008). A post hoc analysis showed no correlation between baseline CRP and change in TSAT (r ⫽ ⫺0.008, P ⫽ 0.932).
Safety
Figure 4. Kaplan-Meier curves of the time to response by treatment group. Response was defined as change from baseline in hemoglobin by ⱖ2 g/dl at any point during the study. The median time to response in the intravenous iron group (solid line) was 6 wk, but in the control group (dashed line), it was undefined (P ⫽ 0.035). Both groups had similar ferritin levels at baseline, but final ferritin differed significantly between groups (P ⬍ 0.001; Table 3), with the control group decreasing significantly (⫺174 ng/ml; P ⬍ 0.001) and the intravenous iron group increasing significantly (173 ng/ml; P ⬍ 0.001). Similar changes were seen within each stratum (Table 4). Both groups also had similar TSAT levels at baseline (Table 3). The net increase in TSAT after intravenous iron (7.5% points) was significantly greater than the control (1.8% points; P ⬍ 0.001). Within the ferritin strata, the net increase in TSAT (Table 4) after intravenous iron was similar and significant (6.6% lower stratum; 8.8% higher stratum), whereas in the control group, the net TSAT increase was significant only in the higher stratum (1.1% lower stratum, P ⫽ 0.263; 2.8% higher stratum,
Adverse events were typical of the patient population and did not differ significantly between groups (Table 5). Adverse events that occurred in more than 5% of patients were diarrhea (7.6%), hypertension (7.6%), and hypotension (6.1%) in the control group and diarrhea (6.1%) in the intravenous iron group. Diarrhea, dyspepsia, dyspnea, dizziness, chest pain, back pain, and/or increased sweating, which have been reported with all available intravenous iron preparations, occurred in four patients and were thought to be related to the intravenous iron. Thirteen infection episodes in 10 patients occurred in the control arm, and 12 infection episodes occurred in eight patients in the intravenous iron arm. Cardiac adverse events occurred in four patients in each group. Vascular adverse events occurred in 13 and five patients in the control and the intravenous iron groups, respectively. In the control group, 14 serious adverse events (SAE) occurred in nine patients, and 12 SAE occurred in nine patients in the intravenous iron group. One patient died in each group. None of the SAE or deaths was attributed to the study treatment by the investigators. Median (interquartile range) CFB in CRP levels in the control group was 0.0 mg/L (⫺7.9 to 10.7 mg/L) and in the intravenous iron group was ⫺0.4 mg/L (⫺10.2 to 6.7 mg/L; P ⫽ 0.558).
Discussion Anemia management in dialysis patients has been remarkably successful in the past decade (8). The vast majority of patients require regular epoetin or darbepoetin and intravenous iron (8). In the United States, approximately 60% of dial-
J Am Soc Nephrol ●●: ●●●–●●●, ●●●●
High Ferritin and Intravenous Ferric Gluconate Effectiveness
7
Table 4. Baseline and final iron studies by ferritin stratum Controla
Intravenous Irona
Ferritin Stratum
ⱕ800 ng/ml n ferritin (ng/ml) TSAT (%) ⬎800 ng/ml n ferritin (ng/ml) TSAT (%)
Baseline
Final
Baseline
Final
37 627 ⫾ 86 18.9 ⫾ 3.8
37 455 ⫾ 172b 20.0 ⫾ 6.4
622 ⫾ 84 18.8 ⫾ 3.7
817 ⫾ 231b 25.4 ⫾ 7.0b
28 947 ⫾ 135 19.1 ⫾ 4.6
27 770 ⫾ 284b 22.5 ⫾ 4.6b
946 ⫾ 121 17.3 ⫾ 4.8
1098 ⫾ 310b 25.9 ⫾ 8.5b
a
Control group received no iron treatment; intravenous iron group received 1 g of ferric gluconate (125 mg during eight consecutive dialysis treatments). b Final values were statistically different from corresponding baseline values.
Table 5. Adverse events of clinical interesta Parameter
Control (n ⫽ 66)
Intravenous Iron (n ⫽ 66)
Adverse events (patients 关events兴) Related adverse events (n patients 关n events兴) diarrhea, dyspepsia, dyspnea, dizziness, chest pain, back pain, and increased sweating Serious adverse events (all unrelated; patient 关events兴) Cardiac adverse events (patients 关events兴) cardiac arrest, CHF, cardiorespiratory arrest, endocarditis, MI, and arrhythmias Blood disorders (patients 关events兴) anemia and coagulation disorders Vascular disorders (patients 关events兴) arterial stenosis, gangrene, hematoma, hot flashes, hypertension, hypotension, and TIA Infections (patients 关events兴) bronchitis, cellulitis, conjunctivitis, fungal infections, furuncles, C. difficile, line infections, pneumonia, nasopharyngitis, sepsis, skin infections, URI, and UTI
35 (104)
32 (69)
0 (0)
4 (7)
9 (14)
9 (12)
4 (4)
4 (4)
4 (6)
1 (1)
13 (21)
5 (5)
10 (13)
8 (12)
a Short-term adverse events were similar in both groups. CHF, congestive heart failure; MI, myocardial infarction; TIA, transient ischemic attack; URI, upper respiratory infection; UTI, urinary tract infection.
ysis patients have a ferritin ⬎500 ng/ml (mean ferritin nationally 576 ng/ml), and 22% are ⬎800 ng/ml, 20% have TSAT ⬍21%, and 17% have a mean hemoglobin ⬍11 g/dl (10). The mean epoetin dosage is 281 ⫾ 281 IU/kg per wk (10). The percentage of dialysis patients who met our main entry criteria are unknown, but one of the most common questions concerning anemia management in dialysis patients is how to treat patients who have a high ferritin and a low TSAT and remain anemic despite substantial epoetin dosages (3). The DRIVE study was designed to assess directly the responsiveness to intravenous iron in such a patient. All patients received a 25% increase in their epoetin dosages because this was the standard of care for treatment of anemic hemodialysis patients recommended by the KDOQI guidelines
(1). Although a study design without an epoetin dosage increase may have been more desirable, it would have been very difficult to find sites that would agree to participate in the study because a hemoglobin ⬍11 g/dl is a performance outcome measure, and patients and human study committees would have been reluctant to approve such management. The guidelines recommend maintaining TSAT ⬎20%. By including patients with TSAT ⱕ25%, we essentially tested whether this cutoff was discriminative. To ensure that only anemic patients who are on adequate dosages of epoetin are studied, we included only patients who were receiving epoetin ⱖ225 IU/kg per wk or cumulative dosages ⱖ22,500 IU/wk, which exceeded the median dosage in the United States in 2002 of 199.1 IU/kg per wk (11).
8
Journal of the American Society of Nephrology
The DRIVE study results indicate that 1 g of intravenous ferric gluconate is efficacious in the treatment of anemia in hemodialysis patients who are receiving above-average epoetin dosages and have ferritin ⱖ500 ng/ml, and as high as 1200 ng/ml, with concurrent TSAT ⱕ25%. Responsiveness to intravenous iron was similar when ferritin was ⱕ800 or ⬎800 ng/ml, indicating ferritin alone should not be used to guide iron therapy decisions. KDOQI text suggests consideration of iron when ferritin is ⬎500 ng/ml and TSAT is ⬍20% (9). Similarly, in this study of patients with TSAT ⱕ25%, responsiveness to intravenous iron was similar when TSAT was ⬍19 or ⱖ19%. Compared with ferritin level (ⱕ800 or ⬎800 ng/ml) and TSAT level (⬍19 or ⱖ19%), the most effective predictor of improvement in anemia was whether patients received ferric gluconate. This is consistent with previous results that were seen in patients with lower ferritin levels (7). Our results indicate that a significant portion of patients had iron-restricted erythropoiesis as a result of absolute or functional iron deficiency, despite that approximately one third were receiving maintenance iron before screening. Maintenance iron frequently is not given when ferritin is elevated, as was observed in most of our study patients. In this population, withholding iron results in a significant fall in CHr (Figure 5). After an increase in epoetin in anemic patients with high ferritin and low TSAT, a course of intravenous iron is more effective than no iron. This study also addresses the question that was posed by the 2006 KDOQI anemia CPR concerning the extent to which iron administration is effective in the setting of “an increase in ferritin level accompanied by a decrease in TSAT [that] suggests inflammation-mediated reticuloendothelial blockade” (9). This study specifically recruited patients who met the criteria for inflammation-mediated reticuloendothelial blockade per the 2006 KDOQI anemia CPR: Increased ferritin, decreased TSAT, decreased hemoglobin, and increased epoetin dosage. Furthermore, the mean CRP at baseline was well above the normal range (⬍5 mg/L). The DRIVE study results conclusively demonstrate that a course of intravenous iron is effective in overcoming inflammation-mediated reticuloendothelial blockade. The magnitude of the effect of intravenous iron relative to no iron therapy was 0.5 g/dl at 6 wk, although the responder rate was increased approximately 60% above the rate that was observed in the control group. Our short trial duration and fixed dosage of epoetin did not allow us to assess the persistence of this hemoglobin improvement or any potential epoetin-sparing benefit of iron. After completion of DRIVE, these patients returned to their routine anemia management and entered a 6-wk observational study that assessed the persistence of the higher hemoglobin and any epoetin-sparing effect of intravenous iron. The results of this study will be forthcoming. Ferritin has been the major laboratory test used to assess iron stores in dialysis patients. Both the 1997 and 2001 National Kidney Foundation’s anemia guidelines proposed maintaining ferritin between 100 and 800 ng/ml via intermittent or maintenance iron administration (1,2). Recently, the 2006 anemia CPR noted that studies that have assessed intravenous iron efficacy
J Am Soc Nephrol ●●: ●●●–●●●, ●●●●
in dialysis patients included few patients with ferritin ⬎500 ng/ml and that the normal population has uniformly sufficient iron stores when ferritin exceeds 500 ng/ml (9). The opinion of the anemia workgroup was that there was insufficient evidence to support routine intravenous iron use when ferritin exceeded 500 ng/ml. Our results provide an important piece of that missing evidence. The belief in the ineffectiveness of intravenous iron in patients with ferritin ⬎500 ng/ml is not recent and has led some to call for withholding intravenous iron when ferritin exceeds 500 ng/ml (4,12–14). This belief is based on several studies that attempted to assess the relationship between ferritin and responsiveness to intravenous iron in dialysis patients. Unfortunately, these studies suffered from many weaknesses, including lack of a control arm and inclusion of few or no patients with pretreatment ferritin ⬎500 ng/ml (4 –7,15). It is interesting that most of these studies demonstrated that ferritin was not predictive of intravenous iron responsiveness, a finding echoed in our results. This suggests that use of ferritin in isolation as a clinical marker for withholding iron therapy is misplaced, hence the statement by 2006 KDOQI anemia workgroup that clinical decisions regarding use of iron “should be guided by results of iron status tests taken together with [hemoglobin] levels and ESA [erythropoiesis-stimulating agent] dose” (9). Until now, insufficient published clinical data existed to determine whether a ferritin upper limit of 500 ng/ml or even a higher limit of 800 ng/ml excludes anemic patients who would benefit from receiving intravenous iron therapy or these limits adequately ensure intravenous iron therapy to all iron-deficient patients. Because ferritin is not predictive of iron responsiveness in this study or several studies of dialysis patients with ferritin ⬍500 ng/ml (4,5,7), it should not be used to guide therapy except when low (⬍300 ng/ml), when it is highly predictive of iron deficiency (4,5,16). Setting a specific ferritin level beyond which intravenous iron should be withheld is problematic in dialysis patients for several reasons. First, ferritin is an acute-phase reactant, increasing in response to acute and chronic inflammation (17,18). Second, the coefficient of variation of ferritin is high, even among patients who do not receive iron (19). Last, hemodialysis patients have continuing blood and iron losses, and it is reasonable in most patients to replace these ongoing losses (1,2). A ferritin limit also has been recommended as a result of safety concerns related to use of intravenous iron (12,13). The acute safety of ferric gluconate has been assessed in large, randomized trials (20 –23). We found no difference in the incidence of serious or total adverse events between groups. However, our study was neither powered for a safety assessment nor sufficiently long to assess long-term safety. In addition, we found ferric gluconate administration to have no effect on inflammation as measured by CRP. A retrospective review of more than 59,000 US dialysis patients found that intravenous iron administration was associated with improved survival in all patient subgroups, including those with ferritin ⬎500 ng/ml (24). The long-term safety of iron at all ferritin target values remains untested by randomized trials. In addition, improve-
J Am Soc Nephrol ●●: ●●●–●●●, ●●●●
High Ferritin and Intravenous Ferric Gluconate Effectiveness
ments in hemoglobin from iron and/or epoetin therapy are a surrogate for patient outcomes. This is highlighted by the direct harm that was observed with hemoglobin targets ⬎13 g/dl in randomized trials of epoetin therapy that targeted a higher versus lower hemoglobin target (25,26). Another potential concern of intravenous iron administration is iron overload and its attendant organ damage. Studies of patients with organ damage from hereditary hemochromatosis showed dramatically higher ferritin than that observed in our study or the general dialysis population (27,28). In addition, it is estimated that ⬎20 g of excess iron is necessary to result in organ damage from hemochromatosis (29 –31), an amount that few dialysis patients receive in their lifetime, even before accounting for ongoing iron losses. The increase in ferritin and TSAT that we observed after 1 g of iron is inconsistent with any serious concerns for iron overload. The control group demonstrated a significant increase in hemoglobin. This may be due to the 25% increase in epoetin dosages at randomization, although no randomized, controlled trials have assessed this. The increase in hemoglobin also may reflect resolution of an inflammatory state, improved iron mobilization, or hemoglobin cycling. Last, baseline hemoglobin could be obtained before the first dialysis treatment of the week, when values are lower as a result of greater fluid gains, whereas in-study hemoglobin levels were obtained midweek, potentially enhancing the treatment effect of both arms. The control group also demonstrated that withholding iron for 6 wk results in significant declines in ferritin and CHr, consistent with continued iron loss and worsening iron-restricted erythropoiesis. However, TSAT increased slightly. This may reflect resolution of inflammation in some patients (32) or be due to mobilization of iron from stores induced by the 25% increase in epoetin dosage. Although this mobilization was sufficient to increase the TSAT slightly, it was not sufficient to provide enough iron to maintain the CHr. CHr is not known to be affected by inflammation as TSAT is; therefore, its significant fall in the control group is consistent with worsening iron deficiency. In contrast, administration of 1 g of ferric gluconate maintained CHr, consistent with providing sufficient iron for erythropoiesis. Because the purpose of continued intravenous iron therapy is to replace ongoing iron losses, administration of low-dosage iron in these patients would be reasonable. This study assessed the effectiveness of intravenous iron in patients who had ferritin of 500 to 1200 ng/ml and simultaneous TSAT ⱕ25% and remained anemic despite receiving adequate epoetin dosages; its results cannot be extrapolated to patients with higher ferritin and TSAT ⬎25%. The KDOQI Anemia guidelines recommend maintaining TSAT ⬎20%, a cutoff that has been reported to be approximately 80% sensitive for identifying iron deficiency (4). Our use of a TSAT ⱕ25% as an entry criterion effectively tested this recommendation, and we found that responsiveness to intravenous iron was similar in patients with TSAT above and below the median of 19%. This suggests that a TSAT lower limit of 20% may be too low, but further studies are needed in a less select population than we examined here. Patients with TSAT ⬎25% may not have
iron-restricted erythropoiesis, and further study is needed in this population also. Another limitation of our trial is that no changes in epoetin dosages were allowed once patients received the initial 25% increase, whereas in clinical practice, epoetin dosages are adjusted frequently in response to changes in hemoglobin. However, this restriction allowed for assessment of the effect of intravenous iron without the confounding impact of epoetin dosage adjustments. In addition, an entry hemoglobin ⱕ11 g/dl was chosen to limit the likelihood that a marked increase in hemoglobin during the study would necessitate epoetin dosage reductions. It remains to be seen whether patients with ⬎11 g/dl hemoglobin and lower epoetin dosages would respond similarly to intravenous iron.
9
Conclusion A total of 125 mg of ferric gluconate given during eight consecutive dialysis treatments is effective treatment for anemic hemodialysis patients who have ferritin ⱖ500 ng/ml and TSAT ⱕ25% and are receiving adequate epoetin. Hemoglobin increases faster and higher after intravenous iron treatment than no iron therapy. Administration of intravenous iron in this patient population overcomes functional iron deficiency/inflammation-mediated reticuloendothelial blockade. Withholding intravenous iron in these patients can result in worsening of iron-restricted erythropoiesis.
Acknowledgments This study was proposed and designed by D.W.C., A.K.S., and W.S. Watson Laboratories funded the study, and their employees identified the study sites, monitored the collected data to ensure adherence to good clinical practices, and performed the data analyses according to the predefined statistical analysis plan and all post hoc analyses requested by the other authors. The interpretation of the data and manuscript preparation was performed by D.W.C. and reviewed and revised by all of the authors, and all revisions then were rejected or approved by D.W.C.
Disclosures D.W.C.: Consultant for Abbot, Roche, Watson Laboratories; Advisor for Amgen; Speaker for Abbott, Amgen, Watson Laboratories; Research support from Abbott, Advanced Magnetics, Amgen, Roche, Watson Laboratories. T.K.: Consultant for Baxter, Pfizer, Amgen; Research grants from Novaflux Technologies, Watson Laboratories. W.S.: Research grants from Roche, Laboratories; A.K.S.: Speaker for Watson Laboratories. Ortho-Biotech; Research grants from Watson Laboratories, Ortho-Biotech. J.E.M.: Research grants from Watson, Amgen, Roche, Ortho-Biotech; Scientific Advisor for Ortho-Biotech, Roche; Honoraria from Ortho-Biotech, Amgen. N.V.D. and A.R.R. are employees of Watson Laboratories.
References 1. IV. NKF-K/DOQI clinical practice guidelines for anemia of chronic kidney disease: Update 2000. Am J Kidney Dis 37: S182–S238, 2001 2. NKF-DOQI clinical practice guidelines for the treatment of anemia of chronic renal failure. National Kidney Founda-
10
3. 4.
5.
6.
7.
8.
9.
10.
11.
12.
13. 14.
15.
16.
17.
J Am Soc Nephrol ●●: ●●●–●●●, ●●●●
Journal of the American Society of Nephrology
tion-Dialysis Outcomes Quality Initiative. Am J Kidney Dis 30: S192–S240, 1997 Coyne DW: Iron indices: What do they really mean? Kidney Int 101: S4 –S8, 2006 Fishbane S, Kowalski EA, Imbriano LJ, Maesaka JK: The evaluation of iron status in hemodialysis patients. J Am Soc Nephrol 7: 2654 –2657, 1996 Lin JL, Chang MY, Tan DT, Leu ML: Short-term small-dose intravenous iron trial to detect functional iron deficiency in dialysis patients. Am J Nephrol 21: 91–97, 2001 Mittman N, Sreedhara R, Mushnick R, Chattopadhyay J, Zelmanovic D, Vaseghi M, Avram MM: Reticulocyte hemoglobin content predicts functional iron deficiency in hemodialysis patients receiving rHuEPO. Am J Kidney Dis 30: 912–922, 1997 Tessitore N, Solero GP, Lippi G, Bassi A, Faccini GB, Bedogna V, Gammaro L, Brocco G, Restivo G, Bernich P, Lupo A, Maschio G: The role of iron status markers in predicting response to intravenous iron in haemodialysis patients on maintenance erythropoietin. Nephrol Dial Transplant 16: 1416 –1423, 2001 US Renal Data System: USRDS 2004 Annual Data Report: Atlas of End Stage Renal Disease in the United States, Bethesda, National Institutes of Health, National Institute of Diabetes and Digestive and Kidney Diseases, 2004 KDOQI clinical practice guidelines and clinical practice recommendations for anemia in chronic kidney disease. Am J Kidney Dis 47: S11–S145, 2006 Centers for Medicaid & Medicare Services: 2005 Annual Report, End Stage Renal Disease Clinical Performance Measures Project. Am J Kidney Dis 48[Suppl 2]: S1–S106, 2006 Centers for Medicaid & Medicare Services: 2002 Annual Report, End Stage Renal Disease Clinical Performance Measures Project. Am J Kidney Dis 42[Suppl 2]: S1–S96, 2003 Aronoff GR: Safety of intravenous iron in clinical practice: Implications for anemia management protocols. J Am Soc Nephrol 15[Suppl]: S99 –S106, 2004 Fishbane S: Iron treatment: Impact of safety issues. Am J Kidney Dis 32: S152–S156, 1998 Van Wyck DB, Bailie G, Aronoff G: Just the FAQs: Frequently asked questions about iron and anemia in patients with chronic kidney disease. Am J Kidney Dis 39: 426 – 432, 2002 Chuang CL, Liu RS, Wei YH, Huang TP, Tarng DC: Early prediction of response to intravenous iron supplementation by reticulocyte haemoglobin content and high-fluorescence reticulocyte count in haemodialysis patients. Nephrol Dial Transplant 18: 370 –377, 2003 Fudin R, Jaichenko J, Shostak A, Bennett M, Gotloib L: Correction of uremic iron deficiency anemia in hemodialyzed patients: A prospective study. Nephron 79: 299 –305, 1998 Feelders RA, Vreugdenhil G, Eggermont AM, KuiperKramer PA, van Eijk HG, Swaak AJ: Regulation of iron metabolism in the acute-phase response: Interferon gamma and tumour necrosis factor alpha induce hypoferraemia, ferritin production and a decrease in circulating transferrin
18.
19.
20.
21.
22.
23.
24.
25.
26.
27.
28.
29.
30.
31. 32.
receptors in cancer patients. Eur J Clin Invest 28: 520 –527, 1998 Gabay C, Kushner I: Acute-phase proteins and other systemic responses to inflammation. N Engl J Med 340: 448 – 454, 1999 Fishbane S, Shapiro W, Dutka P, Valenzuela OF, Faubert J: A randomized trial of iron deficiency testing strategies in hemodialysis patients. Kidney Int 60: 2406 –2411, 2001 Coyne DW, Adkinson NF, Nissenson AR, Fishbane S, Agarwal R, Eschbach JW, Michael B, Folkert V, Batlle D, Trout JR, Dahl N, Myirski P, Strobos J, Warnock DG: Sodium ferric gluconate complex in hemodialysis patients. II. Adverse reactions in iron dextran-sensitive and dextrantolerant patients. Kidney Int 63: 217–224, 2003 Michael B, Coyne DW, Folkert VW, Dahl NV, Warnock DG: Sodium ferric gluconate complex in haemodialysis patients: A prospective evaluation of long-term safety. Nephrol Dial Transplant 19: 1576 –1580, 2004 Michael B, Coyne DW, Fishbane S, Folkert V, Lynn R, Nissenson AR, Agarwal R, Eschbach JW, Fadem SZ, Trout JR, Strobos J, Warnock DG: Sodium ferric gluconate complex in hemodialysis patients: Adverse reactions compared to placebo and iron dextran. Kidney Int 61: 1830 –1839, 2002 Michael B: The safety of sodium ferric gluconate complex in haemodialysis patients has been extensively evaluated. Nephrol Dial Transplant 20: 1770, 2005 Kalantar-Zadeh K, Regidor DL, McAllister CJ, Michael B, Warnock DG: Time-dependent associations between iron and mortality in hemodialysis patients. J Am Soc Nephrol 16: 3070 –3080, 2005 Besarab A, Bolton WK, Browne JK, Egrie JC, Nissenson AR, Okamoto DM, Schwab SJ, Goodkin DA: The effects of normal as compared with low hematocrit values in patients with cardiac disease who are receiving hemodialysis and epoetin. N Engl J Med 339: 584 –590, 1998 Singh AK, Szczech L, Tang KL, Barnhart H, Sapp S, Wolfson M, Reddan D: Correction of anemia with epoetin alfa in chronic kidney disease. N Engl J Med 355: 2085–2098, 2006 Guyader D, Jacquelinet C, Moirand R, Turlin B, Mendler MH, Chaperon J, David V, Brissot P, Adams P, Deugnier Y: Noninvasive prediction of fibrosis in C282Y homozygous hemochromatosis. Gastroenterology 115: 929 –936, 1998 Morrison ED, Brandhagen DJ, Phatak PD, Barton JC, Krawitt EL, El-Serag HB, Gordon SC, Galan MV, Tung BY, Ioannou GN, Kowdley KV: Serum ferritin level predicts advanced hepatic fibrosis among US patients with phenotypic hemochromatosis. Ann Intern Med 138: 627– 633, 2003 Admas PC, Deugnier Y, Moirand R, Brissot P: The relationship between iron overload, clinical symptoms, and age in 410 patients with genetic hemochromatosis. Hepatology 25: 162–166, 1997 Crawford DH, Jazwinska EC, Cullen LM, Powell LW: Expression of HLA-linked hemochromatosis in subjects homozygous or heterozygous for the C282Y mutation. Gastroenterology 114: 1003–1008, 1998 Tavill AS: Diagnosis and management of hemochromatosis. Hepatology 33: 1321–1328, 2006 Weiss G, Goodnough LT: Anemia of chronic disease. N Engl J Med 352: 1011–1023, 2005