CLINICAL RESEARCH
www.jasn.org
Ferric Gluconate Reduces Epoetin Requirements in Hemodialysis Patients with Elevated Ferritin Toros Kapoian,* Neeta B. O’Mara,† Ajay K. Singh,‡ John Moran,§ Adel R. Rizkala,储 Robert Geronemus,¶ Robert C. Kopelman,** Naomi V. Dahl,储 and Daniel W. Coyne†† *Department of Medicine, University of Medicine and Dentistry of New Jersey-Robert Wood Johnson Medical School, New Brunswick, New Jersey, †Department of Pharmacy, Dialysis Clinic, Inc, North Brunswick, New Jersey, ‡ Renal Division, Brigham and Women’s Hospital, Boston, Massachusetts, §Satellite Healthcare, Inc, Mountain View, California, 储Clinical Affairs, Watson Laboratories, Inc, Morristown, New Jersey, ¶South Florida Nephrology Associates, Ft. Lauderdale, Florida, **Bakersfield Dialysis Center, Bakersfield, California, and ††Department of Medicine, Washington University, St. Louis, Missouri
ABSTRACT The Dialysis Patients Response to IV Iron with Elevated Ferritin (DRIVE) study demonstrated the efficacy of intravenous ferric gluconate to improve hemoglobin levels in anemic hemodialysis patients who were receiving adequate epoetin doses and who had ferritin levels between 500 and 1200 ng/ml and transferrin saturation (TSAT) ⱕ25%. The DRIVE-II study reported here was a 6-wk observational extension designed to investigate how ferric gluconate impacted epoetin dosage after DRIVE. During DRIVE-II, treating nephrologists and anemia managers adjusted doses of epoetin and intravenous iron as clinically indicated. By the end of observation, patients in the ferric gluconate group required significantly less epoetin than their DRIVE dose (mean change of ⫺7527 ⫾ 18,021 IU/wk, P ⫽ 0.003), whereas the epoetin dose essentially did not change for patients in the control group (mean change of 649 ⫾ 19,987 IU/wk, P ⫽ 0.809). Mean hemoglobin, TSAT, and serum ferritin levels remained higher in the ferric gluconate group than in the control group (P ⫽ 0.062, P ⬍ 0.001, and P ⫽ 0.014, respectively). Over the entire 12-wk study period (DRIVE plus DRIVE-II), the control group experienced significantly more serious adverse events than the ferric gluconate group (incidence rate ratio ⫽ 1.73, P ⫽ 0.041). In conclusion, ferric gluconate maintains hemoglobin and allows lower epoetin doses in anemic hemodialysis patients with low TSAT and ferritin levels up to 1200 ng/ml. J Am Soc Nephrol 19: 372–379, 2008. doi: 10.1681/ASN.2007050606
In patients with chronic kidney disease, an erythropoiesis stimulating agent (ESA) and iron must be present in sufficient quantities to effectively produce red blood cells. These 2 factors are easily modifiable, and nephrologists are adept at manipulating these therapies. However, controversy remains as to how to optimize iron and ESA administration and under which circumstances benefits exceed risks. This is especially true for ESAs, which have recently acquired a boxed warning.1–3 Studies in hemodialysis patients have repeatedly shown greater use of intravenous iron invariably results in lower epoetin doses while maintaining or increasing hemoglobin (Hb)/hematocrit levels.4 –9 372
ISSN : 1046-6673/1902-372
However, these studies are hampered by various limitations, including small sample size, lack of a proper control group, and inclusion of few or no patients with baseline ferritin levels more than 500 ng/ml. Furthermore, those studies tended to in-
Received May 24, 2007. Accepted September 17, 2007. Published online ahead of print. Publication date available at www.jasn.org. Correspondence: Dr. Toros Kapoian, UMDNJ-Robert Wood Johnson Medical School, Department of Medicine/Nephrology, 1 Robert Wood Johnson Place, MEB-412B, New Brunswick, NJ 08903. Phone: 732235-4453; Fax: 732-235-6124; E-mail:
[email protected] Copyright © 2008 by the American Society of Nephrology J Am Soc Nephrol 19: 372–379, 2008
www.jasn.org
CLINICAL RESEARCH
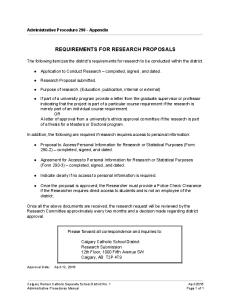
clude patients who required relatively low epoetin doses. Therefore, there is little information in the published literature on the effect of intravenous iron on epoetin doses of hemodialysis patients who are anemic despite baseline ferritin levels more than 500 ng/ml and larger epoetin doses, a picture commonly encountered in clinical practice. Minimizing the dose of ESAs may be beneficial for patients. A recent safety advisory about ESAs by the U.S. Food and Drug Administration recommended using the lowest dose possible of ESA when treating patients.1–3 The 2006 anemia guidelines by the National Kidney Foundation Kidney Disease Figure 1. A schematic of patient disposition in DRIVE-II. Outcomes Quality Initiative recommend that dose of ESA be considered as one of several factors consent (5), and death before receiving any dialysis treatments during DRIVE-II (2). Thus, 118 patients participated in when deciding to administer intravenous iron to patients.10 The Dialysis Patients Response to IV Iron with Elevated DRIVE-II. Of those, 6 patients were considered unevaluable Ferritin (DRIVE) study was a randomized controlled trial that because they did not have at least 1 wk of epoetin doses before showed that intravenous ferric gluconate was effective in im- dropping out of the study or switching to darbepoetin. Thereproving anemia in hemodialysis patients with ferritin of 500 to fore, 112 patients (56 in the control group and 56 in the intra1200 ng/ml, transferrin saturation (TSAT) ⱕ 25%, and ade- venous ferric gluconate group) were included in the ITT analquate epoetin doses,11 disproving the widely held belief that ysis of the DRIVE-II study (Figure 1). Table 1 summarizes the demographics, renal history, prepatients with ferritin more than 500 ng/ml are unlikely to benefit from intravenous iron administration.10,12,13 In the context DRIVE baseline epoetin doses, DRIVE epoetin doses, and endof an increased epoetin dose, intravenous ferric gluconate pa- of-DRIVE Hb, TSAT, and serum ferritin values. Patients in the tients were more likely to mount a hematologic response than 2 groups had similar demographics, renal history, and DRIVE controls, regardless of baseline levels of ferritin, TSAT, C-reac- epoetin doses. As previously reported, end-of-DRIVE Hb, tive protein, Hb, soluble transferrin receptor, epoetin dose, or TSAT, and serum ferritin were higher in the intravenous ferric gluconate group, but end-of DRIVE C-reactive protein levels reticulocyte Hb content.14 However, because of study design, DRIVE could not answer were similar in the 2 groups.11 During the 6-wk DRIVE-II observation period, 33 (59%) several important questions. The 6-wk duration of the DRIVE study did not permit evaluation of the sustainability of the patients (16 ferric gluconate; 17 iron sucrose) assigned to the hematologic response to intravenous iron or its effects on iron control group received supplemental intravenous iron (meindices over a longer observation period under usual clinical dian dose, 200 mg; range, 0 –1250 mg; mean ⫾ SD, 326 ⫾ 372 anemia management. More importantly, the study could not mg), compared with 22 (39%) patients (13 ferric gluconate; 9 evaluate epoetin-sparing effects of intravenous iron because iron sucrose) in the intravenous ferric gluconate group (median dose, 0 mg; range, 0 – 875 mg; mean ⫾ SD, 131 ⫾ 214 mg). epoetin dose adjustments were prohibited. The DRIVE-II study was a 6-wk, observational extension of the DRIVE study, designed to investigate the extended effects Efficacy Variables of a 1-g course of intravenous ferric gluconate on epoetin By the end of DRIVE-II, patients in the intravenous ferric gludoses, as well as Hb, TSAT, and serum ferritin under usual conate group required significantly lower epoetin doses compared with their DRIVE dose (change of ⫺7527 ⫾ 18,021 IU/ clinical management. wk, P ⫽ 0.003; median, ⫺5700 IU/wk; interquartile range, ⫺18,525 to 0 IU/wk), whereas epoetin doses were essentially unchanged in the control group (change of 649 ⫾ 19,987 IU/ RESULTS wk, P ⫽ 0.809; median, 0 IU/wk; interquartile range, ⫺375 to Of the 129 patients who were in the intent-to-treat (ITT) anal- 8250 IU/wk) (Figure 2). The difference between the 2 groups in ysis of DRIVE, 11 patients did not participate for at least one of their change in weekly epoetin dose was statistically significant the following reasons: site did not participate in this follow-up (P ⫽ 0.017, Figure 2). On average, patients who received intrastudy (1), transfer to another hemodialysis unit (1), transplan- venous ferric gluconate during DRIVE required 466 IU/kg per tation (1), vacation (1), inability/refusal to provide informed wk of epoetin (decreased from 568 ⫾ 293 IU/kg per wk) comJ Am Soc Nephrol 19: 372–379, 2008
Impact of Ferric Gluconate on Epoetin Doses
373
CLINICAL RESEARCH
www.jasn.org
Table 1. Characteristics of patients in the DRIVE-II intentto-treat analysisa Control (n ⴝ 56) Age, yr 58.8 ⫾ 15.5 Females, n (%) 32 (57.1) Weight, kg 74.9 ⫾ 22.9 Height, cm 168.2 ⫾ 9.5 Race, n (%) white 17 (30.4) black 28 (50.0) Hispanic 8 (14.3) Asian/Pacific Islander 2 (3.6) other 1 (1.8) Etiology of CKD stage 5, n (%) diabetes 21 (37.5) hypertension 21 (37.5) glomerulonephritis 7 (12.5) cystic disease 2 (3.6) other 6 (10.7) Type of HD access, n (%) AV graft 18 (32.1) AV fistula 25 (44.6) temporary catheter 3 (5.4) permanent catheter 10 (17.9) DRIVE epoetin dose, 1000 IU/wk 45.0 ⫾ 23.5 median (interquartile range) 37.7 (29.7–54.6) hs-CRP at end of DRIVE, mg/L median (interquartile range) 16.9 (5.5–38.6)
IV Ferric Gluconate (n ⴝ 56) 60.7 ⫾ 13.5 25 (44.6) 78.6 ⫾ 21.2 167.4 ⫾ 10.5 19 (33.9) 27 (48.2) 7 (12.5) 3 (5.4) 0 (0.0) 22 (39.3) 20 (35.7) 7 (12.5) 0 (0.0) 8 (14.3) 17 (30.4) 28 (50.0) 2 (3.6) 9 (16.1) 43.7 ⫾ 22.4 37.5 (26.9–54.8) 13.2 (4.6–25.3)
HD, hemodialysis; AV, arteriovenous; CRP, high sensitivity C-reactive protein. a Except where stated, all continuous variables are summarized in the form of mean ⫾ SD. For between-group comparisons, all P values ⬎0.245.
Figure 2. Epoetin dose throughout DRIVE-II. Baseline weekly epoetin doses were similar in the 2 groups, resulting in similar DRIVE epoetin doses. By wk 12, epoetin doses had dropped significantly lower in the intravenous ferric gluconate group (solid line) than the control (dashed line) (P ⫽ 0.017). Final epoetin doses were similar to their baseline (pre-25% epoetin dose increase) counterparts in the intravenous ferric gluconate group (P ⫽ not significant), whereas they were significantly higher in the control group (P ⬍ 0.05).
pared with 644 IU/kg per wk in their control counterparts (essentially unchanged from 639.2 ⫾ 360.5 IU/kg per wk). By the end of DRIVE-II, weekly epoetin doses had decreased to levels similar to pre-DRIVE doses in the intravenous ferric gluconate group while remaining significantly higher in the con374
Journal of the American Society of Nephrology
trol group (Figure 2). The reduction in epoetin dose was not related to the patient’s initial ferritin stratum (ⱕ800 ng/ml versus ⬎801 ng/ml) (Table 2). Despite the reduction in epoetin doses, significantly more of the intravenous ferric gluconate patients maintained their Hb above 11.0 g/dl (83.9%) than control patients (67.9%; P ⬍ 0.05). Hemoglobin, TSAT, and serum ferritin levels remained higher in the intravenous ferric gluconate group (Figures 3 through 5) than in the control group (P ⫽ 0.062, P ⬍ 0.001, and P ⫽ 0.014, respectively) at the end of DRIVE-II. Comparing the changes from the end of DRIVE (wk 6) to DRIVE-II endpoint (wk 12), there were no significant differences between groups in the change in Hb, TSAT, or serum ferritin. Hemoglobin change from end-of-DRIVE was 0.2 ⫾ 1.3 g/dl and 0.2 ⫾ 1.2 g/dl in the control and intravenous ferric gluconate groups, respectively (P ⫽ 0.432). TSAT change from end-of-DRIVE was ⫺1.6 ⫾ 7.0% points in the control (P ⫽ 0.13) and ⫺0.6 ⫾ 14.9% points and intravenous ferric gluconate groups (P ⫽ not significant), respectively. Ferritin levels increased by 35 ⫾ 241 ng/ml in the control group (P ⫽ not significant) and fell by 92 ⫾ 217 ng/ml in the intravenous ferric gluconate group (P ⫽ 0.009). In patients randomized to 1 g of ferric gluconate during DRIVE, as well as any additional iron that may have been given during the 6 wk of DRIVE-II, no significant increase in serum ferritin compared with baseline was noted at end of study, regardless of initial serum ferritin stratification (Table 2). Treatment during DRIVE and/or DRIVE-II had little impact on increasing the number of patients in higher ferritin ranges. Among patients initially in the lower ferritin stratum (baseline ferritin ⱕ800 ng/ml) who had at least one ferritin value during DRIVE-II, 3 of 26 (11.5%) and 6 of 27 (22.2%) patients in the control and intravenous ferric gluconate groups, respectively, had a ferritin level more than 800 ng/ml at the end of DRIVEII. Similarly, in patients initially in the upper ferritin stratum (baseline ferritin ⬎800 ng/ml) and who had at least one ferritin value during DRIVE-II, 2 of 16 (12.5%) control patients and 3 of 15 (20.0%) intravenous ferric gluconate patients had a ferritin level more than 1200 ng/ml at the end of DRIVE-II. There were 23 patients in the control group who received no intravenous iron during DRIVE-II. Their target epoetin DRIVE dose and epoetin dose at the end of DRIVE-II were 49,626 ⫾ 29,666 IU/wk and 52,195 ⫾ 32,176 IU/wk, respectively (P ⫽ 0.562). By the end of DRIVE-II, their Hb values had not changed since the end of DRIVE (11.4 ⫾ 1.8 versus 11.4 ⫾ 1.7 g/dl; P ⫽ 0.953). Their serum ferritin tended to drop from 612 ⫾ 218 ng/ml to 534 ⫾ 245 ng/ml (P ⫽ 0.077) while their TSAT increased from 21.4 ⫾ 2.8% to 24.9 ⫾ 5.9% (P ⫽ 0.033). Although there was a trend toward lower epoetin dose in the control patients who received intravenous iron during DRIVE-II, this did not reach statistical significance. The mean change in epoetin dose between the 33 who received intravenous iron during DRIVE-II was ⫺690 ⫾ 19,231 IU/wk (median, 0 IU/wk; interquartile range, 0 – 6800 IU/wk) versus 2570 ⫾ 20,455 IU/wk (median, 0 IU/wk; interquartile range, J Am Soc Nephrol 19: 372–379, 2008
www.jasn.org
CLINICAL RESEARCH
Table 2. Summary of epoetin, hemoglobin, transferrin saturation, and serum ferritin throughout DRIVE and DRIVE-II stratified by baseline serum ferritin Baseline Ferritin Stratum ⱕ800 ng/ml n epoetin dose, Hb, g/dl TSAT, %a serum ferritin, ⬎ 800 ng/ml n epoetin dose; Hb, g/dl TSAT, %b serum ferritin,
IU/kg per wk
ng/mla
IU/kg per wk
ng/mlb
Control
IV Ferric Gluconate
Baseline
End of DRIVE
End of DRIVE-II
Baseline
End of DRIVE
End of DRIVE-II
543 ⫾ 329 10.2 ⫾ 0.7 18.7 ⫾ 3.6 631 ⫾ 86
33 679 ⫾ 411 11.4 ⫾ 1.1 19.9 ⫾ 6.4 453 ⫾ 172
671 ⫾ 451 11.5 ⫾ 1.1 17.6 ⫾ 6.2 506 ⫾ 274
438 ⫾ 253 10.3 ⫾ 0.9 18.7 ⫾ 3.6 622 ⫾ 89
34 548 ⫾ 317 11.9 ⫾ 1.4 25.5 ⫾ 6.1 798 ⫾ 184
445 ⫾ 281 12.0 ⫾ 1.4 23.7 ⫾ 12.8 698 ⫾ 179
466 ⫾ 216 10.1 ⫾ 0.8 19.6 ⫾ 4.5 923 ⫾ 135
23 582 ⫾ 271 11.4 ⫾ 1.6 22.5 ⫾ 4.6 762 ⫾ 292
605 ⫾ 346 11.7 ⫾ 1.8 21.9 ⫾ 6.3 717 ⫾ 278
480 ⫾ 207 10.3 ⫾ 0.7 17.5 ⫾ 4.8 968 ⫾ 122
22 600 ⫾ 257 12.0 ⫾ 1.3 26.4 ⫾ 8.6 1139 ⫾ 288
500 ⫾ 354 12.3 ⫾ 1.3 25.9 ⫾ 18.3 995 ⫾ 345
Hb, hemoglobin; TSAT, transferrin saturation. a Based on 31 patients in the control group and 33 patients in the IV ferric gluconate group. b Based on 22 patients in each treatment group.
Figure 3. Hemoglobin values throughout DRIVE-II. Ferric gluconate (solid line); control (dashed line).
⫺2475 to 16,050 IU/wk) in the 23 patients who did not (P ⫽ 0.401, analysis of covariance controlling for DRIVE-II baseline epoetin dose). A total of 39 intravenous ferric gluconate patients received the entire 1 g of ferric gluconate and experienced no major protocol deviations during DRIVE. Median amount of intravenous iron received by this subgroup during DRIVE-II was 0 mg (interquartile range, 0 –187.5 mg). In this subgroup, epoetin doses dropped from 42,119 ⫾ 21,174 IU/wk to 33,124 ⫾
Figure 5. Serum ferritin at baseline, end of DRIVE (wk 6), and end of DRIVE-II (wk 12). Ferric gluconate (solid line); control (dashed line).
24,815 IU/wk (P ⫽ 0.004). Hemoglobin levels were stable from end of DRIVE to end of DRIVE-II (12.0 ⫾ 1.2 g/dl versus 12.0 ⫾ 1.3 g/dl; P ⫽ not significant). Serum ferritin dropped from 916 ⫾ 285 ng/ml to 556 ⫾ 280 ng/ml (P ⬍ 0.001), and TSAT was unchanged (end of DRIVE 26.3 ⫾ 6.2% versus end of DRIVE-II 27.1 ⫾ 17.4%; P ⫽ 0.755). Safety Analyses
Figure 4. Transferrin saturation at baseline, end of DRIVE (wk 6), and end of DRIVE-II (wk 12). Ferric gluconate (solid line); control (dashed line). J Am Soc Nephrol 19: 372–379, 2008
Table 3 summarizes the observed serious adverse events (SAEs) by body system. During the entire 12-wk study period, 38 SAEs were experienced by 20 patients in the control group and 22 SAEs were experienced by 15 patients in the intravenous ferric gluconate group. Of those, 24 SAEs occurred in 13 control patients and 10 SAEs occurred in 8 intravenous ferric gluconate patients during DRIVE-II. There was no significant difference in the incidence of serious adverse events occurring during the 6-wk DRIVE-II period alone. However, a post hoc analysis using Poisson regression over the entire 12-wk study period (DRIVE plus DRIVE-II) demonstrated a 0.58 incidence rate ratio for hav-
Impact of Ferric Gluconate on Epoetin Doses
375
CLINICAL RESEARCH
www.jasn.org
Table 3. Serious adverse events occurring during the entire 12-wk observation period (DRIVE and DRIVE-II) by MedRA classification
Cumulative observation period, patient-wk Serious adverse events,a patients (events) Cardiac events, patients (events): cardiac arrest, CHF and aggravation thereof, cardiorespiratory arrest, endocarditis, MIs, pulmonary edema, and arrhythmias Gastrointestinal disorders, patients (events): abdominal pain, ischemic colitis, gastric erosions, acute pancreatitis, and peritonitis Vascular disorders, patients (events): gangrene, hematoma, hypertension, hypotension, and TIA Infections, patients (events): cellulitis, clostridial gastroenteritis, implant infections, pneumonia, sepsis, and skin and subcutaneous abscesses Others, patients (events)
Control (n ⴝ 66)
IV Ferric Gluconate (n ⴝ 66)
679 20 (38) 9 (10)
680 15 (22) 6 (6)
4 (4)
1 (2)
4 (4)
3 (3)
10 (12)
4 (4)
8 (8)
7 (7)
CHF, congestive heart failure; MedRA, Medical Dictionary for Regulatory Activities; MIs, myocardial infarctions; TIA, transient ischemic attack. a Short-term adverse events were similar in both groups.
ing an SAE in the intravenous ferric gluconate group compared with the control group (P ⫽ 0.041). DISCUSSION
These results show that administration of 1 g of intravenous ferric gluconate to patients meeting our inclusion criteria results in significantly lower epoetin requirements at 12 wk. Compared with those not initially given intravenous iron, administration of intravenous iron allowed achievement of a greater initial increase in Hb and TSAT, and patients maintained those differences for at least 12 wk. However, increases in Hb must be closely monitored to minimize the potential risks associated with a rapidly rising Hb as well as a concentration more than 12 g/dl.14 –16 The proportional reduction in the epoetin dose observed in our study is similar to that reported following iron administration to dialysis patients with overt iron deficiency (TSAT ⬍20% and ferritin ⬍100 ng/ml).17,18 However, those studies were small (ⱕ30 patients), and the absolute units of epoetin reduction were much smaller than achieved in our study, which selected patients on higher epoetin doses. Similarly, administration of intravenous iron to patients considered to be “iron-replete” (ferritin ⱕ600 ng/ml or TSAT ⬎20%) has shown effective epoetin dose reductions and resultant cost savings.4,5,7,19 –21 Until now, there has been little information on the effect of intravenous iron on patients with ferritin levels more than 500 to 600 ng/ml. A reduction in epoetin requirements is one benefit seen in patients who are treated with intravenous iron preparations. In DRIVE-II, this was accomplished without further rise in serum ferritin. After intravenous iron, mean ferritin increased from baseline (761 ng/ml) to 934 ng/ml at 6 wk, then fell to 802 ng/ml at 12 wk (P ⫽ NS versus baseline). The increase in ferritin at 6 wk is similar to that observed after 1 g of iron administered to iron-deficient patients.22,23 The reduction in ferritin toward baseline over a 12-wk period is also similar to previous reports.7,17 376
Journal of the American Society of Nephrology
Some experts have expressed concern that administration of intravenous iron to patients with an elevated ferritin may increase infection rate or infectious complications. The proposed risk of infections from intravenous iron should coincide with intravenous iron administration or follow shortly thereafter. Over the 12 wk of the DRIVE and DRIVE-II studies, we observed less risk of hospitalizations from infections among patients given 1 g of intravenous ferric gluconate compared with the control group. The lack of difference in rates of infections between intravenous ferric gluconate and control may not be generalizable to all intravenous iron preparations. Different rates of bacteremia have been reported with different intravenous iron preparations in patients on maintenance hemodialysis.24 DRIVE-II demonstrates that a 1-g load of intravenous ferric gluconate results in a significant reduction in epoetin dose. Randomized trials of higher versus lower Hb targets have repeatedly shown increased risk of cardiovascular events or death in the high target arm.15,25 Because of design, the high target arm invariably requires substantially more epoetin.26 In March 2007, the U.S. Food and Drug Administration amended the labeling of all epoetin and darbepoetin products by adding a boxed warning instructing prescribers to “use the lowest dose of ESAs that will gradually increase the Hb concentration to the lowest level sufficient to avoid the need for red blood cell transfusion.”1–3 The statement warns prescribers that, “. . . ESAs increased the risk for death and for serious cardiovascular events when dosed to achieve a target a Hb of greater than 12 g/dl.” The dosage instructions were amended to advise against allowing Hb levels to exceed 12 g/dl.1–3 Regardless of serum ferritin or TSAT values, administration of intravenous iron to patients on hemodialysis has been shown to be associated with lower risk of all-cause and cardiovascular mortality.27 Furthermore, to date, no studies have shown an increased risk of mortality with use of intravenous iron at any TSAT or ferritin value. Over a 12-wk period, we observed a significantly lower incidence of SAEs among paJ Am Soc Nephrol 19: 372–379, 2008
www.jasn.org
tients receiving intravenous iron during DRIVE. The finding that there were more adverse events in the control group, although counterintuitive, may suggest that iron deficiency can be associated with worse and/or more frequent adverse events. The DRIVE-II study demonstrates using intravenous ferric gluconate in patients with ferritin between 500 and 1200 ng/ml minimizes their ESA dose requirements while maintaining Hb levels. No safety concerns were raised in this trial. This study has several weaknesses. DRIVE-II was a 6-wk observational trial during which adjustments to epoetin dose and intravenous iron therapy were at the discretion of the individual dialysis unit. Although the level of evidence provided by an observational study does not carry the same weight as a randomized control trial, DRIVE-II provides much needed clinical information in this subgroup of anemic hemodialysis patients. During the 6 wk of DRIVE-II, investigators were not restricted in their use of or type of iron product administered. More than half of the control group was given intravenous iron during DRIVE-II, and almost half of all iron administered was in the form of iron sucrose. In this study, the control group required more intravenous iron in addition to higher epoetin doses postintervention, which may indicate that the residual effect of depriving iron when needed may be prolonged. Because both DRIVE and DRIVE-II were unblinded, knowledge of treatment group may have influenced DRIVE-II treatment decisions. Although black patients were overrepresented (⬃50% of study population) in DRIVE-II, it is unknown if there are racial differences in patient responsiveness to epoetin and intravenous iron preparations. Finally, DRIVE-II relied on Hb, TSAT, and ferritin values that were obtained from the local laboratory of each individual dialysis unit. We did not collect data investigating the variability between local laboratory values and those of the central laboratory used in the DRIVE study. It is unclear if this may have influenced our findings. Although we observed no difference in cardiovascular events or mortality between the 2 groups over the 12-week study period (DRIVE and DRIVE-II), this study is neither sufficiently long nor large to fully assess these risks. Another limitation of DRIVE-II is the fact that Hb, TSAT, and ferritin values collected depended on the patients’ dialysis units’ biochemical evaluation schedules. Data were available only if the scheduled biochemical assessments fell within the 6-wk DRIVE-II observation period. Although at least one Hb value was recorded for virtually every study participant, there were some who were missing less frequently assessed indices, such as TSAT and serum ferritin. It is possible, although unlikely, that the missing data may have qualitatively affected our conclusions. We also only tested ferric gluconate administered as 125 mg for 8 consecutive dialysis sessions. Other iron products or different administration regimens could have differing effects related to efficacy, safety, and the changes in TSAT, ferritin, and other iron markers. Conclusion
A 1-g loading course of intravenous ferric gluconate effectively and safely reduces epoetin doses in hemodialysis patients with J Am Soc Nephrol 19: 372–379, 2008
CLINICAL RESEARCH
Table 4. Inclusion and exclusion criteria for DRIVE11 Inclusion criteria age 18 yr or older receiving chronic HD for at least 90 days TSAT ⱕ 25%, serum ferritin 500 ng/ml to 1200 ng/ml, and Hb ⱕ 11.0 g/dl epoetin dose ⱖ 225 units/kg per wk or ⱖ22,500 units/wk, with no change in dose or method of administration for ⱖ14 days received no more than 125 mg of IV iron in any of the 4 wk preceding screening Exclusion criteria use of any investigational agent within 30 days before first day of study treatment lactating or positive pregnancy test, if applicable known sensitivity to ferric gluconate or any of its components evidence of active infection requiring systemic antibiotic therapy at screening surgical procedure planned within the next 8 wk evidence of significant blood loss within the previous 6 wk history of sickle cell or sickled hemoglobin C disease or hematologic malignancies more than 3 missed hemodialysis treatments during the 8 wk before screening blood transfusion within the previous 4 wk before screening inpatient hospitalization within 2 wk before screening HD, hemodialysis; TSAT, transferrin saturation; Hb, hemoglobin; IV, intravenous.
low TSAT and serum ferritin levels less than or equal to 1200 ng/ml while maintaining optimal Hb levels. The magnitude of this epoetin dose reduction is similar to that seen in many reports of patients having classic iron deficiency. Accordingly, this study provides additional evidence to support the conclusion of the DRIVE study that intravenous iron is beneficial in maintaining Hb concentration while decreasing epoetin doses in anemic hemodialysis patients with a low TSAT and ferritin levels up to 1200 ng/ml.
CONCISE METHODS This study was conducted in compliance with the Declaration of Helsinki. All participating sites obtained approval of their respective institutional review boards before collecting any study data. All study participants provided informed consent before undergoing any study procedures. This trial was registered with the United States National Institutes of Health through the National Library of Medicine at http://clinicaltrials.gov.
Patient Selection
Patients who participated in DRIVE were eligible for participation in DRIVE-II once their involvement in DRIVE concluded. The DRIVE study design and population were previously described.11 Briefly, this was an open-label, randomized, controlled, multicenter trial conducted in 37 centers across the United States. The inclusion and exclusion criteria are presented in Table 4. Impact of Ferric Gluconate on Epoetin Doses
377
CLINICAL RESEARCH
www.jasn.org
Figure 6. A schematic of the study procedures of DRIVE and DRIVE-II. L, comprehensive laboratory testing; H, hemoglobin and reticulocyte hemoglobin content (CHr) testing; X, 125 mg intravenous ferric gluconate administration.
Study Procedures
Study Objectives
The study procedures of DRIVE and DRIVE-II are depicted in Figure 6. The DRIVE study procedures and results have been previously described in detail.11 Participants were centrally randomized 1:1 to receive either no iron (control) or 1 g of ferric gluconate (Ferrlecit, Watson Laboratories, Morristown, NJ) administered as eight consecutive 125-mg doses beginning with the first hemodialysis session of wk 1 (intravenous iron group). Baseline epoetin doses were increased 25% in both groups at the first hemodialysis session of wk 1, then held constant throughout the DRIVE 6-wk duration except for safety reasons. No additional iron (intravenous or oral) or intravenous ascorbic acid was given during DRIVE. Comprehensive hematology and serum chemistry panels were obtained at baseline (wk 0) and endpoint (wk 6), and Hb was measured weekly. Once patients completed their involvement in DRIVE (study completion at wk 6, or early withdrawal), they returned to the routine anemia management at their facility. The immediate 6 wk following exiting DRIVE constituted the observational study, DRIVE-II. During DRIVEII, epoetin dose adjustments and use of intravenous iron therapy were at the discretion of anemia managers and the patients’ physicians. Dialysis units were allowed to use any intravenous iron formulation (dextran, ferric gluconate, or sucrose). Hb, TSAT, and ferritin levels were obtained per the HD units’ policies through their local laboratories. Information regarding the doses of administered epoetin and intravenous iron was collected, as were Hb, TSAT, and serum ferritin levels of each participant. SAEs were also recorded. The definition of an SAE was that adopted by the International Conference on Harmonization, which is any adverse event that results in any of the following outcomes: death, a life-threatening experience, inpatient hospitalization or prolongation of existing hospitalization, a persistent or significant disability/incapacity, or a congenital anomaly/birth defect.28
The predefined primary objective of the study was to compare the effects of study treatments given during DRIVE on the epoetin dose administered to patients at 12 wk after the start of treatment (i.e., the difference between groups in change from weekly DRIVE epoetin dose to the wk 12 epoetin dose). In the event that a patient did not complete DRIVE-II or was switched to darbepoetin, the total of the final week of recorded epoetin doses was carried forward and considered the DRIVE-II endpoint dose (wk 12, last observation carried forward). Secondary objectives of DRIVE-II include comparisons between the groups in mean change from end-of-DRIVE Hb, TSAT, and serum ferritin to their corresponding measurements at DRIVE-II endpoint (wk 12 last observation carried forward).
378
Journal of the American Society of Nephrology
Statistical Analysis Patients who were in the ITT analysis of the DRIVE study and received at least 1 wk of epoetin doses during the DRIVE-II study period were included in the ITT analysis of DRIVE-II. Continuous variables were summarized using mean ⫾ SD or medians and interquartile ranges. Categorical variables were summarized using frequencies and percentages. Change in weekly epoetin doses, Hb, TSAT, and serum ferritin were analyzed using analysis of covariance with the DRIVE epoetin dose, end-of-DRIVE Hb, end-ofDRIVE TSAT, and end-of-DRIVE serum ferritin as covariates. Comparisons between groups in DRIVE-II endpoint values of all continuous variables were conducted using unpaired t test, whereas within-group changes were conducted using paired t test. Statistical significance was determined at the alpha ⫽ 0.05 level. Statistical analyses were conducted using SAS 8.2 (SAS Institute, Cary, NC). J Am Soc Nephrol 19: 372–379, 2008
www.jasn.org
ACKNOWLEDGMENTS This study was sponsored by Watson Laboratories, Inc. Presented in part at the Annual Meeting of the American Society of Nephrology; November 14-19, 2006, San Diego, California.
DISCLOSURES T.K.: Grant/research support: Watson, Novaflux Technologies; Consultant: Baxter Healthcare, Pfizer, Amgen. A.K.S.: Consulting: Merck, Wyeth, Genzyme, Abbott, Roche; Research: Amgen, Johnson and Johnson, Watson, Roche, Genentech; Speaker: Amgen, Johnson and Johnson, Watson, Genzyme, Abbott. A.R.R.: Employee of Watson Laboratories, Inc. at the time of study conduct. R.G.: Research: Amgen, Watson, Ortho, Advanced Magnetics, Fresenius; Advisory boards: Amgen; Speaker: Amgen, Watson, Ortho, Novartis, Abbot, Genzyme, Merck. N.V.D.: Employee of Watson Laboratories. D.W.C.: Consultant: Watson, Roche, and Amgen; Speaker: Watson and Amgen; Research support: Watson, Roche, Amgen, and Advanced Magnetics.
REFERENCES 1. Amgen Inc: Aranesp prescribing information, Thousand Oaks, CA, Amgen, 2007 2. Amgen Inc: Epogen prescribing information, Thousand Oaks, CA, Amgen, 2007 3. Ortho-Biotech: Procrit prescribing information, Bridgewater, NJ, Ortho Biotech Products, 2007 4. Besarab A, Amin N, Ahsan M, Vogel SE, Zazuwa G, Frinak S, Zazra JJ, Anandan JV, Gupta A: Optimization of epoetin therapy with intravenous iron therapy in hemodialysis patients. J Am Soc Nephrol 11: 530 –538, 2000 5. Chang CH, Chang CC, Chiang SS: Reduction in erythropoietin doses by the use of chronic intravenous iron supplementation in iron-replete hemodialysis patients. Clin Nephrol 57: 136 –141, 2002 6. DeVita MV, Frumkin D, Mittal S, Kamran A, Fishbane S, Michelis MF: Targeting higher ferritin concentrations with intravenous iron dextran lowers erythropoietin requirement in hemodialysis patients. Clin Nephrol 60: 335–340, 2003 7. Fishbane S, Frei GL, Maesaka J: Reduction in recombinant human erythropoietin doses by the use of chronic intravenous iron supplementation. Am J Kidney Dis 26: 41– 46, 1995 8. Kaneko Y, Miyazaki S, Hirasawa Y, Gejyo F, Suzuki M: Transferrin saturation versus reticulocyte hemoglobin content for iron deficiency in Japanese hemodialysis patients. Kidney Int 63: 1086 –1093, 2003 9. Taylor JE, Peat N, Porter C, Morgan AG: Regular low-dose intravenous iron therapy improves response to erythropoietin in haemodialysis patients. Nephrol Dial Transplant 11: 1079 –1083, 1996 10. National Kidney Foundation Kidney Disease Outcomes Quality Initiative: Clinical practice guidelines and clinical practice recommendations for anemia in chronic kidney disease. Am J Kidney Dis 47: S11-S145, 2006 11. Coyne DW, Kapoian T, Suki W, Singh AK, Moran JE, Dahl NV, Rizkala AR: Ferric gluconate is highly efficacious in anemic hemodialysis patients with high serum ferritin and low transferrin saturation: results of the Dialysis Patients’ Response to IV Iron with Elevated Ferritin (DRIVE) Study. J Am Soc Nephrol 18: 975–984, 2007
J Am Soc Nephrol 19: 372–379, 2008
CLINICAL RESEARCH
12. Aronoff GR: Safety of intravenous iron in clinical practice: implications for anemia management protocols. J Am Soc Nephrol 15: S99-S106, 2004 13. Van Wyck DB, Bailie G, Aronoff G: Just the FAQs: frequently asked questions about iron and anemia in patients with chronic kidney disease. Am J Kidney Dis 39: 426 – 432, 2002 14. Singh AK, Coyne DW, Shapiro W, Rizkala AR: Predictors of response to anemia treatment in hemodialysis patients with high serum ferritin and low transferrin saturation. Kidney Int 71: 1163–1171, 2007 15. Singh AK, Szczech L, Tang KL, Barnhart H, Sapp S, Wolfson M, Reddan D, CHOIR Investigators: Correction of anemia with epoetin alfa in chronic kidney disease. N Engl J Med 355: 2085–2098, 2006 16. Drueke TB, Locatelli F, Clyne N, Eckardt KU, MacDougal IC, Tsakiris D, Burger HU, Scherhag A, CREATE Investigators: Normalization of hemoglobin level in patients with chronic kidney disease and anemia. N Engl J Med 355: 2071–2084, 2006 17. Fishbane S, Lynn RI: The efficacy of iron dextran for the treatment of iron deficiency in hemodialysis patients. Clin Nephrol 43: 238 –240, 1995 18. Park L, Uhthoff T, Tierney M, Nadler S: Effect of an intravenous iron dextran regimen on iron stores, hemoglobin, and erythropoietin requirements in hemodialysis patients. Am J Kidney Dis 31: 835– 840, 1998 19. Macdougall IC, Tucker B, Thompson J, Tomson CR, Baker LR, Raine AE: A randomized controlled study of iron supplementation in patients treated with erythropoietin. Kidney Int 50: 1694 –1699, 1996 20. Schiesser D, Binet I, Tsinalis D, Dickenmann M, Keusch G, Schmidli M, Ambuhl PM, Luthi L, Wuthrich RP: Weekly low-dose treatment with intravenous iron sucrose maintains iron status and decreases epoetin requirement in iron-replete haemodialysis patients. Nephrol Dial Transplant 21: 2841–2845, 2006 21. Sepandj F, Jindal K, West M, Hirsch D: Economic appraisal of maintenance parenteral iron administration in treatment of anaemia in chronic haemodialysis patients. Nephrol Dial Transplant 11: 319 –322, 1996 22. Nissenson AR, Lindsay RM, Swan S, Seligman P, Strobos J: Sodium ferric gluconate complex in sucrose is safe and effective in hemodialysis patients: North American Clinical Trial. Am J Kidney Dis 33: 471– 482, 1999 23. Warady BA, Zobrist RH, Wu J, Finan E, Ferrlecit Pediatric Study Group: Sodium ferric gluconate complex therapy in anemic children on hemodialysis. Pediatr Nephrol 20: 1320 –1327, 2005 24. Sirken G, Raja R, Rizkala AR: Association of different intravenous iron preparations with risk of bacteremia in maintenance hemodialysis patients. Clin Nephrol 66: 348 –356, 2006 25. Besarab A, Bolton WK, Browne JK, Egrie JC, Nissenson AR, Okamoto DM, Schwab SJ, Goodkin DA: The effects of normal as compared with low hematocrit values in patients with cardiac disease who are receiving hemodialysis and epoetin. N Engl J Med 339: 584 –590, 1998 26. Vaziri ND: Cardiovascular effects of erythropoietin and anemia correction. Curr Opin Nephrol Hypertens; 10: 633– 637, 2001 27. Kalantar-Zadeh K, Regidor DL, McAllister CJ, Michael B, Warnock DG: Time-dependent associations between iron and mortality in hemodialysis patients. J Am Soc Nephrol 16: 3070 –3080, 2005 28. International Conference on Harmonization of Technical Requirements for Registration of Pharmaceuticals for Human Use: Guideline for Good Clinical Practice. http://www.fda.gov/cder/guidance/959fnl.pdf
Impact of Ferric Gluconate on Epoetin Doses
379