Gallbladder Epithelial Cell Hydraulic Water Permeability and Volume Regulation BO-ERIC PERSSON and KENNETH R. SPRING From the Laboratory of Kidney and Electrolyte Metabolism, National Heart, Lung, and Blood Institute, Bethesda, Maryland 20205
INTRODUCTION
The hydraulic water permeability (Lp) of the cell membranes of gallbladder epithelial cells has not been directly measured . Lp measurements are difficult Address reprint requests to Dr . Kenneth R . Spring, Laboratory of Kidney and Electrolyte Metabolism, National Heart, Lung, and Blood Institute, Building 10, Room 6N307, National Institutes of Health, Bethesda, Md . 20205 . Dr. Persson's present address is Dept . of Physiology and Biophysics, University of Uppsala, Biomedical Center, Box 572, S-75123 Uppsala, Sweden . © The Rockefeller University Press " 0022-1295/82/03/0481/25 $1 .00 Volume 79 March 1982 481-505
J . GEN . PHYSIOL .
481
Downloaded from www.jgp.org on March 2, 2006
The hydraulic water permeability (LP) of the cell membranes of Necturus gallbladder epithelial cells was estimated from the rate of change of cell volume after a change in the osmolality of the bathing solution . Cell volume was calculated from computer reconstruction of light microscopic images of epithelial cells obtained by the "optical slice" technique. The tissue was mounted in a miniature Ussing chamber designed to achieve optimal optical properties, rapid bath exchange, and negligible unstirred layer thickness . The control solution contained only 80% of the normal NaCl concentration, the remainder of the osmolality was made up by mannitol, a condition that did not significantly decrease the fluid absorption rate in gallbladder sac preparations . The osmotic gradient ranged from 11 .5 to 41 mosmol and was achieved by the addition or removal of mannitol from the perfusion solutions . The Lp of the apical mem. osmol (Po n, = 0 .055 cm/s) and that of the brane of the cell was 1 .0 X 10-3 CM/S basolateral membrane was 2 .2 X 10-3 Cm/s " osmol (P. = 0.12 cm/s) . These values were sufficiently high so that normal fluid absorption by Necturus gallbladder could be accomplished by a 2 .4-mosmol solute gradient across the apical membrane and a 1 .1-mosmol gradient across the basolateral membrane . After the initial cell shrinkage or swelling resulting from the anisotonic mucosal or serosal medium, cell volume returned rapidly toward the control value despite the fact that one bathing solution remained anisotonic . This volume regulatory response was not influenced by serosal ouabain or reduction of bath NaCl concentration to 10 mM . Complete removal of mucosal perfusate NaCl abolished volume regulation after cell shrinkage . Estimates were also made of the reflection coefficient for NaCl and urea at the apical cell membrane and of the velocity of water flow across the cytoplasm . ABSTRACT
482
THE JOURNAL OF GENERAL PHYSIOLOGY " VOLUME
79 " 1982
' A variety of units is used to report Lp and P. values. P. = RTLP , where R is the gas w
constant, T is temperature, Vw. is the partial molar volume of water. P. has the units of centimeters per second or micrometers per second . The conversion factors are as follows: 1 cm/ s = 7.386 X 10⁻⁴ cm/s .atm = 18 .07 X 10 -3 cm/s . mosmol = 10,000 ,,m/s.
Downloaded from www.jgp.org on March 2, 2006
in leaky epithelia for two reasons: first, unstirred layers adjacent to the epithelium greatly alter the magnitude and nature of imposed osmotic gradients (Diamond, 1979 ; Pedley and Fischbarg, 1980) ; second, the presence of a shunt pathway precludes the estimation of cell membrane L p from measurements of epithelial Lp (Diamond, 1979) . When epithelial Lp was measured with care to minimize or correct for unstirred layer effects, the values obtained were far greater than previously reported . The osmotic water permeability of the rabbit proximal convoluted renal tubule, determined in isolated, perfused tubule preparations, was 1,9005,100 1,m/s1 (Andreoli et al., 1978) . The osmotic water permeability of the rabbit gallbladder epithelium, measured by the application of small hydrostatic or osmotic gradients, was 93 jim/s uncorrected for unstirred layer effects and 500 um/s after correction for these effects (van Os et al., 1979) . Cell membrane osmotic water permeability has been estimated in toad urinary bladders from data on transepithelial water flow induced by osmotic gradients, taking care to reduce unstirred layer thickness to a minimum. Values for the apical membrane of the epithelial cells increased from 4,um/s in the unstimulated bladder to 200 ,um/s in the ADH-stimulated preparation (Hays and Leaf, 1962) . These cell membrane Lp estimates were based on the assumption that transepithelial water flow proceeded by a cellular route; however, data on the changes in the structure of the tight junctions and shunt pathway suggested that some water may flow around the cells rather than through them (DiBona et al., 1969 ; DiBona and Civan, 1972) . Others concluded that significant water flow could occur across the tight junction of leaky epithelia because epithelial Lp exceeded that estimated for the cell membranes (Fischbarg et al ., 1977) . Elucidation of the route of water permeation across leaky epithelia has not been possible because of the lack of measurements of the Lp of the cell membranes. To measure cell membrane Lp's we developed a method for the rapid determination of the volume of Necturus gallbladder epithelial cells during the perfusion of anisotonic solutions in either the mucosal or serosal baths. Unstirred layers were minimized by the use of a very thin chamber and high perfusion rates. We used the rate of change of cell volume after alterations in the osmolality of the mucosal or serosal bathing solution to calculate the volume flux across the relevant cell membrane . The hydraulic water permeability of each membrane was calculated from the initial volume flow rate and the osmotic gradient shortly after the change in the perfusate osmolality . The osmotic water permeability of the apical membrane was estimated as 545 p,m/s and that of the basolateral membrane was 1,188 tm/s . These P.. values are sufficiently large that normal fluid absorption rates can be achieved by transcellular volume flow driven by small osmotic gradients. We also observed
PERSSON AND SPRING
Gallbladder Cell Water Permeability and Volume Regulation
483
that Necturus gallbladder epithelial cells underwent volume regulatory swelling or shrinkage after changes in the osmolality of either bathing solution . The mechanism of cell volume regulatory swelling, as well as that of ouabaininduced cell swelling, were shown to involve the movement of NaCl and H2O from the mucosal bath into the epithelial cell . MATERIALS AND METHODS
Sac Preparations Fluid transport rates were evaluated for the gallbladders in a variety of solutions. The bladders were tied onto glass tubes, filled with the appropriate solution, and suspended in a reservoir. The solution in the reservoir was gassed with 99% air, 1% CO2. Periodically the bladders were removed from the solution, blotted, and weighed on an analytical balance. Fluid transport rates were determined from the weight change of the sacs and their surface area was calculated assuming a spherical shape. Tissue Preparation for Microscopy
After the bladders had been washed free of bile they were mounted in a miniature Ussing chamber as previously described (Spring and Hope, 1978). The submucosal connective tissue was not removed in experiments in which the mucosal solution osmolality was changed. The cells were normally mounted with their apical surface closest to the microscope objective lens. In experiments involving rapid changes in the composition of the fluid bathing the serosal surface, the tissue was inverted in the chamber and most of the serosal connective tissue underlying the epithelium was removed by dissection before mounting the preparation in the chamber. The total thickness of the basement membrane and remaining connective tissue was typically 20 ltm. Chamber Geometry and Unstirred Layers The geometrical restrictions imposed by the optical components of the light microscope required that the tissue be mounted in a thin chamber. Our chamber had a 50lim thick bath on the side nearest the objective lens (Spring and Hope, 1978) . This thin bath had two advantages : (a) its fluid volume was small, and (b) unstirred layers were virtually nonexistent . Unstirred solution layers are a significant source of error in the measurements of epithelial hydraulic water permeability (Diamond, 1979). The bath facing the mucosal surface of the tissue in our miniature Ussing chamber was changed once every second at normal perfusion rates. Flow of the perfusion solutions in the mucosal and serosal baths were controlled by solenoid-actuated pinch valves (Model 370; Angar Scientific Controls, Cedar Knolls, N. J.) located 5 cm from the chamber. The values were operated by relays (model 3495 ; Hewlett-Packard Co .,
Downloaded from www.jgp.org on March 2, 2006
Adult Necturus maculosus were kept in an aquarium at 15 ° C for at least 1 mo before the experiment . They were anaesthetized by immersion in 0.1% tricaine methane sulfate (Finquel, Ayerst, N. Y.), and the gallbladder was removed, drained of bile, and placed in Ringer solution . The composition of the Ringer solution was as follows: 90 mM NaCl ; 2.5 mM KCI; 10 mM NaHCO3; 0.5 mM NaH2PO4 ; 1 .8 mM CaC12; 1 .0 MM MgCl 2; pH 7.6 ; osmolality 190-200 mosmol ; gassed with 99% air, 1% C02 . The solution used in most of the experiments was NaCl Ringer in which 20 mM of NaCl was replaced by 36 mM mannitol (Ringer-mannitol) . Changes in osmolality of this solution were achieved by the addition or removal of mannitol. All experiments were performed at room temperature (-25 °C) .
484
THE JOURNAL OF GENERAL PHYSIOLOGY " VOLUME
79 " 1982
Downloaded from www.jgp.org on March 2, 2006
Palo Alto, Calif) controlled by a computer (model 4051 ; Tektronix, Beaverton, Oreg.) . The chamber was connected to the perfusion reservoirs through a manifold constructed from 27-gauge stainless steel tubing. We determined the time required for complete fluid exchange in the mucosal bath of our chamber by two methods: (a) dye was added to one perfusate, and the time course of optical density changes was evaluated after switching the perfusate ; (b) the Na in the mucosal bath was replaced by tetramethylammonium and the time course of bi-ionic potentials was determined . Both methods gave similar results, the time required for complete exchange of the mucosal bath was <2 s. The presence of 20 pm of connective tissue in the serosal fluid exchange experiments further increased the exchange time of the serosal bath to 3 s. Optical and Video Systems The epithelial cells were visualized and analyzed with a microscope-video system as previously described (Spring and Hope, 1979) . In brief, the preparation was illuminated with polarized, monochromatic light (495 nm) and visualized by means of an image-intensifed television camera (model 4410; Cohu, San Diego, Calif.). The microscope (Diavert; E. Leitz, Rockleigh, N. J.) was equipped with Smith differential interference contrast optics (100 X oil immersion objective) which, because of their extremely shallow depth offield, permitted "optical sectioning" of the epithelial cells . The microscope fine focus was adjusted by means of a stepping motor drive that displaced the stage in 0 .75-,um increments at rates up to 300 steps/s. After each 3-,Um displacement of focus, video images of the cells were recorded on video disk (model AR-1 ; Arvin Echo, Mountain View, Calif.). The area and perimeter of each optical section were later determined from tracings of the cell outline . Cell volume was computed from the areas and displacements of focus as previously described (Spring and Hope, 1979) . The microscope was initially focused on the apical surface of the cell and sections were made until the basement membrane was visualized. As the cell volume changed, the focus was repositioned so that sections always began at the same point on the apical surface of the cell. The number of slices was varied as the cell height changed. Because of the cylindrical shape of Necturus gallbladder epithelial cells, most of the changes in volume were due to alterations in the cross-sectional area of the cells and not to changes in height . Slice thickness and cell height determinations were corrected for a 10% overestimate caused by the difference in refractive index between the microscope immersion oil and the epithelial cells . The refractive index of the Necturus gallbladder epithelial cell is ^-1 .37 (Coble et al., 1982) and that of the immersion oil used is 1 .518. Because we were only recently made aware of this measurement error, our previous cell volume estimates were 10% too large (Spring and Hope, 1978) . Both the microscope fine focus adjustment and the video recording system were under computer control, and the rate of data acquisition was limited only by the time required for the video image records and by relay switching delays . Video framing rates as well as video disk recording time resulted in a minimum sample time of 100 ms per image. Records of a typical epithelial cell (10 images) then required ^-1 s; adjustments ofmicroscope focus and switching times were such that a complete record of cell volume could be made once every 10 s. The cell volume transients associated with osmotic water flow into or out of the cell were rapid ; the initial volume change was completed in 10 s under some experimental conditions. Thus, whole cell records were not sufficiently rapid in some cases to follow the time course of cell volume changes in anisotonic media. Better time resolution was obtained by measuring the volume of an element within the cell. We chose to record images of the cell at three depths: at the level of the tight junction and 3 and 6 pm serosal to the junction . The 6-ttm thick volume element was scanned successively in both apical-to-basal and
PERSSON AND SPRING
Gallbladder Cell Water Permeability and Volume Regulation
48 5
reverse directions ; a complete record could be made every 0.6 s. Cell volume changes caused small displacements of the tissue so that the focal position had to be readjusted to maintain the first slice at the level of the tight junction . These small focus adjustments were made using the manual controller for the stepping motor focus drive and did not significantly delay the sampling sequence . The disadvantage of this technique was that the volume element was of constant thickness and no information was obtained on changes in cell height . The resultant video images were stored on video disk and traced as described above. Measurement Error
LP Calculation
The initial rate of cell volume change immediately after a change in the bathing medium osmolality can be used to calculate the hydraulic water permeability of the cell membrane . In the absence of a hydrostatic pressure difference the hydraulic water permeability is given by:
where J* is the initial rate of fluid flow per unit area of relevant membrane, a the solute reflection coefficient of that membrane, and Air is the osmotic pressure difference existing across the membrane immediately after the solution change. In our experiments ,J*v was determined from a least-squares fit of cell volume vs . time after the solution was changed. The smooth surface area of the apical surface of the cell was used to calculate apical membrane Lp. Basolateral membrane L, was expressed either as a function of basolateral or apical membrane area . Intracellular osmolality was assumed to be identical with control Ringer solution before solution changes. Mannitol was used to induce differences in osmolality and its reflection coefficient was taken as 1 .0 . Statistics
All data are presented as mean t SEM. Statistical analysis was done on a Tektronix 4051 computer using programs written in BASIC. RESULTS Sac Preparations Gallbladders were mounted as sacs to determine fluid absorption gravimetrically. The bladders were filled with normal Ringer or Ringer-mannitol and
Downloaded from www.jgp.org on March 2, 2006
We have previously noted that measurements of cell volume by light microscopic techniques were limited in absolute accuracy (Spring and Hope, 1979) . The limitations arose from two sources: (a) the resolution of the light microscope, and (b) our inability to accurately trace the lateral and basal infoldings of the cell membranes. On the other hand, the precision of light microscopic measurements was remarkably good . Repetitive records of images of an epithelial cell in control conditions displayed a 2.3% coefficient of variation for cell volume. The error in estimates of the volume of a 6-gm thick intracellular element was even smaller. The coefficient of variation for a volume element was 1.4%; the improvement in precision resulted from the fact that the volume element was taken from a portion of the cell with the most clearly defined boundaries.
486
79 " 1982
THE JOURNAL OF GENERAL PHYSIOLOGY " VOLUME
bathed either in normal Ringer or Ringer-mannitol . These experiments were used to determine the normal rate of fluid absorption by the Necturus gallbladder and to observe the effect on fluid absorption of a reduction in NaCl concentration from 100 to 80 mM. The results are shown in Table I, where it can be seen that the normal fluid absorption rate was 8.9 t 0.9 I,1/cm 2 " h (n = 42) and that the replacement of 20 mM of NaCl by mannitol in either or both bathing solutions did not significantly alter the rate of fluid transport. When the bath was 20 mosmol hypotonic to the sac lumen, J,. was not significantly different from zero (Table I, middle) . A similar result was observed when the lumen was made hypertonic to the bath by the addition of 20 mosmol mannitol (Table I, middle) . The sac preparations showed that fluid absorption was not altered significantly when the NaCl concentration of either or both of the bathing solutions was reduced to 80% of normal, and
Lumen
Bathing solution
n
J�
Paired t test vs . control
42 10 4 4
A11CM2/h 8 .86±0 .93' 12 .19±2 .76 7 .40±1 .65 16 .55±4 .99
NS NS NS
Hypotonic Ringer Ringer
4 4
0 .46±1 .32 3 .15±2 .29
P < 0 .01 P < 0 .05
Hypertonic Ringer Ringer
4 4
11 .38±1 .87 27 .65±3 .75
NS P < 0 .05
Ringer Ringer mannitol Ringer Ringer mannitol
Ringer Ringer mannitol Ringer mannitol Ringer
Ringer Hypertonic Ringer Ringer Hypotonic Ringer
' Mean ± SE. All ,J� measurements were preceded and followed by a control period and were compared to the control J� by the paired t test . Hypotonic Ringer was the same as the Ringer mannitol solution with 20 mM less mannitol added .
that imposition of a 20-mosmol gradient, either by making the bath hypotonic or the lumen hypertonic, effectively stopped net fluid absorption. The imposition of a 20-mosmol gradient in the same direction as normal fluid transport increased the net rate of fluid absorption (Table I, bottom) . Cell Volume and Mucosal Solution Osmolality
The effect of changes in mucosal solution osmolality on cell volume was determined from experiments in which mannitol was added to or removed from the mucosal bathing solution . Each experimental period was preceded and followed by a control period during which both the mucosal and serosal solutions were Ringer-mannitol . The largest osmotic gradient used was 41 mosmol, a relative osmotic change of 20 .5%; the smallest gradient was 11 .5 mosmol or a 6% change in osmolality . Fig. 1 (top) shows an experiment in which the mucosal solution was made hypertonic by 36 mosmol while the
Downloaded from www.jgp.org on March 2, 2006
TABLE I FLUID ABSORPTION IN SAC PREPARATIONS
Gallbladder Cell Water Permeability and Volume Regulation
PERSSON AND SPRING
487
serosal solution was unaltered . Cell volume rapidly decreased to a minimum upon exposure to the hypertonic solution and then returned towards its control value ("volume regulation") . The volume of the cell stabilized at a value near the control value despite the fact that the mucosal bath remained hypertonic
Downloaded from www.jgp.org on March 2, 2006
x W J
O J J W
U
16
15
14
13
12 1 0
I
I 1
I 2
I
3
I
I
4
I
5
I 6
MINUTES
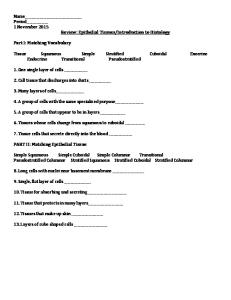
Top : cell volume is plotted on the ordinate as a function of time on the abscissa. After control measurements of volume, the mucosal perfusate was made hypertonic by 36 mosmol (dashed line at left) . The cell quickly shrank and recovered, although the mucosal perfusate remained hypertonic. The mucosal perfusate was returned to control solution at the right-hand dashed line. Bottom : cell volume is plotted for an experiment in which the mucosal perfusate was made hypotonic by 36 mosmol by the removal of mannitol from the control solution (Ringer-mannitol) . The solution change occurred at the leftmost dashed line and the mucosal perfusate remained hypotonic until the dashed line at the right. FIGURE
1.
to the control solution. Fig. 1 (bottom) shows a similar experiment in which the mucosal bath was made 36 mosmol hypotonic by the removal of all mannitol from the perfusate. When the mucosal solution was switched back to control (Ringer-mannitol cell), volume rapidly increased (Fig. 1, top) after
488
THE JOURNAL OF GENERAL PHYSIOLOGY " VOLUME
79 " 1982
TABLE II CELL VOLUME CHANGES INDUCED BY ALTERATIONS IN MUCOSAL SOLUTION OSMOLALITY Osmotic gradient mosm01
+36(18%) -36(18%) +19.5(10.2%) -19.0(9.5%) +11 .5(6.0%) -13.5(6 .7%)
Osmoticj�
CMIS X 10-6 -5 .510 .4(12)* 9.0 :0 .5(13) -10.7±1 .1(7) 11 .4 :0 .4(15) -7 .9 :0 .8(11) 10.1±0.8(7)
Maximum 0, percent of control Volume regulation,� CMIS X 10-6 16 .211 .2(15) 4.4 :t 1 .0(6) 22 .3±1 .4(13) -5 .5±0 .06(12) 10 .5 :1 .0(7) 8.4 :0 .5(12) -8 .1±1 .3(6) 7.1±0 .7(11) 6.8 :1 .1(8) 8.2 :0 .8(7) -6 .2±1 .2(7)
* Mean ± SE (n), negative sign indicates volume flow out of the cell .
osmolality-induced water flow as shown in Table II. The initial rate of volume flow Uv) into or out of the cell in response to an osmotic gradient was plotted as a function of the osmotic gradient (Fig. 2) . A linear relationship between j, and 017 would be expected for a membrane with a constant hydraulic water permeability (see Eq. 1) . The relationship in Fig. 2 is obviously nonlinear; Jv remained virtually constant as Air was varied over the range 11 .5 to 41 mosmol osmotic gradients < 11 .5 mosmol (6%) produced cell volume changes that were too small and rapid to be usable for the determination ofjv across the apical membrane . The hydraulic water permeability (Lp) of the apical cell membrane was calculated from the initial rate of cell volume change for each condition assuming the cell was iso-osmotic to the control solution at the moment of the mucosal osmolality change . The Lp values thus obtained are listed in Table III for all experiments involving changes in mucosal solution osmolality . The apical membrane Lp values were inversely related to the magnitude of the osmotic gradient across the apical membrane . This relationship is illustrated in Fig. 3, where Lp is plotted on the ordinate as a function of AiT across the
Downloaded from www.jgp.org on March 2, 2006
the removal of a hypertonic mucosal perfusate, or decreased (Fig. 1, bottom) after the removal of a hypotonic mucosal solution . The time course and magnitude of the transients observed after return to control solutions were mirror images of the patterns generated by the anisotonic perfusates . These transients are treated in greater detail at the end of Results. The initial rate of cell shrinkage during mucosal hypertonicity, or cell swelling during mucosal hypotonicity, was used to calculate the water flow across the apical membrane . The rate of cell volume change was determined from the slope of a linear least-squares line fitted to the three to five values of cell volume recorded immediately after the osmotic perturbation . Table II lists the initial rate of cell volume change after an alteration in the mucosal solution osmolality as well as the maximum change in cell volume as a percentage of the control volume (maximum A) . The rate of cell volume regulation was calculated from the slope of a linear least-squares line fitted to the first three to five values of volume following the osmotically induced peak or minimum . The rate of cell volume regulation was slower than the rate of
PERSSON AND SPRING
Gallbladder Cell Water Permeability and Volume Regulation
489
apical membrane (abscissa) . The lines in Fig . 3 were drawn by the method of least squares and do not differ significantly from one another in slope (0.022 cm/s) or intercept (10 X 10 -4 cm/s " osmol) . The dependence of the apparent LP on the magnitude of the applied osmotic gradient is probably due to the J V cm/s T 15
10- °
TABLE III APICAL MEMBRANE L, Osmotic gradient
L,
P_
mosmol +36(18%) -36(18%) +19.5(10.2%) -19.0(9 .5%) -13 .5(6 .7%) +11 .5(6 .0%)
cm/s OSrn01 X 10-4 1 .5±0 .2(12)* 2 .5±0 .3(16) 5 .5±0 .9(6) 6 .0±0 .4(15) 7 .5±0 .9(6) 6 .8±1 .1(9)
Evn/s 85 139 302 332 411 376
' Mean ± SE (n) .
presence of unstirred layers adjacent to or within the epithelial cells. The unstirred layer dependent reduction of Lp would be minimized at vanishingly small osmotic gradients . The intercept of the least-squares line represents the best estimate for Lp uninfluenced by unstirred layer effects. The apical membrane LP by this method is 10 X 10-4 cm/s " osmol or a Poi, of 545 ,,m/s.
Downloaded from www.jgp.org on March 2, 2006
-L -15
Volume flow U~) into or out of the epithelial cell is plotted on the ordinate against the change in the osmolality (Avr) of the mucosal perfusate (abscissa). Positive values of ±177 correspond to hypertonic mucosal perfusates ; negative values correspond to hypotonic solutions . f� is calculated from leastsquares lines fitted to the initial rate of cell volume change; each point indicates the mean with its standard error. FIGURE 2 .
49 0
THE JOURNAL OF GENERAL PHYSIOLOGY - VOLUME
79 " 1982
Rectification ofthe rate ofosmotic volume flow across the apical membrane was not observed ; this is clearly illustrated by the similarity of slopes and intercepts of the two lines in Fig . 3. Rectification of osmotic water flow has been reported by many previous investigators (Macey, 1979) . They observed that water flowed more readily into red blood cells during cell swelling than out of the cells during shrinkage . Recently it has been reported that the rectification of water flow in human red blood cells is an artifact of the methods used to determine changes in cell volume (Terwilleger and Solomon, 1981) . When small osmotic gradients were used, systematic errors were minimized and rectification did not occur; the Lp of the red cell membrane, measured from cell shrinkage or swelling, was similar to that reported by Rich Lp cm
-40
-30
-20
-10 0 10 20 A ii mOsm IMUCOSALI
30
40
50
LP of the apical cell membrane is plotted on the ordinate against of the mucosal perfusate (abscissa) . Positive 07T values correspond to hypertonic solutions . Negative t)7T values correspond to hypotonic solutions. LP was calculated from each of the j� points in Fig. 2; the points were fitted by leastsquares lines whose equations are shown . The intercepts of the lines have the units of LP (cm/ " osmol X 10-4) ; the slopes have the units of L P/O7r (cm/s) . FIGURE 3 . t17r
et al. (1968) . Our data on the lack of rectification of water flow across the apical cell membrane are in agreement then with recent observations in red blood cells . Cell Volume and Serosal Solution Osmolality
Measurements of cell volume during changes in serosal solution osmolality were made on preparations stripped of most of their underlying connective tissue and inverted in the chamber as described in Methods . The reduction of the connective tissue layer thickness allowed rapid exposure of the basolateral membrane to the new serosal bathing solution, a necessity in these experiments because of the fast changes in cell volume induced by alterations in serosal osmolality . Fig . 4 shows an experiment in which the serosal medium was made hypertonic by 34.4 mosmol . Cell volume fell rapidly (note time scale) to a
Downloaded from www.jgp.org on March 2, 2006
-50
sec-1 Osm -' X 10 -°
PERSSON AND SPRING
Gallbladder Cell Water Permeability and Volume Regulation
491
minimum and then volume regulatory recovery occurred . The changes in cell volume induced by alterations in serosal osmolality were so fast that initial rates could only be determined for large osmotic gradients (^-36 mosmol) . Table IV gives the cell volume changes and Lp estimates for experiments using these large gradients. The Jv and Lp values are expressed in two ways : for 10
HYPERTONIC (SEROSAL)
_o x 9 E _s w
W
U
8
7 8
MIN
4. Cell volume is plotted for an experiment in which the serosal perfusate was made hypertonic by 34 .4 mosmol at the time indicated by the arrow. The tissue was mounted in the chamber so that the serosal surface was facing the microscope objective lens, and most of the underlying connective tissue was removed.
FIGURE
TABLE IV CELL VOLUME CHANGES INDUCED BY ALTERATIONS IN SEROSAL SOLUTION OSMOLALITY
Osmotic gradient mosmol -38 .5(19.3%) +34 .4(17.8%)
Osmotic,)� cm/s X 10`6 11 .3±0.5(10)' -10 .5±0.6(14)
Maximum A percent of control 16 .5±1 .6 15 .3±1 .5
Volume regulation J,. cm/s X 10-6 -14.9±2 .4 19.9±3 .4
L, cm/s osmol X 10-° 2 .9±0 .3 (a)$ 1 .1±0 .2 (bl) 3 .1±0 .4 (a) 1 .0±0 .1 (bl)
' Mean ± SE (n) . Negative sign indicates volume flow out of the cell. $ (a) Lp calculated as a function of apical surface area at level of tight junction . (bl) Lp calculated as a function of basolateral surface area .
purposes of comparison to the apical membrane values, basolateral membrane Lp was calculated with respect to the area at the level of the tight junction (apical area) as well as with respect to the lateral plus basal membrane area determined in conjunction with the cell volume estimates. Since there was a dependence of the apparent Lp of the apical membrane on the size of the osmotic gradient, we determined the Lp of the basolateral membrane with a
Downloaded from www.jgp.org on March 2, 2006
J 0 J J J
THE JOURNAL OF GENERAL PHYSIOLOGY " VOLUME 79 " 1982
492
smaller osmotic gradient . The rapid response of the cell to changes in serosal osmolality made it impossible to record cell volume by the method used for the larger gradients. Instead of measuring the volume of the entire cell we determined the volume of a 6-,um-thick region within the cell extending serosally from the tight junction . Volume Element and Basolateral Membrane Lp
The repetitive measurement of the volume of a 6-ltm-thick element within the cell reduced the time between complete measurements to 0.6 s. To determine whether the volume element accurately reflected changes in the entire cell, we compared the volume element records to those of an entire cell . Fig. 5 plots both the volume ofa 6-,um-thick element in the cell and the entire cell volume
X
Ex
w J
_, 12
J W
U
Cell volume and the volume of a 6-,um-thick element within the cell are plotted as a function of time during an experiment in which the mucosal perfusate was made hypertonic by 20 mosmol . The solution change was made at the time indicated by the arrow. The volume element consisted of a portion of the cell extending serosally for 6 ,um from the tight junction . FIGURE 5 .
during a 20-mosmol increase in mucosal osmolality . The volume element changes at a rate similar to that of the whole cell. Apical membrane Lp was calculated from volume element records for experiments in which the mucosal perfusate was made hypertonic by 13.7 mosmol (7 .2%) . The Lp from these experiments was 7.8 ± 1 .0 X 10-4 cm/s . osmol (n = 11) or Po,,. of 431 gum/s. This value was indistinguishable from the Lp calculated from total cell volume changes (7.5 ± 0.9 X 10⁻⁴ cm/s "osmol, Table III) . As a further check on the validity of the volume element technique for Lp determination, the Lp of the basolateral membrane was measured using the same hypertonic osmotic gradient (34.4 mosmol) previously used for the Lp measurements listed in Table IV. The membrane Lp value determined by the volume element method did not differ from that measured by the whole cell method (Table V) .
Downloaded from www.jgp.org on March 2, 2006
13
PERSSON AND SPRING
Gallbladder Cell Water Permeability and Volume Regulation
493
Basolateral membrane LP values were then determined by increasing the serosal osmolality by 32 .7 mosmol (17%) or 17 .9 mosmol (8.9%) and measuring the volume of a 6-lAm thick element within the cell (Table V) . Fig. 6 shows a typical record of the response of a volume element to the increased osmolality of the serosal perfusate. The initial cell shrinkage was so rapid that only two points could be obtained from initial slope calculations . The L p thus obtained was 12.1 X 10⁻⁴ cm/s " mosmol expressed as a function of the smooth surface TABLE V BASOLATERAL MEMBRANE L� DETERMINATION BY VOLUME ELEMENT METHOD Osmotic gradient
LP , whole cell
cm/s osmol X 10-4 3 .2±0 .3(6)" 3.1±0.4(14) 2 .8±0 .5(7) 12 .1±1 .4(11) -
' Mean ± SE (n) . Basolateral membrane L p expressed for area of cell at level of tight junction. HYPERTONIC (SEROSAL)
MIN
Volume of 6-lAm-thick element within the cell is plotted as a function of time (note expanded scale) . At the arrow the serosal perfusate was made hypertonic by 17.9 mosmol (8 .9%) ; the perfusion solution remained hypertonic for the duration of this record . FIGURE 6.
area of the apical membrane. When a regression of Lp vs. 07T was made for the basolateral membrane, similar to that for the apical membrane shown in Fig. 3, the least-squares line had a slope of -0.056 f 0.005 cm/s and an intercept of 2.2 ± 0.17 X 10 -3 cm/S " OSm01 with r = 0.99. The Lp calculated from the .osmol (P. = 1,188 ium/s) with respect to the intercept was 2.2 X 10⁻³ CM/S apical surface area, or -6.3 X 10 -4 cm/S " osmol (P. = 347 Lm/s) with respect to the basolateral membrane . The basolateral membrane L P was calculated as a function of the apical surface area for purposes of comparison
Downloaded from www.jgp.org on March 2, 2006
mosmol +34.4(17 .8%) +32 .7(17%) +17 .9(8.9%)
L P , volume element
494
THE JOURNAL OF GENERAL PHYSIOLOGY " VOLUME
79 " 1982
of the relative resistance to hydraulic flow offered by each cell surface. When the basolateral membrane LP was considered as a function of its own surface area, it was not significantly different from that of the apical membrane . Therefore, we would conclude that the basolateral membrane is not inherently more permeable to water than the apical membrane, but that the more rapid cell volume changes associated with osmotic gradients across the basolateral membrane are attributable to the large surface area of that membrane . It is noteworthy that the LP of either membrane per unit area is slightly higher than that of the cat red blood cell membrane (Rich et al., 1968) and equal to that of a lipid bilayer treated with amphotercin B (Fettiplace and Hayden, 1980) .
Cytoplasmic Water Flow : The Wave Calculations of the hydraulic water permeability of the cell membranes assumes that they are the only significant barrier to water flow into or out of the epithelial cell . Restriction to water flow offered by the cytoplasm could result in a significant underestimate of the cell membrane LP. Our experiments involved the exposure of one surface of the cell, apical or basolateral, to a solution of altered osmolality, whereas the other bathing solution remained at
Downloaded from www.jgp.org on March 2, 2006
Maximum Cell Volume Change and Air Exposure of the gallbladder epithelium to anisotonic solutions led to cell volume changes that were directly proportional to the change in osmolality . In the case of symmetrical cells, such as red blood cells, the relationship between percentage change in cell volume and percentage change in osmolality has been used to determine the solvent water content of the cells (House, 1974) . A cell that behaves as a perfect osmometer exhibits a linear relationship between changes in cell volume and changes in osmolality, and the slope of the line relating the two equals the fraction of the cell volume that is osmotically active . Cell volume regulation tends to obscure this relationship and makes it difficult to assess the degree to which the cells are osmotically responsive. The maximum change in the volume of the gallbladder epithelial cells occurred shortly after alteration of the osmolality of either bathing solution. To determine whether the gallbladder cells behaved as perfect osmometers, the percent maximum change in cell volume was plotted against the percent change in Air (Fig. 7). Points are shown for both mucosal and serosal solution osmolality changes and two lines are drawn. Positive values of percent Air correspond to hypertonic perfusates and negative values to hypotonic perfusates . The solid line was drawn by the method of least squares and has the following parameters : slope = 0.96 ± 0.03, intercept = 0 .60 ± 0.48, r = 0.95 . The water content of Necturus gallbladder epithelial cells is 82% (L . Reuss, personal communication), and the dashed line is the predicted relationship between Necturus epithelial cell volume and bathing solution osmolality for cells with an 82% water content. Our data had sufficient scatter that the difference between the least-squares line and that predicted from the water content was not significant.
PERSSON AND SPRING
Gallbladder Cell Water Permeability and Volume Regulation
495
the control osmolality . This experimental situation was ideally suited for the detection of cytoplasmic hindrance to water flow; for example, after a decrease in mucosal osmolality, water should first enter the apical end of the epithelial cell and then travel across the cytoplasm to the basolateral membrane in the form of a wave . We recorded the speed of this wave by measuring the area of two optical slices of the cell separated by 6 t,m ; the time between sets of images was <0.5 s. The average time between the appearance of the wave front at the first slice (at the level of the tight junction) and at the second slice (6,um serosal) was 0.84 ± 0.24 s (n = 33) . The wave moved the 6 t,m from the serosal slice to the mucosal slice in 0.97 ± 0.39 s (n = 11) after a change in
-30
Percent change in cellular volume (ordinate) is plotted against percent change in perfusion solution osmolality (abscissa) . The cell volume changes were the maximum values obtained during alterations the osmolality of either bathing solution. Two lines are shown: the solid line is the least-squares line fitted to the data points ; the dashed line is the theoretically predicted behavior of a cell with an 82% water content . The least-squares line is given by the following equation: y = 0.60 t 0.48 .- 0.96 t 0.03x, r = 0.95. FIGURE
7.
serosal osmolality . The speed of the wave in the two directions was not significantly different and the 6-1,m distance was covered in ^-0.85 s, a linear velocity of 6.7 tm/s or 2.4 cm/h . This velocity can be compared to the normal rate of volume flow across the cell of 2.4 X 10⁻⁶ cm/s (or 0.02 ,,m/s) and to the peak f,. induced during osmotic water flow of 12 X 10-s cm/S (or 0.1 tm/s) . Thus the speed of the wave travelling across the cytoplasm was 60 times that of the peak osmotic volume flow. The principal restriction to transcellular water flow lies at the level of the cell membranes because the velocity of water flow across the cytoplasm is far greater than that across the cell membrane .
Downloaded from www.jgp.org on March 2, 2006
-20
49 6
THE JOURNAL OF GENERAL PHYSIOLOGY " VOLUME 79 " 1982 Volume Regulation
gallbladder cells quickly returned to their original volume after an initial transient when exposed to anisotonic mucosal or serosal bathing solutions. A number of experiments were performed to ascertain the mechanism of volume regulation and to rule out artifacts such as mannitol permeation . Amphiuma red blood cells regulate their volume by taking up NaCl when they are shrunken and by losing KCl when they are swollen (Siebens and Kregenow, 1980). We tested the ability of Necturus gallbladder cells to volume regulate when the mucosal medium was NaCl free (Fig. 8 and Table VI) . The mucosal perfusate contained Ringer solution with all NaCl replaced by Necturus
8
X
M
E i
w
7
J 0 J J W 6 0
0
1 .0
2.0
3.0
4.0
MIN
FIGURE 8. Cell volume (ordinate) is shown for an experiment in which all the sodium in the mucosal perfusate was replaced by mannitol . At the arrow the mucosal perfusate osmolality was increased by the addition of 36 mosmol mannitol . The mucosal perfusate remained hypertonic for the duration of the record .
mannitol; cells exposed to this solution were 80% of their normal volume because of the loss of intracellular NaCl (Spring and Hope, 1979) . The serosal perfusate was normal Ringer solution . The addition of 36 mosmol more mannitol to the mucosal bathing solution caused the cells to shrink further due to water movement but did not lead to volume regulatory recovery (J� during volume regulation was not significantly different from zero; Table VI) . Volume regulatory swelling after cell shrinkage therefore occurs by the entry of mucosal NaCl into the epithelial cells. Very little sodium was required in the mucosal medium for volume regulation to occur. Table VI also shows a similar experiment to that above except that 10 mM NaHCO3 (and 9.1 mM Cl -) remained in the mucosal perfusate (i.e., all NaCl in the Ringer solution was replaced by mannitol) . Upon addition of 36 mosmol mannitol to the mucosal perfusate, the cells underwent the typical shrinkage and volume
Downloaded from www.jgp.org on March 2, 2006
0
PERSSON AND SPRING
Gallbladder Cell Water Permeability and Volume Regulation
497
TABLE VI RATE OF CELL VOLUME CHANGE INDUCED BY 36 MOSMOL HYPERTONICITY OF THE MUCOSAL BATHING SOLUTION Perfusate Mucosal NaCl-free 10 NaCl 10 NaCl
Serosal Ringer Ringer Ringer + ouabain
Osmotic J� cm/s X !0_ s -11.2±2 .4(7)*$ -7 .7±1 .3(6) -4 .9±0 .8(9)
Maximum 0 percent of Volume control regulation j, cm/s X /0-B 17 .0±2 .2 0.2±0.3$ 10 .5±1 .1$ 4.9±0 .7 13 .4±3 .2 3.7±0.7
L� cm/s OSmol X l0-4 3.110 .7$ 2.2±0 .4 1.410 .2
* Mean ± SE (n). Negative sign indicates volume flow out of the cell . $ Significantly different from control value (Tables II and III) . P < 0.02. All other values were not significantly different from control.
Grantham et al., 1977) . When the mucosal perfusate was 10 mM NaCl-Ringer (all NaCI replaced by mannitol), cell swelling did not occur in the presence of ouabain . Inasmuch as it would be difficult to determine the presence of volume regulation during ouabain-induced swelling, those experiments were performed during the perfusion of 10 mM NaCl in the mucosal solution . Table VI shows that a normal rate of volume regulation occurred despite the presence of ouabain in the serosal solution and a low NaCI concentration in the mucosal perfusate. NaCl Reflection Coefficient: An Estimate
The reflection coefficients of the apical membrane for NaCl and urea were estimated by comparing the time course and magnitude of volume element changes when the mucosal osmolality was increased with mannitol, urea, or NaCl. Fig. 10 shows a record of the volume of a 6-jum thick element during perfusion of hypertonic NaCl Ringer (osmolality was increased by the addition of 30 .3 mosmol NaCl) or hypertonic urea Ringer (osmolality was increased by the addition of 32 .5 mosmol urea) . The Lp determined from these experiments
Downloaded from www.jgp.org on March 2, 2006
regulatory recovery seen at higher NaCl concentrations. Volume regulation in Necturus gallbladder epithelial cells was not the consequence of mannitol permeation of the cell membranes. This was shown in Fig. 8, in which volume regulation was completely abolished by removal of mucosal NaCI and its replacement by mannitol. The mannitol concentration in these experiments varied from 180 to 216 mM in the mucosal perfusate, but cellular swelling did not occur. Serosal ouabain (10 -4 M) did not influence the time course or magnitude of volume regulation, but this could only be demonstrated at low mucosal solution NaCl concentrations. When the mucosal solution was Ringer or Ringer-mannitol, the addition of 10 -4 M ouabain to the serosal solution caused immediate cell swelling. Fig. 9 gives an example of ouabain-induced cell swelling and shows that it can be reversed by a reduction in the mucosal NaCl concentration to 10 mM. The rate of cell swelling (4.8 ± 0.9%/min; n = 6) in the presence of ouabain was what would be expected if the only action of ouabain were the inhibition of the Na-K pump . Similar effects of ouabain on the volume of renal tubule cells have been reported (Ginn et al ., 1968 ;
498
THE JOURNAL OF GENERAL PHYSIOLOGY " VOLUME
79 " 1982
did not differ from experiments using 32 .7 mosmol mannitol to increase the mucosal solution osmolality (Table VII) . The initial rate of volume flow out of the cell in response to the perfusion of a hypertonic mucosal perfusate is determined by the product LpaAir. The fact that the initial rate of volume flow out of the cell was the same with all three solutes suggests that these solutes have reflection coefficients near unity. However, the limited number of experimental points available during the initial osmotic transient made it difficult to accurately determine reflection coefficients from the initial slopes . Urea and NaCl did not cause the cells to shrink as much as mannitol, and volume regulatory swelling overshot the control volume (see Fig. 10) . The
12 '
10mM NACL (Mucosal) i i
(Serosal) MIN
Cell volume during the addition of 10-4 M ouabain to the serosal perfusion solution (left arrow) . Both bathing solutions were Ringer-mannitol. At the right arrow (^,7 min) the mucosal perfusate was switched to 10 mM NaCl Ringer, in which 90% of the NaCl was replaced by mannitol. FIGURE 9 .
rapid shrinkage was due to water moving from the cell to the mucosal solution, whereas the swelling and overshoot were probably due to the permeation of these solutes into the cell across the apical membrane . Another method for the calculation of reflection coefficients uses the time course of cell volume change in the presence of an osmotic gradient created by a permeable solute (Johnson and Wilson, 1967) . The magnitudes of the volume decreases induced by NaCl and urea were 75 and 66% of that induced by an equal osmotic gradient of mannitol (Table VII) . The NaCl reflection coefficient by this method must then be >0.75 and the urea reflection coefficient must be ?0 .66. Determination of an exact value for the reflection coefficients of these solutes required detailed model calculations beyond the scope of this investigation.
Downloaded from www.jgp.org on March 2, 2006
~~
PERSSON AND SPRING
Gallbladder Cell Water Permeability and Volume Regulation
499
J
750
16501 0.00
1
I 0.06
I
I 0.12
I MIN
I 0.18
1
I 0.24
0.30
FIGURE 10 . Volume of a 6-Lm-thick element within the cell during an experiment in which the mucosal perfusate was made hypertonic by the addition of 32 .5 mosmol urea (top panel) or 30 .3 mosmol NaCl (bottom panel) . The osmolality changes were made at the arrows ; the serosal perfusate was always Ringer-mannitol . Note the overshoot of the volume of the element after volume regulatory recovery, TABLE VII
CELL VOLUME CHANGES INDUCED BY ALTERATIONS IN MUCOSAL SOLUTION OSMOLALITY Solute Mannitol Urea NaCl
Osmotic gradient mosmol 32 .7(17%) 32 .5(16.9%) 30 .3(16%)
OsmoticJ�
cm/s X 10-s -5 .6±1 .0(8)* -6.5±1 .0(10) -7 .3±0 .6(13)
cm/s osmo1 X 10-4 2.8±0.5 3.3±0.5 4.0±0 .4
* Mean ± SE (n). Negative sign indicates volume flow out of the cell .
Relative maximum volume decrease % 100±11 .6 66 .4±5 .6 75 .2±9 .9
Downloaded from www.jgp.org on March 2, 2006
W J W W
500
THE JOURNAL OF GENERAL PHYSIOLOGY " VOLUME
79 " 1982
Normal Fluid Absorption and t The normal fluid absorption rate of Necturus gallbladder epithelium was 8.9 fll/cm2 " h (Table I) or 2.4 X 10⁻⁶ cm/s . The Air required across the apical membrane was from Eq. 1 : 2.4 X 10 -6 cm/S 1 .0 X 10- cm/s " osmol Ai = 2.4 mosmol.
TABLE VIII
COMPARISON OF VOLUME CHANGES INDUCED BY CHANGES IN MUCOSAL OSMOLALITY WITH THOSE ASSOCIATED WITH RETURN TO CONTROL SOLUTION Osmotically induced changes Osmotic gradient
mosmol -36 (unstripped) +36 (unstripped) +36 (stripped)
OsmoticJ� -e CMIS X 10
6.7±1 .3(5)* -15 .9±2 .1(5) -11 .4±1 .8(10)
Return to control
Maximum 0 percent of control 17.3±0.9(4) 13.7±1 .0(5) 14.4±0 .9(14)
Recovery of J,,
cm/s X 10 -s -5.4±0.5(7) 10 .4±1 .3(9) 5.7±1 .5(10)$
Maximum 0, percent of control 14.8±2 .3(5) 17.4±1 .5(4) 8.1±2 .4(12)$
' Mean ± SE (n). Negative sign indicates volume flow out of the cell . $ Significantly different from +36 (unstripped) value; P < 0.01 .
Transients upon Return to Control Solutions When the mucosal perfusate was switched from anisotonic to control solution, the cells underwent volume transients that were similar to those induced by an osmolality change . The return to control after mucosal hypertonicity resulted in cell swelling and subsequent volume regulatory shrinkage (Fig. 1, top) . This shows that the osmolality of the cell increased during mucosal hypertonicity and that the control perfusate then was hypotonic to the cell . Comparable transients occurred during mucosal hypotonicity (Fig. 1, bottom) . Table VIII compares the Lp's and maximum volume changes (maximum A) observed after return to control solution with those observed during the initial experimental period . The magnitudes of the maximum volume changes after return to control solution were indistinguishable from those observed during the initial osmotic transient. Thus the cell osmolality changed to virtually equal the osmolality of the mucosal perfusate despite the fact that the serosal
Downloaded from www.jgp.org on March 2, 2006
The Ai7 required across the basolateral membrane was calculated from Eq. 2 using a basolateral membrane LP of 2.2 X 10 -3 cm/s "osmol. A 1 .1-mosmol gradient was required across the basolateral membrane to achieve a J, equal to that measured in sac preparations . If the solute responsible for the osmotic gradients at both membranes were NaCl, a < 2 mM concentration difference would exist between the fluid surrounding the basolateral membrane and that bathing the apical surface of the cell.
PERSSON AND SPRING
Gallbladder Cell Water Permeability and Volume Regulation
501
DISCUSSION
Membrane LP and Fluid Absorption
The LP of the apical and basolateral membranes of Necturus gallbladder epithelium was measured by a new technique that used rapid microscopic determination of cell volume. These measurements are the first values for individual cell membrane LP in a leaky epithelium, and it is worthwhile to consider their physiologic significance . Fluid absorption by the gallbladder epithelium has been shown to involve the formation of an iso-osmotic absorbate coupled to the active transport of solute across the epithelial cells (Diamond, 1962 and 1979). Proposed mechanisms of transepithelial iso-osmotic fluid transport, such as the standing osmotic gradient, have been a subject of controversy (Diamond, 1979 ; Hill, 1980) . The absence of values of the water permeability of the apical and basolateral cell membranes has resulted in a profusion of hypothetical models for transepithelial fluid absorption . Our data show that these extensive models are unnecessary because the water permeabilities of the cell membranes are sufficiently high to result in fluid absorption by simple transcellular osmosis. In other words, specialized structure of the intercellular space or tight junction need not be proposed to explain iso-osmotic fluid absorption by Necturus gallbladder (Hill, 1980). It is the high hydraulic conductivity of the cell membranes of Necturus gallbladder epithelium that facilitates the movement of fluid in response to small osmotic gradients. The directional transport of fluid requires favorable gradients in water activity as well as adequate hydraulic conductivity . The entry of fluid into the gallbladder cell across the apical membrane must be the consequence of lower water activity within the cell than in the mucosal medium. We calculated from our Lp and fluid absorption data that the osmolality of the epithelial cell must exceed that of the luminal fluid by ^"2.4 mosmol to achieve a normal rate of fluid absorption. The exit of water from the cell must similarly be the result of an osmotic
Downloaded from www.jgp.org on March 2, 2006
solution was always Ringer-mannitol . The behavior of the cells after return to control solution suggested that a significant unstirred layer existed between the basolateral cell membrane and the serosal bathing solution . The effect of this unstirred layer was to diminish the influence of the serosal osmolality on cell osmolality during perfusion of anisotonic mucosal solutions. To test this possibility we stripped off most of the submucosal connective tissue and repeated the mucosal hypertonicity experiment . As shown in the last line of Table VIII, although the initial osmotic and volume regulatory responses were indistinguishable from those observed in the unstripped preparation, the transients on return to control solution were significantly diminished in amplitude. These results show that the transients on return to control solution were the result of changes in cell osmolality and that the submucosal connective tissue constituted a significant unstirred layer that tended to diminish the influence of the osmolality of the serosal bathing solution on the osmolality of the cell .
50 2
THE JOURNAL OF GENERAL PHYSIOLOGY " VOLUME
79 " 1982
gradient across the basolateral membrane . The cell, therefore, must be bathed on the basolateral surface by a solution -., 1 .1 mosmol hypertonic to its interior or 3.5 mosmol hyperosmotic to the mucosal bathing solution . The absorbate would then be 3.5 mosmol hyperosmotic to the bathing solutions, a difference of 1.8% from iso-osmolality . A deviation in osmolality of this magnitude is within the measurement error of current methods for osmolality determination and could not be detected with certainty. The high Lp of the cell membranes removes the need for consideration of standing osmotic gradients (Diamond, 1979) or other more exotic mechanisms (Hill, 1980) for iso-osmotic fluid absortion. The required osmotic gradients are miniscule and the solute concentration profile or interspace geometry are not significant factors during normal fluid absorption (Weinstein et al., 1981 ; Sackin and Boulpaep, 1975) . Downloaded from www.jgp.org on March 2, 2006
Route ofFluid Flow: Transcellular vs. Paracellular It is not known whether an important fraction of transepithelial fluid flow crosses the tight junction and enters the lateral intercellular space (Diamond, 1979 ; Hill, 1980). Dilatation of the lateral intercellular spaces occurred during transport in Necturus gallbladder because of the hydrostatic pressure difference between the interspace and cell (Spring and Hope, 1978) . The interspaces collapsed upon the cessation of fluid transport, which indicates that the transported fluid passed through them (Spring and Hope, 1978 and 1979) . Against the possibility of important transjunctional water flow is the fact that the cross-sectional area of tight junction is small compared with that of the cells; the ratio of the cell membrane to tight junction area is - 104 (Sackin and Boulpaep, 1975; Spring and Hope, 1979 ; Hill, 1980) . Substantial transjunctional water flow would occur only when the Lp of the tight junction is ?104 times larger than that of the cell membranes. The Necturus gallbladder apical cell membrane P..is 0.055 cm/s ; therefore substantial transjunctional volume flow would require a tight junction Poem of 5.5 meters/s, a physically unreasonable value . A number of previous investigators have attempted to ascertain the route of transepithelial fluid flow by comparing the Lp of the entire epithelium with that of the cell membranes. The route of transepithelial fluid flow must be paracellular (through the tight junctions) if the epithelial Lp greatly exceeds that of the cell membranes. A predominantly cellular route is indicated if the epithelial and cell membrane Lp's are approximately equal. MacRobbie and Ussing (1961) measured the Lp of the outer and inner boundaries of frog skin epithelium by monitoring tissue thickness during changes in the osmolality of the bathing medium. They estimated the Lp of the outer barrier as 0 .8 X 10-7 cm/s " atm (Poi, = 1 tm/s) and they estimated the Lp of the inner barrier as 17 X 10-7 cm/s " atm (Poem = 23 pm/s) . The P.. of the outer barrier was only slightly less than the Poem of the entire skin measured by House (1964) as 5.3 pm/s . Whittembury (1962) used a similar technique to determine the Poem of the outer barrier of the toad skin ; the value he obtained was -20 /,m/s. Lindemann and Solomon (1962) estimated the Poem of the luminal border of mucosal epithelial cells of rat small intestine by a gravimetric method . They
PERSSON AND SPRING
Gallbladder Cell Water Permeability and Volume Regulation
50 3
Cell Volume Regulation
Volume regulation by Necturus gallbladder epithelial cells was rapid; the average rate of volume regulatory recovery for mucosal osmolality changes was 14 .5%/min . When separated rabbit proximal straight renal tubules were swollen in hypotonic media they shrank within 10 min to near their control volume (Dellasaga and Grantham, 1973 ; Grantham et al., 1977) ; the rate of shrinkage of these tubules was ^" 10%/min. Necturus gallbladder cell volume regulatory increase after cellular shrinkage was due to the movement of NaCl from the mucosal bath into the cell, thereby increasing its solute content. The mechanism of volume regulatory decrease after cell swelling was not studied in the present work . Volume regulatory shrinkage after cell swelling in the rabbit proximal tubule (Grantham et al., 1977) is primarily due to the loss of intracellular KCI . It is of considerable interest to learn whether epithelial cell volume regulation involves change in cation permeability and cell pH such as those described in red blood cells (Kregenow, 1974 ; Cala, 1980), or whether the relatively high permeabilities of the epithelial cell membranes result in rapid relaxation of osmotically induced concentration gradients . This question will probably not be resolved by measurements of cellular volume alone but will require the determination of intracellular ionic activities and transmembrane potential differences. The authors were helped significantly be the critical comments and suggestions of Dr. Maurice Burg . Received for publication March 1981 and in revisedform 9 September 1981 .
Downloaded from www.jgp.org on March 2, 2006
obtained a Poem of 80 j,m/s, quite close to the tissue Pa. of 103 Jum/s measured by Smyth and Wright (1966) . Because large differences between cell membrane and total tissue LP were not observed in these studies, it seemed unlikely that a substantial fraction of the fluid flowed paracellularly . Although measurements of the L P of the epithelial sheet were not made in our optical experiments, it is possible to obtain Lp estimates from the sac preparations . When the sac lumen was filled with a hypotonic solution (20 mosmol) fluid absorption increased by 18.8 ,ul/cm 2 " h (Table I) . The LP of the .Osmol (Po. tissue from this experiment was calculated as 1 .6 X 10-4 CM/S = 95 ,um/s) . This value is comparable to the Lp obtained by Loeschke et al. (1975) for Necturus gallbladder mounted as a flat sheet in a chamber (0.33 X .Osmol, P"~m = 18 fm/s) or in a sac preparation (0.88 X 10⁻⁴ CM/S . 10-4 CM/S osmol, PoBm = 48 gum/s) . These total tissue LP estimates are <20% of the cellular membrane LP values reported here and must be underestimates, probably because of unstirred layer effects (Diamond, 1979) . Because the tissue Lp values are evidently in error, it is not possible to determine the magnitude of transjunctional fluid flow from these data . However, the high h,'s of the cell membranes and the relatively insignificant area of tight junction compared with that of the cell membranes make it extremely unlikely that any important fraction of the transepithelial volume flow could be transjunctional.
THE JOURNAL OF GENERAL PHYSIOLOGY " VOLUME 79 " 1982
50 4
REFERENCES
Downloaded from www.jgp.org on March 2, 2006
ANDREOLI, T. E., J. A. SCHAFER, and S. L. TROUTMAN . 1978 . Perfusio n rate-dependence of transepithelial osmosis in isolated proximal convoluted tubules: estimation of the hydraulic conductance. Kidney Internal. 14 :263-269. GALA, P. M. 1980 . Volume regulation by Amphiuma red blood cells. J. Gen. Physiol. 76:683-708 . COBLE, A. J., J. P. LEADER, and K. R. SPRING . 1982 . Microscope interferometry of Necturus gallbladder epithelium . In Conference on the Paracellular Pathway. S. E. Bradley and E. Purcell, editors. Josiah Macy, Jr., Foundation, N. Y. In press. DELLASAGA, M. and J. J. GRANTHAM. 1973 . Regulation of renal tubule cell volume in hypotonic media. Am . J. Physiol. 244:1288-1294 . DIAMOND, J . M. 1962 . The reabsorptive function of the gallbladder. J. Physiol. (Loud.) . 161:442473. DIAMOND, J . M. 1979 . Osmotic water flow in leaky epithelia. J. Membr. Biol. 51 :195-216 . DiBONA, D. R., and M. M. CIVAN. 1973. Pathways for movement of ions and water across toad urinary bladder . I. Anatomic site of transepithelial shunt pathways . J. Membr. Biol. 12:101128. DIBONA, D. R., M. M. CIVAN, and A. LEAF. 1969. The anatomic site of the transepithelial permeability barriers of toad bladder. J. Cell Biol. 40:1-7 . FETTIPLACE, R., and D. A. HAYDEN . 1980 . Wate r permeability of lipid membranes. Physiol. Rev. 60 :510-550 . FISCHBARG, J., C . R. WARSHAVSKY, and J . J. LIM. 1977 . Pathways for hydraulically and osmotically induced water flows across epithelia. Nature (Load.) . 266:71-74 . GINN, F. L., J. D. SHELBURNE, and B. F. TRUMP. 1968 . Disorders of cell volume regulation . Am. J. Pathol. 53 :1041-1071 . GRANTHAM, J. J., C. M. LOWE, M. DELLASAGA, and B. R. COLE . 1977 . Effect of hypotonic medium on K and Na content of proximal renal tubules. Am . J. Physiol. 232:F42-F49 . HAYS, R. M., and A. LEAF. 1962 . Studies on the movement of water through isolated toad bladder and its modification by vasopressin . J. Gen. Physiol. 45:905-919 . HILL, A. 1980. Salt-water coupling in leaky epithelia. J. Membr. Biol. 55 :177-182 . HOUSE, C. R. 1964 . The nature of water transport across frog skin . Biophys. J. 4:401-416. HOUSE, C. R. 1974 . Water Transport in Cells and Tissues. Edward Arnold, London . JOHNSON, J. A., and T. A. WILSON . 1967 . Osmoti c volume changes induced by a permeable solute . J. Theor. Biol. 17:304-311 . KREGENOW, F. M. 1974. Functional separation of the Na-K exchange pump from the volume controlling mechanism in enlarged duck red cells. J. Gen . Physiol. 64 :393-412. LINDEMANN, B., and A. K. SOLOMON. 1962 . Permeabilit y of luminal surface of intestinal mucosal cells. J. Gen . Physiol. 45 :801-810 . LOESCHKE, K., G. M. EISENBACH, and C. J. BENTZEL. 1975 . Water flow across Necturus gallbladder and small intestine. Excerpta Medica Internatl. Congress Series No. 391. Proceedings 4th Workshop Conference. 406-411 . MACEY, R. 1. 1979 . Transport of water and non-electrolytes across red cell membranes. In Membrane Transport in Biology. G. G. Giebisch, D. C. Tosteson, H. H. Ussing, editors. Springer Verlag, New York . 2:1-56. MACROBBIE, E. A. C., and H. H. USSING . 1961 . Osmoti c behavior of the epithelial cells of frog skin . Acta Physiol. Scand. 53 :348-365. PEDLEY, T. J., and J . FISCHBARG. 1980 . Unstirred layer effects in osmotic water flow across gallbladder epithelium . J. Membr. Biol. 54:89-102.
PERSSON AND SPRING
Gallbladder Cell Water Permeability and Volume Regulation
505
A. ROMUALDEZ, and A. K. SOLOMON. 1968 . Effect of osmolality on the hydraulic permeability coefficient of red cells. J. Gen. Physiol. 52:941-954. SACKIN, H., and E. L. BGULPAEP . 1975. Model s for coupling of salt and water transport. J. Gen. Physiol. 66:671-733 . SCHAFER, J. A., C. S. PATLAK, S. L. TROUTMAN, and T. E. ANDREOLL 1978 . Volume absorption in the pars recta. II . Hydraulic conductivity coefficient . Am. J. Physiol. 234:F340-F348 . SIEBENs, A., and F. M. KREGENOW. 1980 . Analysis of amiloride-sensitive volume regulation in Amphiuma red cells. Fed. Proc . 39 :379. SMYTH, D. H., and E. M. WRIGHT . 1966. Streamin g potentials in the rat small intestine. J. Physiol . (Load.) . 182:591-602 . SPRING, K. R., and A. HOPE. 1978 . Size and shape of the lateral intercellular spaces in a living epithelium . Science (Wash. D. C) . 200:54-58 . SPRING, K. R., and A.. HOPE . 1979. Fluid transport and the dimensions of cells and interspaces of living Necturus gallbladder . J. Gen. Physiol. 73 :287-305 . TERWILLEGER, T., and A. K. SOLOMON. 1981 . The osmotic water permeability of human red cells. J. Gen. Physiol. 77 :549-570. VAN CIS, C. H., G. WIEDNER, and E. M. WRIGHT . 1979. Volume flows across gallbladder epithelium induced by small hydrostatic and osmotic gradients. J. Membr. Biol. 49:1-20. WEINSTEIN, A., J. L. STEPHENSON, and K. R. SPRING . 1981 . The coupled transport of water. In Membrane Transport-Comprehensive Biochemistry. S. L. K. Bontin g and J. de Pont, editors. Elsevier North Holland Amsterdam . 2:311-351 . WHITTEMBURY, G. 1962 . Action of antidiuretic hormone on the equivalent pore radius at both surfaces of the epithelium of the isolated toad skin . J. Gen. Physiol. 46:117-130 . RICH, G. T., R. I. SHA'AFI,
Downloaded from www.jgp.org on March 2, 2006