GOP Primary Season on Twitter: “Popular” Political Sentiment in Social Media Yelena Mejova Yahoo! Research Barcelona, Spain
[email protected] ABSTRACT As mainstream news media and political campaigns start to pay attention to the political discourse online, a systematic analysis of political speech in social media becomes more critical. What exactly do people say on these sites, and how useful is this data in estimating political popularity? In this study we examine Twitter discussions surrounding seven US Republican politicians who were running for the US Presidential nomination in 2011. We show this largely negative rhetoric to be laced with sarcasm and humor and dominated by a small portion of users. Furthermore, we show that using out-of-the-box classification tools results in a poor performance, and instead develop a highly optimized multi-stage approach designed for general-purpose political sentiment classification. Finally, we compare the change in sentiment detected in our dataset before and after 19 Republican debates, concluding that, at least in this case, the Twitter political chatter is not indicative of national political polls.
Categories and Subject Descriptors H.3.3 [Information Search and Retrieval]: General
General Terms Social media; Political discourse; Sentiment analysis
Keywords Human factors, experimentation, performance
1.
INTRODUCTION
Originally dealing largely with product reviews [15], social media-driven sentiment analysis (SA) has recently expanded its target to encompass political discourse. Using NLP and data mining tools, the goal is to determine the author’s political stance (i.e. attitude adopted with respect to an issue) [18, 9], diverging from the standard practice of focussing on sentiment defined as positive or negative.
Permission to make digital or hard copies of all or part of this work for personal or classroom use is granted without fee provided that copies are not made or distributed for profit or commercial advantage and that copies bear this notice and the full citation on the first page. To copy otherwise, to republish, to post on servers or to redistribute to lists, requires prior specific permission and/or a fee. WSDM’13, February 4–8, 2012, Rome, Italy. Copyright 2013 ACM 978-1-4503-1869-3/13/02 ...$15.00.
Padmini Srinivasan, Bob Boynton University of Iowa, IA, USA
[email protected] [email protected] Analysis of such data is important, considering the attention social media has been getting in the news. Following Barack Obama’s 2008 Presidential campaign, the world saw the “crowning of the Internet as the king of all political media” [20]. Online activity indicators such as number of fans on Facebook, followers on Twitter, and likes on YouTube have been seen as indicators of a galvanized base, which ultimately contributed to Obama’s victory [13]. Since then, not only has traditional media started paying more attention to political discussions on social media, but several research papers have been published claiming a connection between social media and public polls and even election outcomes. For example, Tumasjan et al. [19] examine Twitter messages about the 2009 German federal election and find that the mere number of messages reflects the election result and even comes close to traditional election polls, concluding that Twitter can be considered a valid indicator of political opinion. However, some studies show little correlation between the sentiment found on Twitter to that of general public as measured using standard polling techniques. For example, O’Connor et al [14] find no correlation between the 2008 election polls and the support seen in Twitter messages for Obama. They further find that sentiment for McCain (Obama’s rival) and Obama slightly correlate (instead of being inversely related). They do find the discussion volume for Obama to have a correlation to the polls, postulating that simple attention may be related with popularity, at least for Obama. Some researchers have came out cautioning against treating social media as a “black box” and letting wishful thinking cloud the analysis of sentiment in political sphere [5]. Metaxes et al. [12], for example, find that electoral predictions using various previously published methods on Twitter data is no better than chance. Among these techniques are discussion volume, lexicon-driven sentiment classification, and user-specific political leaning estimation. Still, some researchers continue to use lexicon-driven classifiers without evaluating their performance [1, 7, 19]. In leu of recent news media and political campaign attention to political discourse online, it is imperative, then, to better understand the nature and limitations of this data. Thus, we attempt to closely examine the nature of political speech on social media, and evaluate its predictive power of real-world phenomena. In this paper, we examine the discussion surrounding the 2012 GOP Presidential candidate selection process. Throughout 2011 and 2012, the US Republican party chooses a nominee for the 2012 Presidential election. This process is highly public, and in-
cludes many television appearances and debates. By developing a large annotated corpus, we examine the sentiments expressed about these politicians, and the users expressing them. Furthermore, instead of using a lexicon-driven system, we implement and test a data-driven political sentiment classifier. Recently, similar systems employing data mining techniques have been used to identify stances in ideological debates [18] and predictive opinions [8]. Instead, we provide an evaluation of a highly optimized multi-stage approach designed for general-purpose political sentiment classification. In short, this project contributes the following to the political analysis of social media: 1. We build and optimize a multi-stage data-driven sentiment classifier. 2. We analyze sentiment expression in a large sample of Twitter messages, and show the differences between groups of users varying in posting frequency. 3. We perform sentiment tracking experiments in which we compare the sentiment found before and after 19 debates to public opinion polls. 4. We contribute an annotated dataset spanning the second half of 2011 and seven popular Republican Presidential nominee candidates, totaling 6,400 documents annotated for relevance, sentiment about the politician, sentiment intensity, and various stylistic measures.
2.
RELATED WORK
The recent role of social media in political actions in US, Middle East, and elsewhere around the world has produced a gamut of studies on mining of political speech online. A report on Social Media in the Arab World recognizes “the pivotal role of the microblogging [Twitter] site [...]” and “the role that social media will continue to play in Tunisia, Egypt, and the rest of the Arab world” [6]. Thus, from tracking discussions of political debates [3] to predicting election outcomes [19], social media has become a gold mine for political sentiment research. For example, [10] use social media to determine whether news sources are biased in favor of covering one political party more than another. Focusing on representation of political figures in Twitter, [16] have developed a way to detect astroturf (politically-motivated speech which creates appearance of widespread support for a candidate or opinion). Elections have been studied through the lens of social media: [11] examine the usage patterns of social media by US political parties in the 2010 Midterm Election, whereas [4] look at the conversations surrounding German political parties during the 2009 Federal Elections and SaezTrumper et al. [17] further improve on their approach by considering only the unique authors in the analysis. However, recent papers such as those by Gayo-Avello, Meta-xas, and Mustafaraj [5, 12] question the power of social media to predict political phenomena. Partially, their skepticism stems from the questionable quality of sentiment analysis tools which are applied to the problem. In particular, sentiment lexicons used to detect the polarity of individual words and phrases suffer from vocabulary mismatch and a lack of context sensitivity. Instead, they propose to go “one step further” and use the machine learning
approach. They further acknowledge the complex nature of political discourse, and the need for a deeper understanding of political conversation. In this paper we address both of these concerns by annotating thousands of political tweets for political agreement, sentiment strength, and style, and evaluate experimentally this data’s predictive power.
3.
DATA COLLECTION
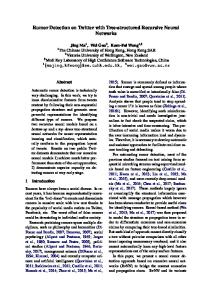
We begin by describing the political speech dataset we have created for the purpose of political sentiment analysis. This data is available upon request. Using Twitter Search API we collected tweets mentioning various politicians, the names of which have been manually composed into queries in order to increase precision. The collected tweets span a year, over the period of January 1, 2011 to January 11, 2012 and include tweets about the politicians listed in Table 1. These are some of the Republican politicians who joined the race for Republican nomination for the US Presidential Election of 2012. Some of these joined later in the year, and thus tweets about them do not span the full year. Figure 1 shows the discussion volume (in number of tweets mentioning the politician in a week). Notice that the discussion becomes more lively towards the end of the year. Guided by these trends, we select a time span in which to sample the data for each politician – choosing months in which sufficient posting activity is seen. The rightmost two columns of Table 1 show the time spans and the number of tweets sampled from that time span. The sampling was done in a random uniform fashion within each month, and duplicates and retweets were removed. The subset, totaling in 6,400 tweets was annotated by a group of political science students as a part of class project. Each annotator was given the name of the target politician and a set of tweets. For each tweet, she decided whether the tweet was about the politician by making a Relevance judgment. If the tweet was relevant, she would decide on whether the tweet was For or Against the politician, had Mixed opinion, or was Neutral. We also allowed for a Can’t Tell option. Furthermore, if the tweet was For or Against the politician, the annotator needed to select the Intensity of the opinion. Finally, several stylistic features of the text were collected: whether tweet contained Sarcasm, Humor, Swearing, or a Quote. Some of the tweets were annotated by several (maximum of three) annotators, and majority vote or third annotation broke ties in the cases of disagreement. Table 2 shows annotator agreement as percentage overlap of the labels. The most difficult tasks proved to be Sentiment and Intensity. Because these are not binary tasks (for sentiment, for example, there are five classes), these numbers are reasonable. Thus, we look at the sentiment data in steps: first we determine agreement in subjectivity (distinction between {For, Against, Mixed } and {Neutral }), then in polarity (For versus Against). Subjectivity proves to be a harder task than polarity. That is, once it is known that the tweet is subjective, it becomes easier to gauge polarity. The labeling interface also allowed annotators to resolve some of their disagreements. Out of these, 19.0% were about Relevance, 73.1% about Subjectivity and only 7.9% about Polarity. As a measure of the human classification performance, these figures put an upper bound to the performance we would expect from our automated classification algorithms.
Table 1: Republican Presidential nomination race dataset statistics Full Dataset Annotated Subset Politician Time Span # Tweets Time Span # Tweets Michele Bachmann 1/13/11 - 1/11/12 2,006,034 6/1/11 - 1/1/12 1,400 (excluding Oct.) Newt Gingrich 1/1/11 - 1/11/12 1,725,271 11/1/11 - 1/1/12 600 Herman Cain 5/26/11 - 1/11/12 1,514,739 9/1/11 - 1/1/12 1,000 Rick Perry 5/27/11 - 1/11/12 1,641,646 7/1/11 - 1/1/12 1,400 Mitt Romney 1/4/11 - 1/11/12 3,170,260 10/1/11 - 1/1/12 800 Ron Paul 1/5/11 - 1/11/12 2,342,392 10/1/11 - 1/1/12 800 Rick Santorum 1/2/11 - 1/11/12 1,125,602 12/1/11 - 1/1/12 400
Figure 1: Tweet volume for individual politicians in full dataset
4.
SENTIMENT ANALYSIS
Table 3 shows the relevance and sentiment statistics for each politician and their aggregates based on manually annotated data. One of the most striking features is high percentage of relevant documents – 94.8% on average. The accuracy of our retrieval method – querying Twitter Search API using politician’s names – supports the widespread use of this technique in the literature [3, 2, 19]. Looking at sentiment annotations, nearly 10% of the tweets were labeled as Can’t Tell, with Gingrich having the highest %, and another 25% as Neutral, leaving 65% of the documents with subjective labels. We also observe the dominant sentiment class to be Against, with a notable exception of Ron Paul, whose For tweets outnumber Against nearly 2 to 1. Following [3], we summarize sentiment expressed in these documents by subtracting the number of Against tweets from For, resulting in a summary score of expressed sentiment. In general, the number of For and Against documents reflects the overall posting rate, but with Against at a greater rate. An example is shown for Cain in Figure 2, the rest omitted for brevity. The sentiment score is positive at the beginning of Mr. Cain’s campaign. But as for most other politicians, it quickly becomes negative. Again, the exception is Ron Paul whose sentiment score is positive throughout. We also examine the intensity associated with each of the
Figure 2: Volume (blue) and sentiment score (red) for Herman Cain
sentiments in Table 4. Tweets with Neutral sentiment show the least number of excited and passionate tweets, whereas those with For sentiment show the greatest. Note that a politically neutral tweet can still be excited, such as in ambiguous questioning: “Did Michele Bachmann Jump the Shark by Suggesting HPV Vaccine Can Cause “Mental Retardation”? http://t.co/48zMcaN ”. However, we find that on average 78% of the tweets are not particularly more intense than “normal”. Table 5 shows the distribution of various stylistic features across tweets about each politician and in For and Against
Table 2: Annotator agreement Relev. Sent. Subj.* Pol.* Bachmann 0.871 0.493 0.802 0.924 Gingrich 0.572 0.271 0.379 0.569 Cain 0.816 0.436 0.700 0.807 Perry 0.792 0.436 0.652 0.784 Romney 0.826 0.446 0.642 0.817 Paul 0.794 0.374 0.651 0.616 Santorum 0.726 0.407 0.560 0.710 Average 0.793 0.425 0.660 0.776
as percentage label overlap Int. Sarc. Humor Swear. Quote 0.460 0.854 0.751 0.975 0.865 0.212 0.587 0.533 0.598 0.526 0.452 0.762 0.677 0.845 0.758 0.420 0.782 0.654 0.819 0.733 0.404 0.861 0.828 0.872 0.850 0.478 0.791 0.737 0.828 0.733 0.369 0.728 0.678 0.742 0.723 0.416 0.784 0.701 0.839 0.760
Table 3: Subset relevance and sentiment statistics Sentiment (counts) Sentiment (%) total relevant rel % for aga mix neu ctt for aga mix neu ctt Bachmann 1400 1295 92.5 115 728 31 317 105 8.9 56.2 2.4 24.5 8.1 Gingrich 600 575 95.8 69 218 20 160 108 12.0 37.9 3.5 27.8 18.8 Cain 1000 947 94.7 202 450 23 203 71 21.3 47.5 2.4 21.4 7.5 Perry 1400 1340 95.7 126 743 39 297 135 9.4 55.4 2.9 22.2 10.1 Romney 800 760 95.0 104 310 32 254 60 13.7 40.8 4.2 33.4 7.9 Paul 800 758 94.8 303 161 31 166 97 40.0 21.2 4.1 21.9 12.8 Santorum 400 389 97.3 76 150 19 128 16 19.5 38.6 4.9 32.9 4.1 Total/Avg 6400 6064 94.8 995 2760 195 1525 592 16.4 45.5 3.2 25.1 9.8
Table 4: Intensity associated with different sentiments (percent of total) For Against Mixed Neutral Passionate 8.3 6.6 3.5 0.9 Excited 19.5 15.2 18.8 2.2 Normal 72.2 78.2 77.6 97.0
All 6.6 15.4 78.0
tweets separately. We find 21.6% of all tweets in the dataset to be humorous and 7.4% sarcastic. These are not evenly distributed between the politicians. For example, discussion about Bachmann and Cain are especially laden with sarcasm and humor. Strikingly, 40% of Against tweets are humorous, compared to only 5.7% of those For the politician. They are also more likely to contain swear words. Discussion about Mitt Romney, the politician to ultimately become the official republican Presidential nominee, shows much less of such rhetoric. We also note that a humorous tweet is 76.7% likely to also be sarcastic (but sarcastic tweets is only 26.2% likely to be humorous). This connection between sarcasm and humor would be an interesting future study.
5.
USER STRATIFICATION
We further examine data by stratifying the users, as in Mustafaraj et al. [13], who discover that political discussion is dominated by power users (a vocal minority), leaving the opinions of the rest (the silent majority) underrepresented in a corpus which has been randomly sampled. We expand their analysis by characterizing these two groups in terms of sentiment they tend to express. As predicted, user posting behavior in our dataset follows power law – with few users posting thousands of messages and a vast majority posting very few. We separate all users in our dataset into five quintiles according to their posting behavior (see Table 6). To
do this, we separate the users into groups where each group is responsible for roughly a fifth of all content. The first group consists of 78.5% of all users in the dataset, in which users post an average of 1.7 tweets (that’s over the span of a year). The most active group, however, consists of just 0.2% of all users, but it generated 15.9% of the tweets with an average of 4,164.5 tweets/year per user. Figures 3 show sentiment and stylistic features of the tweets from each of the user group. Additional Twitterspecific features (bottom four) were extracted using regular expressions. The results are shown for Ron Paul and other politicians separately, because of the unusually positive overall sentiment of Mr. Paul’s subset. We see many tendencies: the vocal group tends to be more for and less against the politician, and post more neutral tweets. It is also less sarcastic or humorous, but is more likely to use hashtags and links, and to retweet. They are unlikely to post a tweet without any hashtags, links or retweet (“Only text”). Ron Paul tweets show the same trends, except for the prominence of For sentiment. Upon examining a selection of users from most and least vocal (around 70 users from each group), we note that whereas all users from the least vocal group were accounts owned by individuals (many of which had very few tweets), only 65% were individual accounts in the vocal group. These accounts have thousands of followers, and many have their own blogs or websites: 31% of the vocal group were campaigning for some political cause, and the last 4% were news sites. The significance of these peculiarities is that the vast difference in posting frequency of these users skews the overall sentiment of the data. When polls measure favorability, each polled person is counted equally. This is not the case when each tweet is counted as a “vote”. Thus, counting users instead of individual tweets may be a better approach when comparing sentiment expressed on Twitter to traditional polls. In summary, our annotated dataset reveals a discussion
Bachmann Gingrich Cain Perry Romney Paul Santorum All
sarc 13.8 3.3 10.8 6.5 2.4 3.6 3.9 7.4
Table 5: Stylistic features (percent of total) All Relevant For Against humor swear quote sarc humor swear quote sarc humor swear 28.8 4.8 17.9 1.7 7.0 0.0 13.9 23.4 44.1 8.0 13.7 2.3 11.0 0.0 4.3 0.0 14.5 8.7 30.7 6.0 29.0 6.5 20.4 3.5 6.9 2.0 22.8 19.8 52.9 12.4 29.6 3.3 10.2 2.4 4.8 4.0 7.1 11.0 47.8 4.8 7.6 0.4 4.1 1.9 3.8 0.0 3.8 4.2 11.9 1.0 9.0 1.6 19.7 2.0 6.6 1.7 22.4 13.0 24.2 3.7 15.9 1.8 4.9 1.3 2.6 0.0 5.3 8.7 37.3 4.7 21.6 3.3 13.6 2.1 5.7 1.4 15.8 14.7 40.3 6.5
quote 22.7 16.5 25.3 12.5 6.1 25.5 5.3 17.2
Table 6: Users grouped by posting behavior (in original dataset) Group # # of users % of all users tweets generated % of all tweets tweets/user 1 2,461,806 78.5 3,133,990 23.2 1.7 2 505,786 16.1 2,805,942 20.7 7.6 3 130,398 4.2 2,728,078 20.2 29.1 4 34,559 1.1 2,710,589 20.0 124.3 5 5,278 0.2 2,147,345 15.9 4164.5
65% of which is opinionated speech, which is laden with humor and sarcasm. It showed the power-users to be more for the politician they are tweeting about, and to be less sarcastic, humorous, and use fewer swear words. The sample set also contains links (in 55.2% of sampled tweets), hashtags (31%), and retweets (36.4%). Compare these to a general subset we collected to estimate general Twitter use consisting of 5 million tweets, 13.0% of which had links, 16.5% had hashtags and 13.1% retweets. The opinionated speech is mostly biased against the politicians (except for the case of Ron Paul), and in which users with different posting behaviors exhibit different biases. The skewed negative bias, the prevalence of humor and sarcasm, and the dominance of power users in the political discourse data all may negatively impact classification performance. Next, we apply a machine learning approach to political sentiment classification.
6.
CLASSIFICATION
In this section, we develop a political sentiment classifier and evaluate it using our labeled dataset. We build the classification models using SVMlight1 , which gives us some flexibility for tuning of the class selection. Using Lingpipe2 tokenizer, we extract 1-, 2-, and 3-grams as a feature vector. Punctuation and special characters were not removed at this step and no stemming was performed on the words in order to capture twitter-specific features such as hashtags, mentions, and emoticons. Preliminary studies showed it to be beneficial to compute the models for the dataset as a whole instead of building one for each politician, and we take this approach. Overall design of our model is shown in Figure 4. The classification is done in two stages. First, three binary classifiers (one for detecting For, Against, and Neutral sentiments) each produce a score indicating the extent to which the document belongs to that class. These are then used to determine the label of the document by the final classifier. 1 2
http://svmlight.joachims.org/ http://alias-i.com/lingpipe/
Figure 4: Multi-step classification design
The accuracy, and the average precision, recall, and fscore measures for the un-tuned classifier are shown in the Table 7 under Default SVMLight. Notice that in overall performance the Accuracy is computed for the final classifier instead of taking an average of individual class accuracies, showing the overall accuracy instead of by-class accuracy. Due to the low recall for minority classes – For and Neutral – the overall accuracy is rather low. We attempt to improve this performance by tuning the two steps of the algorithm. To determine the class of a document SVMlight looks at the polarity of a score, which ranges roughly between -1 and 1. The magnitude of this score can be considered as the confidence of the classifier. Thus we introduce a notion of “cutoff”, such that if the score is greater than the cutoff, the class decision is accepted. Furthermore, we may also want to change the value 0 as being the class cross-over point. We can “bias” the classifier by shifting this point closer toward -1 or 1. That is, if we change the cross-over point to -0.2, all documents in the range of [-0.2, 0.0] are now considered in the positive class instead of negative. We use a tuning set to determine the best values of the cutoff and bias by examining performance metrics at various values of these two parameters. We choose the best bias and cutoff
Figure 3: Sentiment and stylistic features within stratified user groups from least vocal (1) to most vocal (5), left: excluding Ron Paul, right: Ron Paul only
values at which at least half of all documents are being classified. These are 0.2 cutoff and 0.8 bias for For and Neutral classifiers and 0.5 cutoff and 0.5 bias for Against classifier. In order to improve the performance of the final classifier, instead of using heuristics for determining the final class label, we train a logistic regression classifier (using Weka) using the outputs of the three classifiers as features. The final classification performance is shown in Table 7 under Tuned SVMLight + Regression. To further optimize our classifier we also tried anonymizing the data set by replacing the names of the target politicians with a bogus feature, but such approach did not yield a superior performance. It may be the case that politician’s names have distinguishing qualities which aid the classifier in its task (Ron Paul, for example, is likely to be highly associated with the For class).
7.
TRACKING SENTIMENT
Using classifier developed in previous section we now track change in sentiment. We focus on the time spans around Republican debates taking place during the 2011. A list of these debates was collected from 2012 Presidential Election News website3 . We also collect the poll numbers for each of our politicians from Real Clear Politics4 , a website which collects information from national polls including Gallup, Rasmussen, Reuters, and others. Figure 5 shows the poll numbers for the seven politicians with vertical lines at the debates (19 in total). For each debate, we collect a sample of 10,000 documents 5 days before and 5 days after the debate. The five-day window was chosen to accommodate the fact that the polls are not updated on a daily basis. We then apply Tuned SVMlight + Regression classifier to assign labels to the sampled documents. Our goal is to predict the change of sentiment that often happens around debates. We compare the change in predicted class to that of the polls. Not all seven politicians participated at all of the polls, and our data did not cover some of the debates. The final experiment consisted 3 http://www.2012presidentialelectionnews.com/2012debate-schedule/2011-2012-primary-debate-schedule/ 4 http://www.realclearpolitics.com/epolls/2012/president/ us/republican presidential nomination-1452.html
of 104 predictions of sentiment change for a politician before and after debate. We take several approaches to estimating sentiment change: • For: number of For documents after the debate minus before • Against: number of Against documents before the debate minus after (reversed in order to show change in favorability) • For-Against: number of For documents minus Against documents after the debate minus the same before • For-Against Mod: same as For-Against, with For numbers boosted according to the average For to Against ratio (estimated using training set) • * (U): same as above, but normalizing contribution of each tweet by the number of tweets the author has in polarity:{−1,+1} the sample: tweet #tweets by user • Volume: number of all documents after the debate minus before The performance of these approaches for each candidate is shown in Table 8. We also show the performance of a baseline based on the historical sentiment change in the polls: we predict sentiment change for a politician after a given debate according to the majority of sentiment changes in the previous debates for a that politician. For example, by the fourth debate in which Ron Paul participated, we have witnessed two debates after which the sentiment about him becomes more positive and one in which it becomes more negative, so we guess a positive change. Looking at prediction accuracy, we see different predictors performing differently for each politician. Ron Paul’s sentiment change can be predicted quite well just by looking at the volume of conversation about him (which tends to be positive, unlike for the other candidates). Change in For and in Against documents showed different results. For example, the change in For documents predicts Romney sentiment change much better than the Against, but this is reversed for Herman Cain. Furthermore, normalizing the contribution of tweet
Table 7: SVMlight combined classifiers Default SVMlight Accuracy Avg Prec Avg Rec Avg F-measure Overall performance 0.269 0.595 0.357 0.295 Accuracy Precision Recall F-measure For 0.849 0.740 0.037 0.071 Against 0.578 0.680 0.556 0.612 Neutral 0.432 0.750 0.095 0.168 Other 0.475 0.211 0.738 0.328 Tuned SVMlight Accuracy Avg Prec Avg Rec Avg F-measure Overall performance 0.476 0.511 0.445 0.440 Accuracy Precision Recall F-measure For 0.855 0.590 0.225 0.326 Against 0.594 0.681 0.553 0.610 Neutral 0.521 0.522 0.440 0.478 Other 0.632 0.251 0.561 0.347 Tuned SVMlight + Regression Accuracy Avg Prec Avg Rec Avg F-measure Overall performance 0.544 0.529 0.432 0.434 Accuracy Precision Recall F-measure For 0.852 0.551 0.249 0.344 Against 0.592 0.565 0.836 0.674 Neutral 0.634 0.496 0.503 0.500 Other 0.826 0.503 0.139 0.218
sentiment by number of tweets posted by its user (U) increases the match for For and Against approaches. However, not any one of the approaches correlates well with the official poll results, and none are statistically better than the baseline. After computing Pearson correlation between these measures and the poll numbers, we also see very low numbers, with highest at 0.08. We examine further the latest of the examined debates, one which took place on Jan 7, 2012. According to the polls, Gingrich did very poorly around the same time, seeing his numbers go from 27.4 (on Jan 2) to 16.6 (on Jan 11). The reverse is true for Santorum, whose numbers went from 4 (on Jan 2) to 15.8 (on Jan 11). The majority of these popular tweets are anti-Gingrich jokes, with only one pro-Gingrich tweet. Also note that the popular jokes do not seem to be propagating because of an organized effort (such as in tweet supporting Gingrich – “RT our new video”), and they do not link to outside sources, but they are propagated just because the users thought they were worthy of sharing with others. For Santorum, the popular tweets also look quite bleak, with all of them jokes, and very few have Twitter-specific features which would make the tweet more searchable and retweetable (like hashtags, links, or pleas for users to retweet). We conclude that, although an expression of sentiment, much of tweeting may not be considered “serious” political discussion.
8.
DISCUSSION & FUTURE WORK
The overall tendency towards the Against class in our dataset, as well as the fact that sentiment we find around the debates does not correspond well to that found in national polls suggests that political discourse on Twitter is
not indicative of that of the nation as a whole. Because the politicians we examine in this project are Republicans (with possible exception of Ron Paul who has claimed to be Libertarian), it may be the case that an overall leaning of Twitter is more liberal. This may also be supported by Twitter’s young user base (mostly under 30)5 . A future analysis of the conversation about both Republicans and Democrats, as well as the users most active in this conversation, would shed more light on this issue. Ron Paul, a libertarian politician who has been known for his young user base6 , proves to be an exception to the rule on many occasions. Although ultimately his campaign was unsuccessful, the overwhelming support he receives on social media is unusual. It would be interesting to compare his campaign to that of Barack Obama (a democrat) during the 2008 Presidential Election, who also has successfully used internet to rally a young base. One could argue that comparing immediate reactions on Twitter to real-world events does not account for a lag in news and opinion propagation through the social network. Instead, one can check whether Twitter sentiment is predictive of or responsive to the national polls by “shifting” the times at which the sentiments are compared, for instance, by comparing earlier Twitter sentiment to later national polls. We may find a delayed response in Twitter to debates or other newsworthy events, but it would be even more interesting to find a sentiment which is first expressed in Twitter, and then in national polls. Second, we may examine polls which focus on a particular demographic, perhaps a younger 5
http://www.sysomos.com/insidetwitter/ http://www.huffingtonpost.com/2012/01/12/ron-paulyoung-voters n 1202616.html 6
Figure 5: Polls (approval %) for seven select politicians with debate days marked by vertical lines
Table 8: Predicting change in sentiment before and after debates: accuracy Bachmann Gingrich Cain Perry Romney Paul Santorum Avg For (T) 66.7 50.0 38.5 46.2 78.6 53.3 56.3 55.77 For (U) 60.0 55.6 30.8 53.8 78.6 60.0 68.8 58.65 Against (T) 53.3 44.4 69.2 61.5 28.6 40.0 50.0 49.04 Against (U) 66.7 38.9 61.5 61.5 42.9 40.0 50.0 50.96 For-Against (T) 60.0 50.0 69.2 61.5 28.6 46.7 50.0 51.92 For-Against (U) 60.0 55.6 69.2 53.8 28.6 40.0 56.3 51.92 For-Against Mod (T) 66.7 50.0 69.2 46.2 35.7 46.7 43.8 50.96 For-Against Mod (U) 60.0 50.0 69.2 53.8 35.7 40.0 50.0 50.96 Volume 53.3 66.7 46.2 46.2 57.1 73.3 50.0 56.73 Majority baseline 56.7 63.9 46.1 69.2 67.9 46.7 56.2 58.10
population, or that which is more likely to express political opinion online. Similarly, there may be network characteristics which relate to sentiment, with “authorities” having more influence on Twitter sentiment. Finally, as Mustafaraj et al. [13] point out, uniform sampling of data may be detrimental to political predictions. More research into the effect of influential bloggers and Twitter users, as opposed to the rest of the users, on the predictive power of statistical algorithms could be useful in limiting the amount and improving the quality of social media data that is useful.
9.
CONCLUSION
The most striking feature of our political data was an overwhelming negative bias toward all politicians with an average ratio of 3.76 Against to 1 For tweets, except for Ron Paul who shows 0.53 to 1 ratio. The negative sentiment is sometimes matched by the positive at the beginning of the politician’s campaign, but as a rule quickly returns to an overall negative sentiment. These negative documents are often humorous (40.3%) and/or sarcastic (14.7%), and sometimes contain swear words (6.5%). This, and the amount of polarity skew, makes polarity classification of political discourse difficult. By stratifying the users by the frequency of their postings, we find distinctly differing behaviors between the “silent majority” and “vocal minority” (terms coined by Mustafaraj et al. [13]). The vocal group tends to be more For and less
Against the politician, it is less sarcastic and humorous, and is more likely to use hashtags, links, and retweet. Thus, if one counts users instead of tweets (as in traditional polls), the negative sentiment would be even more pronounced. Indeed, it may be useful to use stratified sampling paying special attention to the opinions of individual users. Using this dataset, we build and test a classifier to detect For, Neutral, and Against sentiments. We find that using out-of-the-box tools works nearly the same as the majority baseline, and only after some thorough tuning we improve overall accuracy from 0.269 to 0.544. We conclude that it is indeed a difficult task, and that researchers tracking political sentiment on Twitter should be wary of using untuned outof-the-box tools without evaluation. Using this classifier, we track sentiment expressed about each of the politicians change before and after 19 republican debates. We compare this sentiment to national polls, and find that overall the sentiment we find in the tweets does not well correspond to that in the polls. Examining the most popular tweets further, we find them mostly to be joking banter about the politicians, all negative – even for the politicians whose national poll numbers were improving. More future work must be done in order to determine whether this truly points to an overall anti-republican or liberal-leaning bias in the Twittersphere.
10.
REFERENCES
[1] J. Bollen, A. Pepe, and H. Mao. Modeling public mood and emotion: Twitter sentiment and socio-economic phenomena. World Wide Web Conference (WWW), 2010. [2] M. D. Conover, J. Ratkiewicz, M. Francisco, B. Goncalves, F. Menczer, and A. Flammini. Political polarization on twitter. International Conference on Weblogs and Social Media (ICWSM), 2011. [3] N. A. Diakopoulos and D. A. Shamma. Characterizing debate performance via aggregated twitter sentiment. Conference on Human Factors in Computing Systems (CHI), 2010. [4] A. Feller, M. Kuhnert, T. O. Sprenger, and I. M. Welpe. Divided they tweet: The network structure of political microbloggers and discussion topics. International Conference on Weblogs and Social Media (ICWSM), 2011. [5] D. Gayo-Avello, P. T. Metaxas, and E. Mustafaraj. Limits of electoral predictions using twitter. International Conference on Weblogs and Social Media (ICWSM), 2011. [6] J. Ghannam. Social media in the arab world: Leading up to the uprisings of 2011. A Report to the Center for International Media Assistance, Febuary 2011. [7] S. Gonzalez-Bailon, R. E. Banchs, and A. Kaltenbrunner. Emotional reactions and the pulse of public opinion: Measuring the impact of political events on the sentiment of online discussions. http://arxiv.org, 2010. [8] S.-M. Kim and E. Hovy. Crystal: Analyzing prediction opinions on the web. Proceedings of the Joint Conference on Empirical Methods in Natural Language Processing and Computational Natural Language Learning (EMNLP-CoNLL), 2007. [9] W.-H. Lin, T. Wilson, J. Wiebe, and A. Hauptmann. Which side are you on? identifying perspectives at the document and sentence level. Conference on Natural Language Learning (CoNLL), 2006. [10] Y.-R. Lin, J. P. Bagrow, and D. Lazer. More voices than ever? quantifying media bias in networks. International Conference on Weblogs and Social Media (ICWSM), 2011.
[11] A. Livne, M. Simmons, E. Adar, and L. Adamic. The party is over here: Structure and content in the 2010 election. International Conference on Weblogs and Social Media (ICWSM), 2011. [12] P. Metaxas, E. Mustafaraj, and D. Gayo-Avello. How (not) to predict elections. International Conference on Social Computing, 2011. [13] E. Mustafaraj, S. Finn, C. Whitlock, and P. T. Metaxas. Vocal minority versus silent majority: Discovering the opinions of the long tail. International Conference on Social Computing, 2011. [14] B. O’Connor, R. Balasubramanyan, B. R. Routledge, and N. A. Smith. From tweets to polls: Linking text sentiment to public opinion time series. International AAAI Conference on Weblogs and Social Media (ICWSM), 2010. [15] B. Pang and L. Lee. Thumbs up?: sentiment classification using machine learning techniques. Conference on Empirical Methods in Natural Language Processing (EMNLP), 10:79–86, 2002. [16] J. Ratkiewicz, M. D. Conover, M. Meiss, B. Goncalves, A. Flammini, and F. M. Menczer. Detecting and tracking political abuse in social media. International Conference on Weblogs and Social Media (ICWSM), 2011. [17] D. Saez-Trumper, W. Meira, and V. Almeida. From total hits to unique visitors model for election’s forecasting. International Conference on Web Science, 2011. [18] S. Somasundaran and J. Wiebe. Recognizing stances in ideological on-line debates. NAACL HLT Workshop on Computational Approaches to Analysis and Generation of Emotion in Text, 2010. [19] A. Tumasjan, T. O. Sprenger, P. G. Sandner, and I. M. Welpe. Predicting elections with twitter: What 140 characters reveal about political sentiment. Association for the Advancement of Artificial Intelligence Conference (AAAI), 2010. [20] M. Wagner. Obama election ushering in first internet presidency. http://www.informationweek.com/news/government/ 212000815, 2008.