Albanian j. agric. sci. ISSN: 2218-2020, (2012), (Special Edition) Copyright © Agricultural University of Tirana
HEMATOLOGICAL AND HEMATOBIOCHEMICAL INDICATORS INFLUENCED BY SUBACUTE RUMINAL ACIDOSIS (SARA) IN DAIRY COWS EMILIAN SHABANI*; VANGJEL CERONI, LUIGJ TURMALAJ Faculty of Veterinary Medicine, Tirana. *Author of correspondence; Email:
[email protected] Abstract: The study aims to assess the impact of sub acute ruminal acidosis (SARA) in dairy cows in some hematological and hematobiochemical indicators. The study was done in the period January 2010 to January 2012 at 5 cow farms with intensive breeding system. In 60 cows, in the first stage of lactation was followed the performance of ruminal pH content about three months after calving, hematological and hematobiochemical indicators. From cows in the experiment we took samples ruminal fluid and blood from jugular vein in tubes with and without anticoagulant. Hematological indicators were assessed total white cells (WBC), red cells (RBC), hemoglobin (HB), hematocrit (HCT), mean corpuscular volume (MCV), corpuscular hemoglobin (MCH), ratio between red cells and white blood cells (RDV) and total platels (PLT). Among the hematobiochemical indicators in blood serum were studied levels of glucose, total protein, total calcium, inorganic phosphorus, magnesium and total bilirubin. Based on the ruminal pH values, the animals were divided into three groups, control group and two experiment groups. The data obtained were processed statistically, differences between groups were defined dependencies and correlative relations. Significant differences and verified statistically (p < 0.05) were found for the WBC, HCT, level of glucose, total calcium and total bilirubin. The data obtained showed that in the course of developing SARA significant changes arise in several hematological and hematobiochemical indicators which can be used for clinical orientation controls. Key words: Ruminal pH, hematologic profile, glucose, calcium, phosphorus.
1. Introduction Sub acute ruminal acidosis (SARA) is displayed with high density in dairy cattle farms especially in the early period of lactation, [2]. From this pathology caused significant direct and indirect economic damage manifested by decreased appetite, lameness, mastitis, dermatitis, rumenitis and reproduction indicators disorders. SARA condition is often underestimated as evidenced by clinical signs. Setting the correct diagnosis for SARA is complex and relies on food control and nutrition, as well as analysis of ruminal fluid pH. Appropriate technique that ensures obtaining ruminal fluid is ruminocentesis because it makes possible recognition of the state of ruminal content at the time of control. Current studies are directed at finding other methods avoiding rumenocentesis, for indirect and early diagnosis of SARA, to apply in a timely and proper manner dietary adjustments and avoid the risk of advancing the more acute situation. In this regard, our study aims and which requires finding new methods to control indirectly the state of SARA, through the values of hematological and hematobiochemical indicators that changes under the influence of this situation. 2. Material and methods In the period January 2010 – January 2012, was studied the influence of SARA in several
hematological and hematobiochemical indicators to high production dairy cows. The study was conducted in 5 cow farms with intensive breeding system. In each farm were selected at random 12 cows in the first stage of lactation (35 ± 25 days) without the presence of clinical signs of disease, and in good physical condition. From cows were sampled ruminal fluid and blood from jugular vein. Ruminocentesis was selected as the best possible techniques for getting ruminal fluid [1; 7; 2]. Ruminal fluid sampling was performed with syringe, in the amount of 20 ml, 4 - 6 hours after the distribution of food rations and pH was measured immediately with portable pH meter. Blood samples were collected from the same cows in jugular vein. Blood samples were placed in tubes with and without anticoagulant. The latter than centrifuged with 2500 laps per minute, for 20 minutes to make the serum. From blood samples were determined total white cells (WBC), red cells (RBC), hemoglobin (HB), hematocrit (HCT), mean corpuscular volume (MCV), corpuscular hemoglobin (MCH), the ratio between white blood cells and red cells (RDW), and total platels (PLT) with standart methods. From hematobiochemical indicators we studied the level of glucose, total protein, total calcium, inorganic phosphorus, magnesium and total bilirubin with standart methods. According to the results obtained for pH in ruminal fluid, animals in the study divided into three groups: Group A, animals with average of ruminal pH 5.8 to 6.2 (or the control
Shabani et al
group with healthy animals). Group B, animals with average of ruminal pH 5.6 to 5.8 (or the first group of experiment with animals in risk for SARA) and group C, with average of ruminal pH < 5.6 (or the second group of experiment with animals affected by SARA). The data were processed statistically by analysis of variance to verify the effects of group and tests were applied to determine the impact of SARA in indicators studied, and statistically significant differences for the animals of three groups. We estimated statistical differences (p < 0.05) for various indicators in the study.
By gouping the data obtained for the average pH values of ruminal content (table 1) was observed that the largest number of cows (23 ose 38.3 %) consisted with normal values of ruminal pH content. In each group there were cows in different lactation period. The three groups were homogeneous average lactation days (respectively 32 ± 14, 38 ± 22 and 33 ± 16) and all animals were lack of external clinical signs for the presence of disease. Values of hematological and hematobiochemical indicators in cows of experiment and control groups are given in table 2 and 3.
3. Results Table 1: Mean values of ruminal pH and average days of lactation in cows of the experiment and control groups. Groups A- Control B- I-st experiment grup (risk animal) C- II-nd experiment grup (animal with SARA)
Heads 23 16
% 38.3 26.6
21
35.0
Lactation day 32±14 38±22 33±16
Ruminal pH 6.01±0.20 5.64±0.22 5.54±0.24
Table 2: Mean values of hematological parameters in cows by groups, Group A (normal), Group B (at risk) Group C (with SARA) . Indicator WBC (103/µl) RBC (106/µl) HGB (g/dl) HCT (%) MCV (fl) MCH (pg) RDW (%) PLT (103/µl)
Normal value 4 – 12 5 – 10 8 – 15 24 – 46 40 – 60 11 – 17 16.7 - 23.3 100 – 800
Group A 5.66 ± 1.35 6.17 ± 0.42 9.89 ± 0.46 29.93 ± 2.56 48.56 ± 3.36 16.88 ± 1.33 21.11 ± 1.27 603.2 ± 87.4
Group B 5.69 ± 2.33 6.33 ± 0.56 9.97 ± 0.81 29.78 ± 2.34 49.29 ± 3.24 16.92 ± 1.25 20.81 ± 1.62 632.6 ± 65.9
Group C 7.16 ± 1.18*† 6.35 ± 0.34 10.22 ± 0.62 29.57 ± 2.77 49.35 ± 2.41*† 16.94 ± 1.63*† 20.37 ± 1.39 628.8 ± 91.1
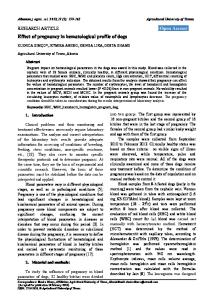
*: Significant changes compared to Group A (p <0.05); † against Group B (p <0.05). Reference values [8]. From our data it seems that the amount of red blood cells (RBC), hemoglobin (HGB), the ratio of red cells with white blood cells (RDW), total platels (PLT), mean corpuscular volume (MCV) and corpuskular hemoglobin (MCH) had no significant difference between the animals in the experimental groups compared with the rate values and indicator values in the control group. Indicator about the most visible impact of ruminal pH values was the total white cells. With less obvious connection was hematocrit index. Attachments and dependencies of factors relevant corelative links expressed and linear regression graph. Between pH of ruminal content and total white cells had correlative links (Graph. 1) negative character (r = - 0.485). Links with weak correlative but positive character (r = 0.299) was found between pH of ruminal content and hematocrit.
International Conference 31 October 2012, Tirana
Figure 1: Relationship between ruminal pH and total white blood cells (WBC). r = 0.485. WBR = 17.6 + (- 1.85 x ruminal pH)
10
Hematological and hematobiochemical indicators influenced by subacute ruminal acidosis (SARA) in dairy cows
Hematobiochemical indicators expressed as values in their conventional units with standard
deviation and are compared with reference values, [8] are given in Table 3.
Table 3: Mean values of hematobiochemical indicators in cows of experiment and control groups. Parameters Total protein (g/l) Glucose (mmol/l) General calcium (mmol/l) Inorganic phosphorus (mmol/l)
Reference Values 67 – 75 2.47 - 4.12 2.43 - 3.10 1.08 - 2.76
Control group 70.24 ± 5.36 3.21 ± 0.34 2.44 ± 0.19 1.26 ± 0.37
Group B 69.92 ± 6.86 3.19 ± 0.36 2.43 ± 0.22 1.57 ± 0.30*
Group C 68.92 ± 5.71 2.96 ± 0.37 2.41 ± 0.14 1.67 ± 0.13*
Magnesium (mmol/l) Total bilirubin (µmol/l)
0.74 - 1.10 0.17 - 8.03
1.02 ± 0.11 6.00 ± 1.58
0.89 ± 0.12* 5.71 ± 1.98
0.91 ± 0.08* 4.87 ± 1.31
*: Significant changes compared to the control group (p < 0.05). Reference values [8]. Statistical differences observed between the values of the indicators hematobiochemical in cows of all three groups are considered statistically significant difference when P < 0.05. From our data it seems that there was no significant difference for total protein concentration, total calcium and glucose. Magnesium, creatinine and total bilirubin significantly reduced in animals with ruminal acidosis. Statistically increase the phosphorus concentration in the three groups of cows in the study. Attachments and significant changes of the factors in the study are graphs of linear regression. From our data it seems that between ruminal pH values and total protein levels in serum has strong links correlative positive character (r = 0.628). About such positive character has and between ruminal pH values with the amount of glucose and total calcium. Significant connection correlative but negative character (r = - 0.650) has between ruminal pH values and inorganic phosphorus values, graph. 3.
Figure 2: Links between ruminal pH and total protein level. r = 0628 Total protein = 60.67 + (1.52 x ruminal pH).
Figure 3: Links between ruminal pH and inorganic phosphorus levels. r = - 0.650 Phosphorus Inorg. = 3.65 + (0.36 x ruminal pH)
In contrast the values of inorganic phosphorus, magnesium values increase with decreasing ruminal pH values, graph. 4. Between these two indicators has
strong links correlative positive character (r = 0.776) Figure 4: Links between pH rumenit and magnesium levels.r = 0776 Magnesium = 0.1 + (0.18 x ruminal pH)
International Conference 31 October 2012, Tirana
11
Shabani et al
Figure 5: Links between pH rumenit and total bilirubin level. r = 0777 Bilirubin tot. = - 1.58 + (1.2 x ruminal pH).
Strong links corelative positive character (r = 0777) has and between ruminal pH values and total bilirubin level, graph. 5. 4. Discussion The three groups of animals in the study were homogeneous for lactation days average values (respectively 32 ± 14, 38 ± 22 and 33 ± 16). All animals had no clinical signs for the presence of the diseases. Variations between groups in values of hematological and hematobiochemical indicators associated with various values of ruminal pH. The results of the study suggest that variations in pH of the ruminal contents affect the values of hematological and hematobiochemical indicators and the latter may be useful for indirect diagnosis of SARA status in dairy cows. Such conclusions reached and researcher [3; 5]. In our study the presence of SARA affected the levels of white cells in hematocrit in reducing the level of total protein and glucose. In dairy cows during SARA (except where the control group animals ruminal pH values were higher than 5.8) the largest changes observed in the increase in the number of white blood cells that occurs mainly on account of increased neutrophils and basophils. According [4], the phenomenon of increasing white blood cells detected by increased cortisol levels achieved in many different events in the period around calving. Macrominerals as total calcium, inorganic phosphorus and magnesium seem interested, more are related of after calving pathologies as milk fever and SARA condition, [9]. Fortunately, most of these minerals are strictly regulated in the body through a series of homeostatic processes. Their concentrations in blood serum are not reflective of the dietary status when these homeostatic systems function properly, [6]. Inorganic International Conference 31 October 2012, Tirana
phosphorus and magnesium are macrominerals whose serum concentrations are somewhat sensitive food ration consumption [10], therefore, the concentrations of these serum makrominerals should be interpreted with caution to see the operation of homeostase. These are interesting findings that suggest that the concentrations of macrominerals can be predictive and orientative. Given these data we believe that the concentration of magnesium and inorganic phosphorus were significantly affected in cows suffering from SARA, compared with total calcium level. Linear increase of the concentration of inorganic phosphorus as an indicator of SARA, is much more important than the reduction of total calcium and magnesium. 5. Conclusions • • •
•
•
•
In the first period after calving in cows with SARA, changes in hematological and hematobiochemical parameters are present. Hematological indicators affected by reduced pH values in ruminal content in cows are total white cells which grow and hematocrit decrease. The amount of red blood cells (RBC), hemoglobin (HGB), total platels (PLT) and mean corpuscular volume (MCV) are not affected by reduced values of ruminal pH content in cows. From reduced values of pH in ruminal content are affected all hematobiochemical indicators. More affected are the level of inorganic phosphorus, magnesium, and total bilirubin. Changes in the values of hematological and hematobiochemical indicators affected by reduced pH values in ruminal content in cows are confirmed statistically. Values of hematological and hematobiochemical indicators can be used for indirect diagnosis of ruminal subacute acidosis in dairy cows.
6.- References 1. Duffield T, Plaizier JC, Fairfield: Comparison of Techniques for measurement of rumen pH in lactating Dairy cows. Journal of Dairy Science 2004, 87: 59-66. 2. Garret EF, Perreira MN, Nordlund KV: Diagnostic methods for the detection of subacute ruminal acidosis in Dairy cows. J. Dairy Sci 1999, 82: 1170-1178. 3. Gozzho G, Krause D: Ruminal lipopolysaccharide Concentration and inflammatory response during grain induced
12
Hematological and hematobiochemical indicators influenced by subacute ruminal acidosis (SARA) in dairy cows
subacute ruminal acidosis in Dairy cows. J. of Dairy Science 2007, 90: 856 - 866. 4. Meglia G, Johanesisson A: Changes in some blood micronutrients, leukocytes and neutrophil expression of adhesion molecules in periparturient Dairy cows. Acta Vet SCANDIA 2001, 42: 139 - 150. 5. Morgante M: Subacute rumen acidosis in lactating cows: an Investigation in intensive Italian Dairy herds. J. of Animal Physiology and Animal Nutrition 2007, 91: 226-234. 6. Garry F: Indigestion in ruminants. Large Animal Internal Medicine, 3rd EDN. 2002, 722747. Mosby, St. Louis and Baltimore.
International Conference 31 October 2012, Tirana
7. Nordlund K, Garret E: Rumenocentesis - a Technique for Collecting rumen fluid for the Diagnosis of subacute rumen acidosis in Dairy herds. The Bovine pract 1994, 28: 109-112. 8. Radostits O, Blodd D, Gay C: Acute carbohydrate engorgement of ruminants (rumen overload). Veterinary Medicine. Philadelphia, PA, 2005, 262-269. 9. Dirksen G. Rumen function and Disorders related to Production disease. In Proc. VII Int. Conf. Dis. Farm Anim.1989. 350-361. 10. Oetzel G: Clinical Aspects of ruminal acidosis in Dairy cattle. Proceedings of the 33RD Annual Convention of the America Association of Bovine Practitioner, Rapid City.2000, 46-53.
13