Hot and dense lattice QCD in the strong coupling limit Yusuke Nishida January 7, 2004 Abstract Quantum chromodynamics (QCD) with colors Nc and flavors Nf at finite temperature (T ), baryon chemical potential (µB ) and isospin chemical potential (µI ) is studied in the strong coupling limit on the lattice with staggered fermions. With the use of the large dimensional expansion and the mean field approximation, we derive an effective action written in terms of the chiral condensate and the diquark/pion condensate as a function of T , µB and µI . Firstly, we clarify the phase structure for Nc = 2, Nf = 4 with special emphasis on the interplay among the chiral condensate, the diquark condensate and the baryon density in the T -µB -m space. Simple analytical formulae are also derived without assuming µB nor m being small. Then the phase structure in the space of T and µB is elucidated for Nc ≥ 3 and Nf = 4, 8, and simple analytical formulae for critical line of chiral phase transition and tricritical point are derived. Effects of finite quark mass (m) and finite µI on the phase diagram are discussed. We also investigate the phase structure for Nc ≥ 3, Nf = 8 in the space of T , µI and m, and clarify a correspondence between the color SU(3) QCD with finite isospin density and the color SU(2) QCD with finite baryon density. Comparisons of our results to those from recent Monte-Carlo lattice simulations in finite density QCD are given.
Master Thesis Department of Physics, University of Tokyo
1
2
CONTENTS
Contents 1 Introduction
3
2 Formulation of strong coupling lattice QCD 2.1 Lattice action and its symmetry . . . . . . . . . . . . . . . . . . . . . . . . . . . . . . 2.2 Strong coupling limit and large dimensional expansion . . . . . . . . . . . . . . . . . . 2.3 Bosonization with the auxiliary fields . . . . . . . . . . . . . . . . . . . . . . . . . . .
5 5 6 7
3 QCD (Nc = 2, Nf = 4) with finite baryon density 3.1 Pauli-G¨ ursey symmetry . . . . . . . . . . . . . . 3.2 Derivation of an effective action . . . . . . . . . 3.3 Analytical results on the phase structure . . . . 3.4 Numerical results on the phase structure . . . .
. . . .
9 9 10 12 15
4 QCD (Nc ≥ 3, Nf = 4) with finite baryon density 4.1 Derivation of an effective action . . . . . . . . . . . . . . . . . . . . . . . . . . . . . . 4.2 Analytical properties in the chiral limit . . . . . . . . . . . . . . . . . . . . . . . . . . 4.3 The phase structure with finite quark mass . . . . . . . . . . . . . . . . . . . . . . . .
19 19 21 23
5 QCD (Nc ≥ 3, Nf = 8) with finite isospin density 5.1 Strong coupling lattice QCD with isospin chemical potential . . . . . . . . . . . . . . 5.2 The phase structure for µI < mπ . . . . . . . . . . . . . . . . . . . . . . . . . . . . . . 5.3 The phase structure for µB = 0 . . . . . . . . . . . . . . . . . . . . . . . . . . . . . . .
26 26 27 29
6 Summary and Discussion
33
A Summation over the Matsubara frequency A.1 Case 1 . . . . . . . . . . . . . . . . . . . . . . . . . . . . . . . . . . . . . . . . . . . . A.2 Case 2 . . . . . . . . . . . . . . . . . . . . . . . . . . . . . . . . . . . . . . . . . . . .
35 35 36
B Proof of σ = 0 at the global minimum of Feff [σ, ∆]|m=0
37
C SU(Nc ) integration in the Polyakov gauge
38
. . . .
. . . .
. . . .
. . . .
. . . .
. . . .
. . . .
. . . .
. . . .
. . . .
. . . .
. . . .
. . . .
. . . .
. . . .
. . . .
. . . .
. . . .
. . . .
. . . .
3
1
Introduction
To reveal the nature of matter under extreme conditions in Quantum Chromodynamics (QCD) is one of the most interesting and challenging problems in hadron physics. At present the Relativistic Heavy Ion Collider (RHIC) experiments at Brookhaven National Laboratory are running in order to create a new state of hot matter, the quark gluon plasma [1, 2]. On the other hand, there have been proposed various novel states of dense matter at low temperature which are relevant to the physics of neutron star interiors, such as the 3 P2 neutron superfluidity [3], the pion [4] and kaon [5] condensations and so on. Furthermore, if the baryon density reaches as much as the tenth of nuclear density at the core of the neutron stars, quark matter in color-superconducting state may be realized [6]. One of the first principle methods to solve QCD is the numerical simulation on the basis of the Monte-Carlo method. This has been successfully applied to study the chiral and deconfinement phase transitions at finite temperature (T 6= 0) with zero baryon chemical potential (µB = 0) [7]. On the other hand, the lattice QCD simulation has an intrinsic difficulty at finite µB due to the complex fermion determinant. Recently new approaches have been proposed to attack the problem in SUc (3) QCD at finite µB [8], such as the improved reweighting method [9], the Taylor expansion method around µB = 0 [10] and the analytical continuation from imaginary µB [11, 12]. They have indeed given us some idea about the phase structure of QCD, e.g. the existence of the critical endpoint of chiral phase transition and the determination of the slope on the critical line. They are, however, inevitably restricted either to the simulations on a small lattice volume or to the low µB region near the critical line. Alternative attempts have been also made to study theories with positive fermion determinant, which include color SUc (2) QCD with finite µB [13, 14] and color SUc (3) QCD with finite isospin chemical potential (µI ) [15, 16]. In this thesis we consider the strong coupling limit of SUc (2) [17, 18, 19] and SUc (3) lattice QCD [20, 21, 22, 23, 24, 25] and make an extensive study of its phase structure with the use of the effective potential analytically calculated at finite T , µB , µI and the quark mass m. The phases obtained as functions of these variables are not easily accessible in Monte-Carlo simulations and thus give us some insights into hot and dense QCD. Note that our approach has closer connection to QCD than other complementary approaches based on the Nambu−Jona-Lasinio model [26], the random matrix model [27] and the Schwinger-Dyson method [28, 29]. This thesis is organized as follows: Sec. 2 is devoted to the formulation of strong coupling lattice QCD. We explain how to derive an effective free energy starting from the lattice action in the strong coupling limit with one species of staggered fermion (corresponding to Nf = 4 flavors in the continuum limit) by the use of the large dimensional expansion. In Sec. 3, discussion on the Pauli-G¨ ursey symmetry of SUc (2) QCD is firstly given at Sec. 3.1. Then we derive an effective free energy Feff [σ, ∆] with Nc = 2 and Nf = 4 by introducing the auxiliary fields σ and ∆ corresponding to the chiral and diquark condensates and employing the mean field approximation (Sec. 3.2). The resultant free energy is enough simple so that one can make analytical studies in the chiral limit m = 0 with finite T and µB , and in the zero temperature limit T = 0 with finite µB and m. Sec. 3.3 is devoted to such studies and useful relations of the critical temperature and chemical potential are derived. In Sec. 3.4, we make numerical analyses on the chiral and diquark condensates as well as the quark number density as functions of T , µB , and m. The phase structure of SUc (2) QCD at strong coupling is clarified in the three dimensional T -µB -m space. In Sec. 4, we consider color SU(Nc ≥ 3) QCD with finite temperature and baryon density. Firstly, we derive an effective free energy in terms of a scalar mode σ and a pseudoscalar mode π for Nf = 4 (Sec. 4.1). The resultant free energy is simple enough so that one can make analytical studies at least in the chiral limit m = 0 with finite T and µB . Sec. 4.2 is devoted to such studies and useful formulae of the critical temperature and critical chemical potential for the chiral restoration are derived. Especially we can present an analytical expression for the temperature and baryon chemical potential of the tricritical point. In Sec. 4.3, we analyze the chiral condensate and baryon density as functions of µB
4
1
INTRODUCTION
and show the phase diagram in the plane of T and µB for Nc = 3, Nf = 4. We discuss the effect of finite quark mass m on the phase diagram of QCD and comparison to the results from recent lattice simulations are given here. In Sec. 5, we consider the strong coupling lattice QCD with isospin chemical potential as well as T and µB . In order to include µI , we extend the formulation studied in Sec. 2 to with two species of staggered fermion, which corresponds to Nf = 8 flavor QCD in the continuum limit (Sec. 5.1). Then we restrict ourselves to two particular cases: One is at finite T , finite µB and small µI (Sec. 5.2). The other is at finite T , finite µI and zero µB (Sec. 5.3). For each case, we derive and analyze an analytical expression for the effective free energy and show the phase diagram in terms of T and µB or µI for Nc = 3, Nf = 8. In Sec. 5.2, we discuss the effect of increasing Nf and that of finite µI on the phase diagram of QCD in T -µB plane. In Sec. 5.3, comparison to the results from lattice simulations and discussion on a correspondence between QCD with finite µI and SUc (2) QCD with finite µB are given. Summary and discussion are given in Sec. 6. In Appendices A, B and C, we give some technical details in deriving the effective free energy. Note that Sec. 3 in this thesis is based on a recent paper by the author [30] and Sec. 4, 5 on [31].
5
2
Formulation of strong coupling lattice QCD
2.1
Lattice action and its symmetry
The action on the lattice in the staggered formalism [32] is given by S[U, χ, χ] ¯ = SG [U ] + SF [U, χ, χ] ¯ , which consists of the gluonic part, ¾ ½ 2Nc X 1 SG [U ] = 2 ReTr Uµν (x) , 1− g x,µ,ν Nc
(1)
Uµν (x) = Uν† (x)Uµ† (x + νˆ)Uν (x + µ ˆ)Uµ (x) ,
and the fermionic part with finite chemical potential, n o X 1X µ SF [U, χ, χ] ¯ =m χ(x)χ(x) ¯ + η0 (x) χ(x)e ¯ U0 (x)χ(x + ˆ0) − χ(x ¯ + ˆ0)e−µ U0† (x)χ(x) 2 x x d n o 1 XX ˆ + ηj (x) χ(x)U ¯ ¯ + ˆj)Uj† (x)χ(x) . j (x)χ(x + j) − χ(x 2 x
(2)
(3)
j=1
χ stands for the quark field in the fundamental representation of the color SU(Nc ) group and Uµ is the SU(Nc ) valued gauge link variable. g is the gauge coupling constant and d represents the number of spatial directions which takes 3 in reality. Later we sometimes use a notation x = (τ, ~x) in which τ (~x) represents the temporal (spatial) coordinate. η0 (x) and ηj (x) inherent in the staggered formalism are defined as η0 (x) = 1 ,
Pj
ηj (x) = (−1)
i=1
xi−1
.
(4)
µ is the quark chemical potential, while the temperature is defined by T = (aNτ )−1 with a being the lattice spacing and Nτ being the number of temporal sites. We will write all the dimensionful quantities in unit of a and will not write a explicitly. The lattice action with single component staggered fermion has U(1)V × U(1)A symmetry in the chiral limit m = 0, which is a remnant of the 4 flavor chiral symmetry in the continuum theory, defined by U(1)V : χ(x) 7→ eiθV χ(x) ,
−iθV χ(x) ¯ 7→ χ(x)e ¯
(5)
and U(1)A : χ(x) 7→ eiε(x)θA χ(x) ,
iε(x)θA χ(x) ¯ 7→ χ(x)e ¯ .
(6)
xν
(7)
Here ε(x) is defined by Pd
ε(x) = (−1)
ν=0
,
which plays the similar role to that of γ5 in the continuum theory. U(1)A will be explicitly broken by the introduction of finite quark mass or spontaneously broken by condensation of hχχi. ¯ Note that staggered fermion’s U(1)A symmetry should not be confused with the axial U(1) symmetry in the continuum theory which is broken by the quantum effect. For Nc = 2, the action has a larger symmetry U(2) at m = µ = 0 because the color SU(2) group is pseudo-real and the action possesses Pauli-G¨ ursey’s fermion−anti-fermion symmetry [33]. This special property for Nc = 2 will be revisited in the next section 3. The main purpose of this section is to explain how to derive the effective free energy from the original action Eq. (1) systematically by accomplishing the path integrals with adopting strong coupling limit, large dimensional expansion and mean field approximation. Before addressing the computational details, we shall summarize the actual procedure:
6
2
FORMULATION OF STRONG COUPLING LATTICE QCD
1. Strong coupling limit g → ∞ is taken. Then the gluonic part of the action SG [U ] in Eq. (2) vanishes, because it is inversely proportional to g 2 . Consequently the gauge field remains only in the fermionic part (3). 2. Large dimensional (1/d) expansion is employed in the spatial directions in order to facilitate the integration over the spatial gauge link variable Uj . 3. Bosonization is performed by introducing the auxiliary fields. Then the mean field approximation is adopted for the auxiliary fields so that they are regarded as spatially uniform condensates. 4. Integration with respect to χ, χ ¯ and U0 are accomplished exactly to result in an effective free energy written in terms of the mean field values.
2.2
Strong coupling limit and large dimensional expansion
First of all, we take the strong coupling limit g → ∞ and employ the large dimensional expansion in order to perform the integration over the spatial gauge link variable Uj . Taking the strong coupling limit, the partition function in the strong coupling limit is written as Z ¯ (8) Z = D[χ, χ] ¯ D[U0 ] D[Uj ] e−SF [U,χ,χ] . ¯ Because χ and χ ¯ are fermion fields, the Taylor expansion of e−SF [U,χ,χ] generates at most 22Nc terms on each site x. Thus the integration with respect to the link variable could be performed exactly in principle. Instead, we truncate such an expansion here up to the leading order in the 1/d expansion. As explained soon below, the lowest order of the Taylor expansion gives the leading contribution in the 1/d expansion. By using the formulae for the SU(Nc ) group integration Z Z Z 1 1 † d[U ] = 1 , d[U ] Uab Ucd = ²a ···a ²b ···b , (9) δad δbc , d[U ] Ua1 b1 · · · UaNc bNc = Nc N c ! 1 Nc 1 N c ¯ we can integrate e−SF [U,χ,χ] with respect to Uj as follows; d Z YY x j=1
· n o¸ 1 † ˆ ˆ d[Uj (x)] exp − ηj (x) χ(x)U ¯ ¯ + j)Uj (x)χ(x) j (x)χ(x + j) − χ(x 2
=
Y x
d X 1 + Nc M (x)M (x + ˆj) 4 j=1
− (−1) " = exp
Nc(Nc+1) 2
d µ X 1 j=1
X
2
¶N c n o ¯ + ˆj)B(x) + · · · ¯ ηj (x) B(x)B(x + ˆj) + (−1)Nc B(x
M (x)VM (x, y)M (y) +
x,y
X
(10)
# ¯ B(x)V B (x, y)B(y) + · · · ,
x,y
¯ where M (x) and B(x), B(x) are the mesonic and baryonic composites defined respectively as 1 δab χ ¯a (x)χb (x) , Nc 1 B(x) = ²a ···a χa1 (x) · · · χaNc (x) , N c ! 1 Nc
M (x) =
1 ¯ B(x) =− ²b ···b χ ¯b1 (x)χ ¯bNc (x) , N c ! 1 Nc
(11)
2.3
Bosonization with the auxiliary fields
7
and their propagators in the spatial directions are given by d ´ Nc X ³ VM (x, y) = δy,x+ˆj + δy,x−ˆj , 4 j=1
d h i (−1)Nc (Nc +1)/2 X Nc Nc [η (x)] δ + (−1) δ VB (x, y) = − j ˆ ˆ y,x+j y,x−j . 2Nc
(12)
j=1
The Latin indices a, b, . . . are summed over from 1 to Nc in the color space. ¯ The reason why the lowest order terms of the Taylor expansion of e−SF [U,χ,χ] correspond to the leading contributions of the 1/d expansion can be understood by changing the normalization of quark √ ˜ ˜ field as M (x) → M (x)/ d so that the mesonic propagator VM (x, y) = VM (x, y)/d becomes O(1) in the large d limit. As a result , because the higher order terms in the Taylor expansion contain more quark fields χ and χ, ¯ they are associated with more 1/d1/4 and then vanish in the large d limit. To clarify the argument, we consider the baryonic term in Eq. (10). Changing the normalization of quark fields χ, χ ¯ to the one suitable for 1/d expansion, the baryonic term becomes ¯ B(x)V B (x, y)B(y) →
1 dNc /2−1
˜¯ V˜ (x, y)B(y) ˜ B(x) , B
(13)
where V˜B (x, y) = VB (x, y)/d. Therefore the baryonic term turns out to be of higher in the 1/d expansion as long as Nc ≥ 3 because V˜B (x, y) is O(1) in the large d limit. For Nc = 2, however, the baryonic term contributes to the same order as the mesonic one and it can never be neglected in terms of large dimensional expansion. The resultant action (10) describes the nearest neighbor interactions ¯ of the mesonic composite M (x) and of the baryonic composites B(x) and B(x).
2.3
Bosonization with the auxiliary fields
In order to accomplish the remaining integrations over χ, χ ¯ and U0 , we perform the bosonization and mean field approximation. The mesonic term in Eq. (10) is the four fermion interaction, we may linearize it by introducing the auxiliary field σ(x) (chiral field) with a standard Gaussian technique; " # Z " # X X exp M (x)VM (x, y)M (y) = D[σ] exp − {σ(x)VM (x, y)σ(y) + 2σ(x)VM (x, y)M (y)} . x,y
x,y
(14) For Nc = 2 case, the baryonic term is also four fermion interaction and can be linearized by introducing the boson fields ∆(x) and ∆∗ (x) (diquark fields) as " # X ¯ exp B(x)V B (x, y)B(y) x,y
Z =
" D[∆, ∆∗ ] exp −
X©
# ª ¯ ∆∗ (x)VB (x, y)∆(y) − ∆∗ (x)VB (x, y)B(y) − B(x)V . B (x, y)∆(y)
x,y
(15) From the above transformations, it is easy to show the relation hσ(x)i = − hM (x)i ,
h∆(x)i = hB(x)i ,
® ¯ h∆∗ (x)i = B(x) ,
(16)
where we have chosen the definition of the field σ(x) so that the sign of hσ(x)i becomes positive for m > 0. Consequently, we obtain the following partition function in the leading order of strong coupling
8
2
FORMULATION OF STRONG COUPLING LATTICE QCD
and large dimensions; Z 0
¯ D[χ, χ] ¯ D[U0 ] D[σ] D[∆, ∆∗ ] e−S [U0 ,χ,χ,σ,∆] ,
Z=
(17)
where S 0 [U, χ, χ, ¯ σ, ∆] = m
X
χ(x)χ(x) ¯ +
x
+
X
n o 1X µ η0 (x) χ(x)e ¯ U0 (x)χ(x + ˆ0) − χ(x ¯ + ˆ0)e−µ U0† (x)χ(x) 2 x
{σ(x)VM (x, y)σ(y) + 2σ(x)VM (x, y)M (y)}
x,y
+ δNc ,2
X©
ª ¯ ∆∗ (x)VB (x, y)∆(y) − ∆∗ (x)VB (x, y)B(y) − B(x)V B (x, y)∆(y) .
x,y
(18) Demanding the invariance of the above action under the U(1)V or U(1)A transformation defined respectively by (5) and (6), we can assign the transformation for the chiral field as U(1)V :
σ(x) 7→ σ(x)
and
U(1)A :
σ(x) 7→ e2iε(x)θA σ(x) .
(19)
Then the finite vacuum expectation value of σ(x) means the spontaneous breakdown of chiral symmetry UA (1). In the same way, we can determine the transformation for the diquark fields for Nc = 2 as U(1)V :
∆(x) 7→ e2iθV ∆(x)
and
∆∗ (x) 7→ e−2iθV ∆∗ (x) ,
(20)
U(1)A :
∆(x) 7→ e2iε(x)θA ∆(x)
and
∆∗ (x) 7→ e2iε(x)θA ∆∗ (x) .
(21)
Then the finite vacuum expectation value of |∆(x)| means the spontaneous breakdown of the chiral symmetry and the baryon number conservation UV (1), which leads to the diquark superfluidity. What we have to do next to derive the effective free energy written by the above vacuum expectation values is a mean field approximation. Namely, we replace the auxiliary fields σ(x) and ∆(x) by the constant mean field values and ignore any fluctuations around them. Then since S 0 [U0 , χ, χ; ¯ σ, ∆] becomes in a bilinear form with respect to the quark fields χ and χ, ¯ we can integrate out them immediately. The integration with respect to U0 , which seems to be tough at first glance, turns out to be feasible. The actual procedures of the mean field approximation and the integration over χ, χ ¯ and U0 will be demonstrated for Nc = 2 case and Nc ≥ 3 case separately in the succeeding sections.
9
3
QCD (Nc = 2, Nf = 4) with finite baryon density
In this section, we consider the case of Nc = 2, which is called 2-color QCD in this section. One of the major differences between 2-color QCD and SUc (3) QCD lies in the fact that the color-singlet baryons are bosons in the former. This implies that the ground state of the 2-color system at finite baryon density in the color-confined phase is an interacting boson system, i.e. a Bose liquid, although the quark Fermi liquid may be realized at high baryon density in the color-deconfined phase. How this Bose liquid changes its character as a function of the temperature T , the quark chemical potential µB and the quark mass m is an interesting question by itself and may also give a hint to understand physics of the color superconductivity in 3-color QCD in which the crossover from the Bose-Einstein condensate of tightly bound quark pairs to the BCS type condensate of loosely bound Cooper pairs may take place [34].
3.1
Pauli-G¨ ursey symmetry
Before to address the derivation of an effective free energy, here we shall consider the symmetry of 2-color QCD and its breaking pattern. As we have already mentioned in Sec. 2.1, the lattice action (3) has U (2) symmetry at m = µ = 0 for Nc = 2. In order to see this symmetry explicitly, we rearrange Eq. (3) by using the Grassmann nature of χ, χ, ¯ the fact that ηµ (x) = ηµ (x ± µ ˆ) and the property τ2 Uµ τ2 = Uµ∗ where τ2 is a Pauli matrix. Then we rewrite the action in the chiral limit m = 0 as follows [13]; ¸ ¶ ¶ µ −µ · µ µ 1 X e 0 e 0 † ¯ + ˆ0) ¯ − ˆ0) U0 (x)Ψ(x) U0 (x − ˆ0)Ψ(x) − Ψ(x SF [U, χ, χ] ¯ = η0 (x) Ψ(x 0 eµ 0 e−µ 2 x:even d h i 1 X X ¯ − ˆj)Uj (x − ˆj)Ψ(x) − Ψ(x ¯ + ˆj)U † (x)Ψ(x) , ηj (x) Ψ(x + j 2 x:even
(22)
j=1
where ¡
¢ ¯ : odd) = χ(x), Ψ(x ¯ −τ2 χ (x) t
µ and
Ψ(x : even) =
¶ χ(x) . −τ2 χ ¯t (x)
(23)
The summation is only over even sites defined by where ε(x) = 1 and the field Ψ(x) is defined only on ¯ even sites and Ψ(x) on odd sites (ε(x) = −1). As we can see manifestly, the action at zero chemical potential µ = 0 has a global U (2) symmetry defined by Ψ(x) 7→ W Ψ(x)
and
† ¯ ¯ Ψ(x) 7→ Ψ(x)W ,
with W ∈ U(2) .
(24)
This larger symmetry is a special feature for 2-color QCD and sometimes called as Pauli-G¨ ursey symmetry which mixes fermions with anti-fermions. This is nothing but the consequence of the pseudo-reality of the color SU(2) group τ2 Uµ τ2 = Uµ∗ . Introduction of finite chemical potential reduces the U(2) symmetry to the usual UV (1) × UA (1) symmetry defined by Eqs. (5) and (6) and finite quark mass breaks it to the UV (1) symmetry. As explained in Sec. 2.3, the formation of the diquark condensation hχχi spontaneously breaks the UV (1) and UA (1) symmetry and lead to baryon superfluidity. The symmetries realized in various circumstances and their breaking patterns by the diquark condensation are summarized in Table 1. In the succeeding subsections, we derive the effective action in terms of the chiral and diquark fields and analyze the phase structure of 2-color QCD as functions of temperature, chemical potential and quark mass.
10
3 QCD (NC = 2, NF = 4) WITH FINITE BARYON DENSITY
µ=0 µ 6= 0
m=0 U(2) broken to U(1) with 3 NG modes UV (1) × UA (1) totally broken with 2 NG modes
m 6= 0 UV (1) not broken UV (1) totally broken with 1 NG mode
Table 1: Symmetry realized in the lattice action for Nc = 2 with one species of staggered fermion. Possible symmetry breaking patterns by the diquark condensation and the number of Nambu-Goldstone (NG) modes are also listed.
3.2
Derivation of an effective action
3.2.1
Mean field approximation
We start from the action in Eq.(18) which is obtained after the strong coupling limit, 1/d expansion and bosonization. We replace the auxiliary fields σ(x) and ∆(x) in Eq.(18) by the constant mean field values σ and ∆ and ignore any fluctuations around them. It is obvious from Eq. (16) that σ should be identified with the chiral condensate and ∆ be the diquark condensate: σ = − hM (x)i ,
∆ = hB(x)i ,
® ¯ . ∆∗ = B(x)
(25)
Then we can write the partition function as Z 0 ¯ Z = D[U0 ] D[χ, χ] ¯ e−S [U0 ,χ,χ;σ,∆] ,
(26)
with o X· 1n µ S [U0 , χ, χ; ¯ σ, ∆] = mχ(x)χ(x) ¯ + χ(x)e ¯ U0 (x)χ(x + ˆ0) − χ(x ¯ + ˆ0)e−µ U0† (x)χ(x) 2 x ¸ d ∗ d ¯ d 2 d 2 + σ + |∆| + d σM (x) − ∆ B(x) − ∆B(x) . 2 2 2 2 0
(27)
Since S 0 [U0 , χ, χ; ¯ σ, ∆] is in a bilinear form with respect to the quark fields χ and χ, ¯ we can integrate out them immediately. Then the integration with respect to U0 also can be performed as shown below. 3.2.2
Integrations over χ, χ ¯ and U0
In order to complete the remaining integrals, we adopt a particular gauge in which U0 (τ, ~x) is diagonal and independent of τ (often called the Polyakov gauge), ³ ´ U0 (τ, ~x) = diag eiφ1 (~x)/Nτ , eiφ2 (~x)/Nτ ,
with φ1 (~x) = −φ2 (~x) .
(28)
Also we make a partial Fourier transformation for the quark fields; Nτ 1 X eikn τ χ(n, ˜ ~x) , χ(τ, ~x) = √ Nτ n=1
Nτ 1 X ˜¯ ~x) , χ(τ, ¯ ~x) = √ e−ikn τ χ(n, Nτ n=1
kn = 2π
(n − 21 ) . Nτ
(29)
The anti-periodic condition in the temporal direction , χ(τ + Nτ , ~x) = −χ(τ, ~x), is satisfied owing to the fermionic Matsubara frequency kn .
3.2
Derivation of an effective action
11
Substituting Eqs. (28) and (29) into the action (27) and taking the summation over τ , we reach the action in a Nambu-Gor’kov representation; ¶ X µd d 2 1 XX a 0 2 S [φ, χ, χ; ¯ σ, ∆] = σ + |∆| − [X (m, ~x)]t G−1 x)) X b (n, ~x) , (30) ab (m, n; φ(~ 2 2 2 m,n x ~ x
where
µ X a (n, ~x) =
¶ χ ˜a (n, ~x) ˜¯a (n, ~x) , χ
(31)
and G−1 x)) ab (m, n; φ(~
d ∗ ∆ δm,Nτ −n+1 ²ab 2µ · ¶¸ = φa (~x) − M + i sin km + − iµ δmn δab Nτ
(32) · µ ¶¸ φa (~x) M + i sin km + − iµ δmn δab Nτ . d − ∆ δm,Nτ −n+1 ²ab 2
The indices a and b run from 1 through 2 in the color space. M denotes the dynamical quark mass (to be distinguished from the mesonic composite M (x)) defined by d M = m+ σ. 2 We can perform the Grassmann integration over χ and χ ¯ as [35] Z q Y £ ¤ t −1 D[χ, χ] ¯ eX G X = Det G−1 x)) . ab (m, n; φ(~
(33)
(34)
~ x
Det stands for the determinant with respect to the color indices and the Matsubara frequencies. The square root of the determinant may be simplified as " # N τ µ ¶2 Y p d Det[G−1 ] = |∆|2 + {M + i sin (kn + φ/Nτ − iµ)} · {M − i sin (kn + φ/Nτ + iµ)} , 2 n=1
(35) where φ1 = −φ2 = φ is substituted. The product with respect to n can be performed using a technique similar to that in the calculation of the free energy in finite-temperature field theory in the continuum. The details of the calculation is given in Appendix A.1. The result turns out to be a rather simple form, q £ ¤ Det G−1 (m, n; φ) = (2 cos φ + 2 cosh Nτ E− ) · (2 cos φ + 2 cosh Nτ E+ ) . (36) ab Here E± are the excitation energy of quasi-quarks and anti-quasi-quarks, µq ¶ 2 2 2 2 E± = arccosh (1 + M ) cosh (µB /2) + (d/2) |∆| ± M sinh (µB /2) .
(37)
with the dynamical quark mass M defined in Eq. (33) We have defined the baryon chemical potential µB as µB = 2µ. Finally, all we have to do is to integrate this resultant determinant with respect to U0 , or φ, to derive the effective action; ½Z ¾ ¶ X q X µd £ −1 ¤ dφ(~x) d 2 2 2 Seff [σ, ∆] = − log Z = log σ + |∆| − sin φ(~x) Det Gab (m, n; φ(~x)) , 2 2 2π x ~ x
(38)
12
3 QCD (NC = 2, NF = 4) WITH FINITE BARYON DENSITY
where we have used the SU(2) Haar measure in the Polyakov gauge (28), ¯ Z ¯ Y Z π dφ(~x) ¯ 2 D[U0 ] = sin φ(~x)¯ ¯ 2π −π ~ x
.
(39)
φ(~ x)=φ1 (~ x)=−φ2 (~ x)
The U0 integration projects out the color singlet pairing of quarks and anti-quarks among arbitrary excitations in the determinant. Thus what excites thermally is no longer single quarks, but color singlet mesons or diquarks. In this sense, the strong coupling limit in 2-color QCD inevitably leads to the confined boson system. Then Eqs. (36), (38) and (39) immediately yield the effective free energy; P d d Feff [σ, ∆] = Seff /( x ) = σ 2 + |∆|2 − T log {1 + 4 cosh (E+ /T ) · cosh (E− /T )} , 2 2
(40)
where we have rewritten Nτ in terms of the temperature T (= 1/Nτ ). Although the quasi-quark energy E± given in Eq. (37) takes a complicated form, E± is reduced to a simple expression in the naive continuum a → 0 with a being the lattice spacing. Assuming M a, ∆a, µa ¿ 1 in this limit, E± amounts to a familiar form in the continuous space-time, ¶ µq p 2 2 2 2 1 + M + (µB /2) + (d/2) |∆| ± M µB /2 → (M ± µB /2)2 + (d/2)2 |∆|2 . (41) E± ∼ arccosh The quasi-quarks are static in this framework because of the mean field approximation.
3.3 3.3.1
Analytical results on the phase structure Case in the chiral limit
In the chiral limit m = 0 with zero chemical potential µB = 0, the free energy in the mean field approximation given in Eq. (40) is a function only in terms of σ 2 + |∆|2 . As a result, the free energy is invariant under the transformation mixing the chiral condensate with the diquark one. This corresponds to a subgroup of the U(2) symmetry of the original action at m = µB = 0 in Table 1. Because of this symmetry, the chiral condensate is indistinguishable from the diquark condensate for m = µB = 0, so that a state with finite σ can be arbitrarily transformed to a state with finite ∆. Finite µB would act on the free energy as an external field tending to make the diquark condensation favored. Consequently even an infinitesimal introduction of µB leads to the diquark condensation phase with zero chiral condensate in the chiral limit. This is a peculiar feature of 2-color QCD and is in a sharp contrast to the 3-color QCD. In fact, we can prove that the minimizing condition for our Feff [σ, ∆] does not allow non-zero σ at any T and µB in the chiral limit. See Appendix B for the proof. Taking the fact that σ vanishes in the chiral limit for granted, the free energy is simply written as µq ¶ © ª d 2 2 2 2 2 E0 = arccosh (d/2) |∆| + cosh (µB /2) . Feff [∆] = |∆| − T log 1 + 4 cosh (E0 /T ) , 2 (42) Assuming that the finite temperature phase transition with fixed µB is of second order, which will be confirmed numerically later, the critical temperature Tc may be determined by expanding Feff [∆] in terms of |∆|2 and extracting the point where the coefficient of |∆|2 changes its sign. Since the expansion reads ½ ¾ ¡ ¢ d sinh (µB /T ) d2 Feff [∆] = −T log {3 + 2 cosh (µB /T )} + |∆|2 + O |∆|4 , − 2 3 + 2 cosh (µB /T ) sinh µB (43)
3.3
Analytical results on the phase structure
13
one finds ( Tc (µ) = µB
Ã
arccosh
!)−1 p 3 sinh2 µB + d 4d2 + 5 sinh2 µB . 2d2 − 2 sinh2 µB
(44)
The values of Tc (µB ) for two typical cases are Tc (µB = 0) =
6 , 5
Tc (µB = µcri B = arcsinh d ' 1.82) = 0
(45)
for d = 3. Tc is a monotonously decreasing function of µB connecting the above two points. This will be discussed later in Sec. 3.4 together with the case at finite m. It is interesting to calculate the baryon density ρB which is defined as ρB (µB , T ) = −
8 cosh (E0 /T ) sinh (E0 /T ) ∂E0 ∂Feff = · , ∂µB ∂µB 1 + 4 cosh2 (E0 /T )
(46)
where E0 is the quasi-quark mass in the chiral limit defined in Eq. (42). Although the above expression seems to be a little complicated, it can be simplified by using the gap equation; 0=
∂Feff d 8 cosh (E0 /T ) sinh (E0 /T ) (d/2)2 ∆ ∂E0 = ∆ − · ·2 . 2 ∗ ∂∆ 2 sinh µB ∂µB 1 + 4 cosh (E0 /T )
(47)
In general the gap equation may have two solutions, ∆ = 0 and ∆ 6= 0. The former (the latter) is the solution to minimize the free energy for T ≥ Tc (µ) (T < Tc (µ)). It can be alternatively said that the cri former (the latter) is the solution for µB ≥ µcri B (T ) (µB ≤ µB (T )) with the critical chemical potential µcri B as a solution of Eq. (44) in terms of µ. By eliminating most of the complicated part of Eq. (46) by means of the gap equation (47), we have the following expressions; for µB < µcri (sinh µB ) /d B (T ) (∆ 6= 0) , ρB (µB , T ) = (48) 2 sinh (µB /T ) for µB ≥ µcri B (T ) (∆ = 0) . 3 + 2 cosh (µB /T ) At zero temperature, Eq. (48) is reduced to ( (sinh µB ) /d ρB (µB , T = 0) = 1
for µB < µcri B (T = 0) , cri for µB ≥ µB (T = 0)
(49)
with µcri B (T = 0) = arcsinh d,
(50)
at which the baryon density ρB gets to be saturated to one. Note that quarks on each lattice site have only two degrees of freedom in the color space because the spin and flavor degrees of freedom are dispersed on the staggered lattice sites. Therefore “one” is the maximum number of baryon placed on each lattice site due to the Pauli exclusion principle of constituent quarks. 3.3.2
Case at zero temperature with finite m
Even a small quark mass could modify the phase structure substantially from that given above for chiral limit. This is because the pion, that is the Nambu-Goldstone mode associated with the chiral UA (1) symmetry breaking, comes to have a finite mass, mπ ∝ m1/2 . As a result, as far as the baryon
14
3 QCD (NC = 2, NF = 4) WITH FINITE BARYON DENSITY
chemical potential is smaller than a threshold value, the vacuum is empty and the diquark condensate vanishes; ρB (µB , T = 0) = 0 and ∆(µB , T = 0) = 0. To clarify such threshold effects in more detail, let us now focus our attention on the T = 0 system with finite m. We derive analytical formulae for lower-critical chemical potential µlow at which c up ∆ starts to be non-vanishing and the upper-critical chemical potential µc at which ∆ ceases to be non-vanishing. The free energy at T = 0 with finite m takes a simple form; Feff [σ, ∆] =
d 2 d 2 σ + |∆| − (E+ + E− ) . 2 2
(51)
The expansion of Feff [σ, ∆] in terms of |∆|2 near the threshold gives a condition to determine the critical chemical potential µcri B , µ ¶ d d2 1 1 − + = 0, (52) 2 8 cosh E cosh(µcri sinh(E + µcri | sinh(E − µcri B /2) B /2) B /2)| √ where E = arccosh( 1 + M 2 ) and M = m + dσ/2 as defined in Eq. (33). In Eq. (52) the dynamical mass M , or σ, is determined by the condition to minimize the free energy at the threshold. We can reduce that free energy much more by putting ∆ = 0, Feff [σ] =
d 2 σ − (E + µB /2 + |E − µB /2|) . 2
(53)
The stationary condition of the free energy Feff [σ] with respect to σ yields the following chiral gap equations; ( (1 + M 2 )−1/2 for µB < 2E , 2 (M − m) = (54) 0 for µB ≥ 2E . d Combining Eq. (52) and Eq. (54), we find ( low √ µ = 2 arccosh 1 + mM c p µcri B = up µc = 2 arccosh 1 + K 2
for µB < 2E , for µB ≥ 2E ,
where we define K as the solution of the equation, µ ¶ 2 m2 K− = (1 + K 2 )−1/2 . d K
(55)
(56)
With finite m at T = 0, the empty vacuum gives ρB = 0 and ∆ = 0 as long as µB < µlow c . low up On the other hand, the non-vanishing value of ∆ is possible for µc ≤ µB ≤ µc . For µB > µup c , the saturation of the baryon density occurs leading to ρB = 1 and ∆ = 0. These behaviors will be confirmed numerically in Sec. 3.4. Note that we have not assumed the quark mass m to be small, which is in contrast to the approaches based on chiral perturbation theory [36, 37]. Therefore, Eq. (55) can relate the critical chemical potentials to arbitrary values of m. For sufficiently small m, we have a relation; )1/4 ( (1 + d2 )1/2 − 1 low 1/2 , µup µc = 2 m · (57) c = arcsinh d . 2 The former may be rewritten as µlow = mπ with mπ obtained from the excitation spectrum in the c vacuum [38] up to the leading order of the 1/d expansion. This observation is consistent with the
3.4
Numerical results on the phase structure
1
15
1
T=0
∆
∆ 0.5
σ
0 0
0.5
1
T = 0.7
2
ρB ∆
Condensates and Density
Condensates and Density
0.5
1
µ B = 0.4
ρB
ρB 0.5
1
1
µ B = 1.0
0.5
1
1.5
∆
σ
0 0
σ
0 0
2
0 0
Baryon Chemical Potential µ B
ρB σ 0.5
1
1.5
Temperature T
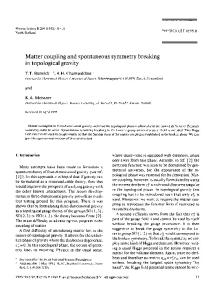
Figure 1: Chiral condensate σ, diquark condensate ∆, and the baryon density ρB for m = 0 with d = 3. In the left panels they are plotted as functions of the chemical potential µB for two typical values of temperature. In the right panels, they are plotted as functions of temperature T for two typical values of µB . All the dimensionful quantities are in unit of the lattice spacing a, which is implicitly understood in all the figures in this section.
discussion given in [36]. The latter relation is simply rewritten as µup c = µc (T = 0) with µc (T = 0) defined in Eq.(50). For sufficiently large m, we find asymptotically, µlow ' µup c c ' 2 arccosh m .
(58)
This is because M ' K ' m for large m as is evident from Eqs. (54) and (56).
3.4
Numerical results on the phase structure
In this section, we determine the chiral condensate σ and the diquark condensate ∆ numerically by minimizing the effective free energy in Eq. (40). The baryon density ρB is also calculated numerically. The results are shown in Figs. 1 and 2 for m = 0 and m = 0.02, respectively. The phase diagrams of the system in the T -µB plane, in the µB -m plane and in the three dimensional T -µB -m space are also shown in Figs. 3, 4 and 5, respectively. 3.4.1
Case for m = 0
Let us first consider the diquark condensate and the baryon density as functions of µB and T shown in the four panels of Fig. 1. (Note that the chiral condensate is always zero in the chiral limit as we have proved in Appendix B.)
16
3 QCD (NC = 2, NF = 4) WITH FINITE BARYON DENSITY
1
1
T=0
∆
0.5
σ
0 0
1
T = 0.7
2
ρB
σ 0.5
Condensates and Density
Condensates and Density
0.5
1
µ B = 0.4
ρB
∆
ρB 0 0
0.5
σ
1
1
1.5
µ B = 1.0
∆ 0.5
ρB
∆
σ 0 0
1
Baryon Chemical Potential µ B
2
0 0
0.5
1
1.5
Temperature T
Figure 2: Chiral condensate σ, diquark condensate ∆, and baryon density ρB for m = 0.02 with d = 3. All the definitions are the same p with those of Fig. 1 except that the dotted line indicates a total magnitude of the condensates σ 2 + ∆2 .
At T = 0 (the upper left panel), the diquark condensate ∆ decreases monotonously as a function of µB and shows a second order transition when µB becomes of order unity. On the other hand, the baryon density ρB increases linearly for small µB and grows more rapidly for large µB until the saturation point where quarks occupy the maximally allowed configurations by the Fermi statistics. (See the analytical formula given in Eq. (49).) Those behaviors of ∆ and ρB are also observed in the recent Monte-Carlo simulations of 2-color QCD [14]. Note that the rapid increase of ρB near the upper-critical chemical potential µup c takes place even in the strong coupling limit as shown here. Namely it does not necessarily be an indication of the existence of free quarks at high density unlike the suggestion given in the last reference in [14]. As T increases, the magnitude of the diquark condensate decreases by the thermal excitations of quark and anti-quark pairs in the last term of Eq. (40), which is shown in the lower left panel of Fig. 1. It is worth mentioning here that the diquark condensate disappears even before the complete saturation (ρB = 1) takes place. Next we consider the diquark condensate as a functions of T for two typical values of the chemical potential in the right panels of Fig. 1. The diquark condensate shows a second order transition at Tc given analytically by Eq. (44). 3.4.2
Case for m 6= 0
In the upper left panel of Fig. 2, the chiral condensate, the diquark condensate and the baryon density are shown as functions of µB for small quark mass m = 0.02 at T = 0. As we have discussed in Sec. 3.3.2, there exists a lower-critical chemical potential µlow given by Eq. (55). Both ∆ and ρB c
3.4
Numerical results on the phase structure
17
start to take finite values only for µB > µlow at T = 0. c One can view the behavior of chiral and diquark condensates with finite quark mass as the manifestation of two different mechanisms: One is a continuous √ “rotation” from the chiral direction to the low diquark direction near µB = µc or T = Tc (µB ) with σ 2 + ∆2 (shown by the dotted line) varying smoothly. The other is the saturation effect which forces the diquark condensate to decrease and disappear for large µB as seen in the previous case of m = 0. The “rotation” can be understood as follows: The free energy in the mean field approximation at small m and µB has an approximate symmetry which mixes the chiral condensate with the diquark one as we have discussed in Sec. 3.3.1. The effect of m (µB ) is to break this symmetry in the direction of the chiral (diquark) condensation favored. Therefore, a relatively large chiral condensate predominantly appears for small µB region. (Note that the chiral symmetry is explicitly broken by m, thus the chiral condensate is always non-vanishing although it is suppressed in magnitude at high T and µB .) Just above the lower-critical chemical potential µlow c , the chiral condensate decreases while the diquark condensate increases because the effect of µB surpasses that of m. As µB becomes large, the diquark condensate begins to decrease in turn by the effect of the saturation and eventually disappears when µB exceeds the upper-critical value µup c (order of unity for T = 0). Similar “rotation” and the saturation effect are also seen at finite T as shown in the lower left panel of Fig. 2. At finite T , both the chiral and diquark condensates are suppressed due to the effect of temperature and the diquark condensate disappears before the complete saturation occurs. Next we consider the chiral and diquark condensates as functions of T (the right panels of Fig. 2). At low T , both the chiral and diquark condensates have finite values for µB = 0.4 and 1.0. The diquark condensate decreases monotonously as T increases and shows a second order transition. On the other hand, p the chiral condensate increases as the diquark condensate decreases so that the total condensate σ 2 + ∆2 is a smoothly varying function of T . The understanding based on the chiraldiquark mixing symmetry is thus valid. An interesting observation is that the chiral condensate, although it is a continuous function of T , has a cusp shape associated with the phase transition of the diquark condensate. Finally let us compare the m = 0 case in Fig. 1 and the m = 0.02 case in Fig. 2. Looking into two figures at the same temperature p or chemical potential, we find that the diquark condensate ∆ for m = 0 and the total condensate σ 2 + ∆2 for m = 0.02 have almost the same behavior. This indicates that although the current quark mass suppresses the diquark condensate, the price to pay is to increase the chiral condensate so as to make the total condensate insensitive to the presence of small quark mass. Restating this by use of the radial and the angle variables defined by λ sin φ = σ and λ cos φ = |∆| as in Eq. (127), a small m hardly changes the behavior of λ but shifts φ from zero. 3.4.3
Phase diagrams
Now we show the phase diagram of the strong coupling 2-color QCD in the T -µB plane in Fig. 3. The solid line denotes a critical line separating diquark superfluid phase ∆ 6= 0 and the normal phase ∆ = 0 in the chiral limit m = 0, which is determined analytically by Eq. (44). The dashed line denotes the critical line determined numerically for m = 0.02. The phase transition is of second order on these critical lines. The chiral condensate σ is everywhere zero for m = 0, while it is everywhere finite for m 6= 0. In the latter case, however, σ is particularly large in the region between the solid line and the dashed line. Shown in Fig. 4 is a phase diagram in µB -m plane at T = 0. The lower right of the figure corresponds to the vacuum with no baryon number present, ρB = 0. On the other hand, the upper left of the figure corresponds to the saturated system, ρB = 1, in which every lattice site is occupied by one baryon. There is a region with 0 < ρB < 1 and ∆ 6= 0 bounded by the above two limiting cases, which is separated by two critical lines given in Eq.(55). It is worth mentioning here that we can see the corresponding system in the context of condensed matter physics; the hardcore boson Hubbard model has a similar phase diagram at T = 0 in which
3 QCD (NC = 2, NF = 4) WITH FINITE BARYON DENSITY
Baryon Chemical Potential µ B
18
Temperature T
1.6
∆=0
1.2
0.8
0.4
0 0
∆ =/ 0 1
2
Baryon Chemical Potential µ B
Figure 3: Phase diagram of the strong coupling 2color QCD in the T -µB plane. Solid (dashed) line denotes the critical line for diquark condensation for m = 0 (m = 0.02).
∆=0
ρB= 1
2
∆ =/ 0 1
∆=0
ρB= 0
mπ 0 0
0.5
1
Current Quark Mass m
Figure 4: Phase diagram of strong coupling 2color QCD in the µB -m plane at T = 0. Two solid lines separate the region where ∆ = 0 from the region where ∆ 6= 0.
superfluid phase is sandwiched by Mott-insulating phases with zero or full density [48]. Here we can give a physical explanation for the saturation effect, that is, why the saturated baryon density forces the diquark condensate to disappear. Suppose that one imposes the small external field for the baryon charge on the system in which every lattice site is occupied maximally by quarks. However, a diquark at one site cannot hop to the next site owing to the Pauli principle of constituent quarks and then the current for baryon charge never appears. It results in zero condensate because the superconducting current is proportional to the square of absolute value of the condensate. This is nothing but the analogical phenomenon with the Mott-insulator. Finally, bringing all the discussions together, the phase structure in the three dimensional T -µB m space is shown in Fig. 5. The diquark condensate has a none-vanishing value inside the critical surface and the phase transition is of second order everywhere on this critical surface. The second order phase transition is consistent with other analyses employing the mean field approximation; the random matrix model and the Nambu−Jona-Lasinio model [47] and also the chiral perturbation theory at T = 0 [36]. On the other hand, Monte-Carlo simulations of 2-color QCD [14] show indication of a tricritical point in the T -µB plane at which the property of the critical line changes from the second order to the first order as µB increases. This is also supported by the chiral perturbation theory beyond the mean field approximation at finite T [37]. Aside from the fact that we are working in the strong coupling limit (g → ∞), though the lattice simulations are aiming at the weak coupling limit (g → 0), it would be of great interests to go beyond the mean field approximation in our analysis and study corrections to the phase structure given in Fig. 5.
19
T 0.8
1.6
2.4
1.0 0.5 0
µB
0.4
m 0.8
Figure 5: Phase structure of strong coupling 2-color QCD in the T -µB -m space. The surface represents the critical surface for the diquark condensation, which separates the region where ∆ = 0 from the region where ∆ 6= 0.
4
QCD (Nc ≥ 3, Nf = 4) with finite baryon density
In this section, we consider the strong coupling lattice QCD with finite baryon density. First of all, we review how to derive the effective free energy written in terms of a scalar mode σ and a pseudoscalar mode π for Nc ≥ 3 for the further extension in Sec. 5, while the resultant free energy is almost same as that studied in [20, 21, 22]. Then we analyze the chiral phase transition in the chiral limit at finite temperature and density, and derive analytical formulae for second order critical line and tricritical point. Finally we show the phase diagram in terms of T and µB for Nc = 3.
4.1 4.1.1
Derivation of an effective action Mean field approximation
In the staggered fermion formalism, one species of staggered fermion at various site is responsible for the degree of freedom of flavors and spins. Therefore the auxiliary field σ(x) is responsible for both of the scalar mode σ and the pseudoscalar mode π [38]. In order to derive the effective action written by the scalar and pseudoscalar modes, we introduce σ and π as σ(x) = σ + iε(x)π [39]. Then we can find a correspondence between these new values σ, π and vacuum expectation values of mesonic composites: σ=−
1 hχ ¯a (x)χa (x)i , Nc
π=
1 hi χ ¯a (x)ε(x)χa (x)i . Nc
(59)
These equations tell us that the σ and π fields are even and odd under lattice parity respectively, where lattice parity is defined as [13, 40] χ(x) 7→ χ(x0 ) ,
χ(x) ¯ 7→ χ(x ¯ 0) ,
x0 = (x0 + 1, −x1 , −x2 , −x3 ) .
(60)
Therefore σ and π correspond to the spatially uniform condensates of scalar mode (chiral condensate) and pseudoscalar mode (pion condensate). They transform under U(1)A transformation as µ ¶ µ ¶µ ¶ σ cos 2θA − sin 2θA σ U(1)A : 7→ . (61) π sin 2θA cos 2θA π
20
4 QCD (NC ≥ 3, NF = 4) WITH FINITE BARYON DENSITY
The partition function is then written as Z 0 ¯ Z = D[U0 ] D[χ, χ] ¯ e−S [U0 ,χ,χ;σ,π] ,
(62)
with o X· 1n µ S [U0 , χ, χ; ¯ σ, π] = mχ(x)χ(x) ¯ + χ(x)e ¯ U0 (x)χ(x + ˆ0) − χ(x ¯ + ˆ0)e−µ U0† (x)χ(x) 2 x ¸ ¢ Nc d Nc d ¡ 2 + {σ − iε(x)π} M (x) . σ + π2 + 4 2 0
(63)
Note that this action contains hopping terms of χ, χ ¯ only in the temporal direction after the 1/d expansion and the mean field approximation. 4.1.2
Integrations over χ, χ, ¯ and U0
In order to complete the remaining integrals, we adopt the Polyakov gauge [20] in which U0 (τ, ~x) is diagonal and independent of τ ; h U0 (τ, ~x) = diag e
iφ1 (~ x)/Nτ
,··· ,e
x)/Nτ iφNc (~
i with
Nc X
φa (~x) = 0 .
(64)
a=1
Also we make a partial Fourier transformation for the quark fields; Nτ 1 X χ(τ, ~x) = √ eikn τ χ(n, ˜ ~x) , Nτ n=1
Nτ 1 X ˜¯ ~x) , χ(τ, ¯ ~x) = √ e−ikn τ χ(n, Nτ n=1
kn = 2π
(n − 21 ) . Nτ
(65)
Substituting Eqs. (64) and (65) into the action (63) and taking the summation over τ , the Grassmann integration over the the quark fields χ and χ ¯ results in the following determinant: Nc NY τ /2 YY ~ x a=1 n=1
"
µ sin k¯n + M + 2
2
d π 2
¶2 # (66)
with k¯n = kn + φa (~x)/Nτ − iµ. M denotes the dynamical quark mass defined by M = m + (d/2)σ. The product with respect to the Matsubara frequencies n can be performed using a technique similar to that in the calculation of the free energy in finite temperature continuum field theory. The details of the calculation is given in Appendix A.2. The result turns out to be a quite simple form; p2 cosh [Nτ E] + 2 cos [φa (~x) − iNτ µ] with one-dimensional quark excitation energy E[σ, π] = arcsinh[ M 2 + (d/2)2 π 2 ]. Finally we can perform the integration with respect to U0 by use of the formula in Appendix C for the Polyakov gauge. Then the integration gives, up to an irrelevant factor, Z D[U0 ]
Nc YY ~ x a=1
{2 cosh [Nτ E] + 2 cos[φa (~x) − iNτ µ]} =
( Y X ~ x
n
) det Pn+i−j i,j
,
(67)
where P0 = 2 cosh [Nτ E] ,
P±1 = cosh [Nτ µ] ± sinh [Nτ µ] = e±Nτ µ
and
P|n|≥3 = 0 .
(68)
4.2
Analytical properties in the chiral limit
21
The determinant is to be taken with respect to i, j = 1, 2, · · · , Nc . The determinants have nonvanishing values only for n = 0, ±1 and the summation of them can be calculated exactly for general Nc : Firstly for n = 0, det Pi−j is expressed by the form of Nc × Nc matrix as ¯ ¯ ¯ P0 P−1 0 · · · ¯¯ ¯ ¯ ¯ .. ¯P+1 P0 ¯ . ¯ ¯ det Pi−j = ¯ (69) ¯. .. .. i,j ¯ 0 . . P−1 ¯¯ ¯ ¯ .. ¯ ¯ . P+1 P0 ¯ Making the recursion formula for it and using the fact that P−1 P+1 = 1, we can obtain the simple solution as [20] det Pi−j =
sinh [(Nc + 1)Nτ E] . sinh [Nτ E]
(70)
Then the calculation for n = ±1 is rather easy and results in Nc Nc det P−1+i−j + det P1+i−j = P−1 + P+1 = 2 cosh [Nc Nτ µ] .
(71)
As a result, effective free energy is given as follows;
½ ¾ ¢ P Nc d ¡ 2 sinh [(Nc + 1)E/T ] 2 Feff [σ, π; T, µB ] = (− log Z) / ( x ) = σ + π − T log 2 cosh [µB /T ] + . 4 sinh [E/T ] (72)
Here we have defined the baryon chemical potential µB as µB = Nc µ. This effective action corresponds to the 4 flavor QCD in the continuum limit. Hereafter we put Nf = 4 and consider the effective free energy given in Eq. (72).
4.2
Analytical properties in the chiral limit
The effective free energy obtained in the previous subsection is simple enough to make analytical studies in the chiral limit. This is one of the main advantages of our approach. Such analytical studies on the chiral phase transition is useful to understand the phase structure of the strong coupling lattice QCD, which will be presented in the next√subsection. In the chiral limit m = 0, the quark excitation 2 2 energy reduces to E[σ, √ π] = arcsinh[(d/2) σ + π ]. Therefore the effective free energy in Eq.(72) is 2 2 only a function of σ + π . Of course this symmetry comes from the chiral symmetry U(1)A of the original lattice action. Since we can arbitrarily choose the direction of the condensate, we take σ 6= 0 and π = 0. 4.2.1
Chiral restoration at finite temperature
As we will confirm numerically in the next subsection, the effective free energy exhibits the second order phase transition at finite temperature. Therefore we can expand it in terms of the order parameter σ near the critical point. Expansion of effective free energy up to 2nd order of chiral condensate σ gives Feff [σ, 0] =
¡ ¢ d2 Nc (Nc + 1)(Nc + 2) Nc d 2 σ − σ2 + O σ4 . 4 24T (Nc + 1 + 2 cosh [µB /T ])
(73)
As long as the coefficient of σ 4 is positive, the condition that the coefficient of σ 2 is zero gives critical chemical potential for the second order phase transition as a function of temperature; ¸ · (Nc + 1){d(Nc + 2) − 6T } cri . (74) µB (T ) = T arccosh 12T
22
4 QCD (NC ≥ 3, NF = 4) WITH FINITE BARYON DENSITY
The critical temperature at zero chemical potential is given by solving the equation µcri B (T ) = 0 and turns out to be Tc (0) =
d(Nc + 1)(Nc + 2) . 6(Nc + 3)
(75)
When the coefficient of σ 4 becomes zero, the phase transition becomes of first order. An analytical expression for the tricritical point (Ttri , µtri ) can be obtained as a solution of the coupled equations of Eq. (74) and ∂ 4 Feff /∂σ 4 = 0, and results in p 225Nc2 + 20d2 (3Nc2 + 6Nc − 4) − 15Nc (76) Ttri = , µtri = µcri B (Ttri ) . 20d The effective free energy exhibits the second order chiral phase transition for T ≥ Ttri and it becomes of the first order for T < Ttri . The existence of the tricritical point is consistent with results of other analytical approaches using Nambu−Jona-Lasinio model [26], random matrix model [27], SchwingerDyson equation [28] and other methods [29, 41, 42]. 4.2.2
Chiral restoration at finite density
The analytical study of the first order chiral phase transition at finite temperature for T < Ttri is rather involved. However, the effective free energy reduces to a simpler form at T = 0; · ¸ Nc d 2 d Feff [T = 0] = σ − max {µB , Nc E[σ]} , E[σ] = arcsinh |σ| . (77) 4 2 It is easy to study the first phase transition analytically in this case. The effective free energy has two local minima as a function of σ: One is Feff = −µB at σ = 0. The other is Feff = Nc d σ02 /4 − Nc E[σ0 ] < 0 at σ = σ0 , where σ0 is the solution of the chiral gap equation ∂Feff /∂σ = 0; " √ ¶2 # µ 2 1 + d2 − 2 d 2 2 =1 ∴ σ0 = σ0 1 + σ0 . (78) 2 d2 As µB becomes larger, the global minimum changes from Nc d σ02 /4 − Nc E[σ0 ] to −µB at some value of the chemical potential. This is the critical chemical potential, given by µcri B (T = 0) = Nc E[σ0 ] −
Nc d 2 σ . 4 0
At this critical point, the order parameter σ changes discontinuously as σ0 when µB < µcri B (T = 0) σ(µ) = 0 when µB > µcri B (T = 0) .
(79)
(80)
This is the first order phase transition. Also we can easily calculate the baryon density ρB at T = 0 and it has discontinuity associated with that of the chiral condensate as ( 0 when µB < µcri ∂Feff B (T = 0) ρB = − = (81) ∂µB 1 when µB > µcri B (T = 0) . At the critical chemical potential, ρB changes from the empty density 0 to the saturated density 1 [23]. Note that one baryon (= Nc quarks) at one lattice site, that is ρB = 1, is the maximally allowed
4.3
The phase structure with finite quark mass
23
1
0.5
0 0
m=0 m = 0.1
T = 0.8
ρB
σ
1
2
3
Condensate and Density
Condensate and Density
T = 1.0 1
0.5
0 0
Baryon Chemical Potential µ B
m=0 m = 0.1
ρB
σ
1
2
3
Baryon Chemical Potential µ B
Figure 6: Chiral condensate σ and baryon density ρB as functions of the baryon chemical potential µB for Nc = 3, Nf = 4. In the left panel, they are plotted just above the tricritical temperature (Ttri = 0.866) at T = 1.0 for m = 0 (the solid line) and m = 0.1 (the dashed one). In the right panel, they are plotted just below Ttri at T = 0.8 for m = 0 (the solid line) and m = 0.1 (the dashed one).
configurations by the Fermi statistics for one species of staggered fermion. Such a saturation at large µB on the lattice is already observed for SUc (2) QCD in Sec. 3. This chiral phase transition with finite µB at T = 0 is not associated with the deconfinement phase transition to the quark matter, because we are in the strong coupling limit where quarks are always confined. Eqs. (80) and (81) show that the chiral restoration coincides with the transition from vacuum to the saturated nuclear matter, although they are in general separated [27]. Including the baryonic contribution, which is suppressed in the leading order 1/d expansion, will introduce the Fermi surface of baryons and hence make the two phase transitions separated.
4.3
The phase structure with finite quark mass
In this subsection, setting the number of colors and spatial dimensions to 3, we examine numerically the nature of the chiral phase transition and the phase diagram of strong coupling lattice QCD for Nc = 3, Nf = 4.
4.3.1
Chiral condensate and baryon density
By minimizing the effective free energy Feff for Nc = 3, d = 3 in terms of the order parameter σ, we determine the chiral condensate as a function of T and µB . The baryon density ρB is also calculated by −∂Feff /∂µB . In Fig. 6, the results with zero and finite m are shown as functions of µB . In the left panel of Fig. 6, σ and µB are shown for T = 1.0 just above Ttri = 0.866. In the chiral limit they show second order phase transition at the critical chemical potential given by Eq. (74), while an infinitesimal introduction of m makes the transition smooth crossover. σ and µB are shown for T = 0.8 just below Ttri in the right panel of Fig. 6. As discussed in the previous subsection, they show jumps at the critical chemical potential in the chiral limit. This first order phase transition is weakened by the introduction of m and finally becomes a crossover for large quark masses.
24
4 QCD (NC ≥ 3, NF = 4) WITH FINITE BARYON DENSITY
2
Temperature T
Vicinity of TCP
T 1
σ =0 1
σ =/ 0
0.9
m = 0.4
TCP
CEP
0.8
chiral limit 0 0
0.7 1.65
1
2
TCP
m = 0.01 1.7
1.75
1.8
µB
3
Baryon Chemical Potential µ B
Figure 7: Phase diagram of strong coupling QCD with Nc = 3, Nf = 4 in the T -µB plane. The solid (dashed) line denotes the critical line for the first (second) order phase transition in the chiral limit. The black circle represents the tricritical point (TCP) where the nature of the phase transition changes from of the first order to the second. The first order line and its critical endpoint (CEP) for m = 0.4 are also shown. The dotted line denotes the flow of the critical endpoints when the quark mass is enlarged from 0. White circles are put on the critical endpoints for m = 0.1 (the left one), m = 0.4 (the middle) and m = 0.8 (the right one) in the left panel. The vicinity of TCP is zoomed up and the first order line and CEP for m = 0.01 are shown in the right panel.
4.3.2
The phase diagram
Now we show in Fig. 7 the phase diagram of the strong coupling lattice QCD with Nc = 3, Nf = 4 in the plane of T and µB . In the chiral limit, chiral condensate σ has non-vanishing value at low T and small µB , which means spontaneous breakdown the the chiral symmetry UA (1) by the condensation σ 6= 0. The symmetry broken phase is separated by phase transition from chiral symmetric phase; the phase transition is of second order in the high temperature region while it is of first order in the low temperature region. The second order critical line merges smoothly into the first order one at the tricritical point (Ttri , µtri ) = (0.866, 1.73). In contradiction to our result, the chiral phase transition of 4 flavor QCD in the chiral limit is thought to be of first order [9, 12]. This difference comes from the fact that we have employed the mean field approximation and ignored the chiral fluctuations. However, it is sensible to consider that the second order critical line in our result is accountable for the critical line of chiral restoration in QCD. As we can find from Fig. 7, the critical temperature falls much rapidly as a function of µB in contrast to the results from recent Monte-Carlo simulations at small chemical potential [9, 10, 11, 12]. In order to make the discussion quantitative, we calculate the slope of the critical temperature near zero chemical potential. From Eq. (74): ³ ´ Tc (µ) µ2 µ4 6 = 1 − 1.5 − 3.375 + O (µ/T ) c Tc (0) Tc (0)2 Tc (0)4
(82)
with Tc (0) = 5/3. Here we have written Eq. (82) in terms of the quark chemical potential µ = µB /Nc in order to make the comparison to the lattice data easy. The values of the coefficient of the 2nd term is two orders of magnitude larger than that calculated in the lattice simulation with Nf = 4 for m = 0.05 [12]. This large difference in the slope of chiral phase transition may be understood due to the effect of m = 0 and that of g → ∞. Our expression (82) is derived in the chiral limit, while all of the lattice simulations are performed with finite quark mass. As reported in [43], the chiral phase
4.3
The phase structure with finite quark mass
25
Table 2: Tricritical point (Ttri , µtri ) for m = 0 and critical endpoints (Tend , µend ) for various small quark masses. The percentages of how far the critical endpoints are from the tricritical point are also shown. m 0 0.001 0.01 0.05 0.1 0.2
Tend 0.866 0.823 0.764 0.690 0.646 0.590
µend 1.73 1.73 1.75 1.85 1.96 2.16
(Tend − Ttri )/Ttri — −5.03 % −11.8 % −20.4 % −25.5 % −31.9 %
(µend − µtri )/µtri — −0.541 % 0.599 % 6.37 % 12.9 % 24.7 %
transition line has significant quark mass dependence in the lattice simulations: The slope of Tc (µ) suffers sharp increase by decreasing m, from 0.025 (m = 0.1) to 0.114 (m = 0.005) in Nf = 3 QCD. In addition to that, as we can find in [22], the introduction of the next to leading order term of 1/g 2 and 1/d to the strong coupling lattice QCD decreases the critical temperature and the amount of decrease at zero chemical potential is more than that at finite chemical potential. Therefore the slope of the critical temperature will be softer by the corrections for the strong coupling and large dimensional expansions. Combining the above two effects, the difference of the slope between our result and lattice simulations could become reasonably small, which needs further study. Next we consider the effect of quark mass on the phase diagram. Introduction of finite m washes out the second order phase transition as shown in left panels of Fig. 6. As a result, the first order critical line terminates at second order critical endpoint (Tend , µend ). As long as the quark mass is very small m . 0.001, the critical endpoint flows almost along the tangent line at tricritical point as in the right panel of Fig. 7. Then for the larger quark mass m & 0.001, Tend decreases and µend increases. Also, the first order critical line shifts in the direction of large µB associated with this change. The strong coupling lattice QCD may give us some indication for lattice simulations about the effect of m on the phase diagram of QCD. As shown in Table 2, finite quark mass m = 0.1 decreases Tend by 25% and increases µend by 12% from tricritical point (Ttri , µtri ). We can find in the same way that even a quark mass as small as m = 0.001 can move the critical endpoint by 5%. This indicates the relatively large dependence of the phase diagram of QCD on the quark mass. Our phase structure is consistent with those from other analytical approaches [26, 27, 28, 29, 41, 42], except for one main difference [25]. It is the fact that µtri or µend is larger than the critical chemical potential at T = 0 for every quark mass and then the gradient of critical line near the tricritical point or critical endpoint is positive. In addition, critical endpoint flows in the direction of smaller T and smaller µB as a function of quark mass m ≤ 0.001. Such properties near the tricritical point conflict with the assumption made in [42] that the gradient of critical line near the tricritical point is negative. While this feature is not easy to interpret from physical point of view, such new possibility in the phase structure should be studied more.
26
5
5
QCD (NC ≥ 3, NF = 8) WITH FINITE ISOSPIN DENSITY
QCD (Nc ≥ 3, Nf = 8) with finite isospin density
In this section, we consider the strong coupling lattice QCD with finite isospin density. First of all, we derive the analytical expression for the effective free energy in two particular cases: One is at finite T , finite µB and small µI with the chiral condensates. The other is at finite T , finite µI and zero µB with the chiral and pion condensates. Then we analyze the effective free energy and show the phase diagrams in terms of T and µB or µI for Nc = 3, Nf = 8.
5.1
Strong coupling lattice QCD with isospin chemical potential
In order to investigate the effect of the isospin chemical potential µI on the phase structure of QCD, we have to extend the lattice action studied in the previous section to that with two species of staggered fermion having degenerate masses. The lattice action with two species of staggered fermion corresponds to the 8 flavor QCD in the continuum limit. Then for m = 0 and µI = 0, it has U(2)V × U(2)A symmetry, as a remnant of 8 flavor chiral symmetry, defined by χ(x) 7→ ei(θV +ε(x)θA )·τ χ(x)
−i(θV −ε(x)θA )·τ χ(x) ¯ 7→ χ(x)e ¯
and
(83)
with τ ∈ U(2). After integrating out the spatial link variable Uj in the leading order of 1/d expansion and introducing the auxiliary fields, we have the following partition function; Z 0 ¯ Z = D[U0 ] D[χ, χ] ¯ D[σ] e−S [U0 ,χ,χ;σ] , (84) with 0
S [U0 , χ, χ; ¯ σ] =
X X α=u,d x,y
+
X
· o¸ 1 n µα −µα † U0 (x)δy,x−ˆ0 χα (y) e U0 (x)δy,x+ˆ0 − e χ ¯α (x) mδx,y + 2
(85)
[σβα (x)VM (x, y)σαβ (y) + 2σβα (x)VM (x, y)Mαβ (y)] .
x,y
Here the subscripts α, β represent the species of staggered fermion taking “u” (up quark) and “d” (down quark). µu , µu are quark chemical potentials for each species of staggered fermion. σαβ (x) are auxiliary fields for the mesonic composites Mαβ (x) = χ ¯aα (x)χaβ (x)/Nc , and these vacuum expectation values read hσαβ (x)i = − hMαβ (x)i. Now we replace the auxiliary fields σuu (x) and σdd (x) by the spatially uniform condensates of scalar mode as σuu (x) = σu ,
σdd (x) = σd .
(86)
Then we find that σu and σd correspond to the chiral condensates of up and down quarks: σu = −
1 h¯ ua (x)ua (x)i Nc
and
σd = −
® 1 ¯a d (x)da (x) . Nc
(87)
Also we replace σud (x) and σdu (x) by the spatially uniform condensates of pseudoscalar mode as σud (x) = iε(x)π ,
σdu (x) = iε(x)π ∗ .
(88)
Then π corresponds to the charged pion condensates: π=
1 hi u ¯a (x)ε(x)da (x)i Nc
and
π∗ =
® 1 ¯a i d (x)ε(x)ua (x) . Nc
(89)
5.2
The phase structure for µI < mπ
27
Substituting these mean field values and Eqs. (64), (65) to the action (85), we obtain ´ XXX X Nc d ³ ¯ S 0 [φ, χ, χ; ¯ σu , σd , π] = σu2 + σd2 + 2 |π|2 − X(m, ~x) G−1 (m, n; ~x, φa ) X(n, ~x) , 4 x a m,n ~ x
(90) where ³ ´ ˜¯ ¯ ˜¯(m, ~x), d(m, X(m, ~x) = u ~x)
µ and
X(n, ~x) =
¶ u ˜(n, ~x) ˜ ~x) , d(n,
(91)
and G−1 (m, n; ~x, φa ) (92) µ · ¶¸ φa (~x) d iε(~x) π ∗ δn,m−Nτ /2 − Mu + i sin km + Nτ − iµu δmn . · µ2 ¶¸ = d φa (~x) iε(~x) πδn,m−Nτ /2 − Md + i sin km + − iµd δmn 2 Nτ Mu = m + (d/2)σu and Md = m + (d/2)σd are dynamical quark masses of up and down quarks. After ¯ we obtain the following effective performing the integration over the Grassmann variables X and X, free energy; (Z ) Nc ´ Y £ −1 ¤ Nc d ³ 2 2 2 dU0 Det G (φa ) , Feff [σu , σd , π; T, µB , µI ] = σu + σd + 2 |π| − T log (93) 4 a=1
where
" # N τ µ ¶2 £ −1 ¤ Y © ¡ ¢ª © ¡ ¢ª d 2 Det G (m, n; ~x, φa ) = |π| + Mu + i sin k¯n − iµI · Md − i sin k¯n + iµI 2
(94)
n=1
with k¯n = kn + φa (~x)/Nτ − iµB /Nc : Here we have rewritten the chemical potentials of up and down quarks by µB and µI using the definition µB µI µB µI µu = and µd = . + − (95) Nc 2 Nc 2 The integration over U0 in Eq. (93) is defined in Appendix C. It is impossible to perform the summation over n in Eq. (94) analytically for general µB and µI . However, we can do in two interesting cases: One is the case that µI is lower than a critical value µcri I ∼ mπ , where the pion does not condensate π = 0 [15]. This case is relevant to the realistic systems such as heavy ion collisions and electro-neutral neutron stars. The other is the case that µB = 0, which means we can put σu = σd . In this case, we can compare our results with those obtained by the recent Monte-Carlo lattice simulations [16].
5.2
The phase structure for µI < mπ
First, we derive the analytical expression for the effective free energy in the case of µI < µcri I , where we can put π = 0. The proof for the existence of such a critical value and its correspondence to the pion mass in the framework of strong coupling lattice QCD will be given in the next subsection. In this case, we can calculate the product over n using the formula in Appendix A.2; £ ¤ Det G−1 (m, n; ~x, φa ) =
Nτ Y
{Mu + i sin (kn + φa (~x)/Nτ − iµu )} · {Md + i sin (kn + φa (~x)/Nτ − iµd )}
n=1
= {2 cosh [Nτ Eu ] + 2 cos[φa (~x) − iNτ µu ]} · {2 cosh [Nτ Ed ] + 2 cos[φa (~x) − iNτ µd ]}
(96)
28
5
QCD (NC ≥ 3, NF = 8) WITH FINITE ISOSPIN DENSITY
with one-dimensional up and down quark excitation energy Eu = arcsinhMu , Ed = arcsinhMd . Using the formula in Appendix C, we can complete the SU(Nc ) integration over U0 in Eq. (93) for general Nc . Then we obtain the analytical expression for the effective free energy as follows; ( ) X ¢ Nc d ¡ 2 cri 2 σu + σd − T log det Qn+i−j , Feff [σu , σd ; T, µB , µI < µI ] = (97) i,j 4 n where Q0 = 4 cosh [Eu /T ] · cosh [Ed /T ] + 2 cosh [(µu − µd )/T ] , Q±1 = 2 cosh [Eu /T ] · (cosh [µd /T ] ± sinh [µd /T ]) + 2 cosh [Ed /T ] · (cosh [µu /T ] ± sinh [µu /T ]) , (98) Q±2 = cosh [(µu + µd )/T ] ± sinh [(µu + µd )/T ] ,
Q|n|≥3 = 0
and the determinant is to be taken with respect to i, j = 1, 2, · · · , Nc . Although the effective free energy has the very complicated expression, it reduces to a simple form for µI = 0 and T = 0. At µ = µu = µd , we can put σ = σu = σd . Additionally in the zero temperature limit, Q0 ' e2E/T ,
Q+1 ' e(E+µ)/T ,
Q+2 ' e2µ/T ,
Q−1 ' Q−2 ' 0 .
(99)
When E > µ, Q0 gives the dominant contribution to the effective free energy. On the other hand, when µ > E, Q+2 gives the dominant contribution. Therefore we can write the effective free energy for µI = 0 and T = 0 in terms of µB = Nc µ as follows; · ¸ Nc d 2 Feff [σ; T = 0, µB , µI = 0] = 2 σ − max {µB , Nc E[σ]} . (100) 4 This expression coincides with the effective free energy at T = 0 (77) studied in the previous section up to the factor 2, which comes from the fact that we are now studying with “two” species of staggered fermion. Therefore the discussions on chiral restoration at finite density given in Sec. 4.2 hold true here by replacing the maximally allowed baryon density with ρB = 2. 5.2.1
The phase diagrams
At finite temperature, the integration over the temporal gauge link variable φa of Eq. (96) nontrivially couples the up and down quark sectors. Let us see its consequences numerically here. We show in Fig. 8 the phase diagram in the plane of T and µB with Nf = 8, determined by minimizing the effective free energy Eq. (97) for Nc = 3, d = 3 with respect to the order parameters σu , σd . First we consider the case of µI = 0 in which we can put σu = σd , and the phase diagram is shown in the left panel of Fig. 8. This should be compared to the case of 4 flavor QCD in Fig. 7. The outline of phase diagrams is quite consistent and the discussions given in Sec. 4.3 hold true here, while the critical temperature for Nf = 8 flavor is lower than that for Nf = 4. This is expected from physical point view: With more flavors, the chiral condensate is faster broken by their thermal excitations. In other words, the critical temperature decreases by increasing the number of quark flavors. Next we consider the phase diagram at µI = 0.2 with m = 0.4. As shown in the right panel of Fig. 8, the introduction of µI splits the first order phase transition line to the lines associated with the jump of chiral condensate of up quark and that of down quark. They shift in the opposite directions of µB and terminate at the second order critical endpoints. Such a successive chiral restoration with finite µI as increasing µB is easy to understand intuitively from the fact that up and down quarks suffer the chemical potential differently, µu = µB /Nc + µI /2 and µd = µ/Nc − µI /2. What is non-trivial in our result is the position of the critical endpoints. The temperatures of critical endpoints for σu and σd are both higher than that in the case of µI = 0. This is in contrast to
5.3
The phase structure for µB = 0
29
1
1.5
1
σ u= σ d
µ I = 0.2, m=0.4
m = 0.4 TCP
0.5
CEP
Temperature T
Temperature T
µI = 0
µI = 0 0.5
σ u, σ d
chiral limit 0 0
1
2
0 1.5
3
Baryon Chemical Potential µ B
CEP
CEP
2
σd 2.5
3
Baryon Chemical Potential µ B
Figure 8: Phase diagrams of strong coupling QCD with Nc = 3, Nf = 8 in the T -µB plane with zero (the left panel) and finite (the right one) isospin chemical potential µI . In the left panel, the solid (dashed) line denotes the critical line for the first (second) order phase transition in the chiral limit at µI = 0. The first order line and its critical endpoint for m = 0.4 are also shown. The right panel shows the phase diagram at µI = 0.2 and m = 0.4. Two solid lines represent the critical lines for the first order phase transitions associated with up (the left line) and down (the right one) quark condensates respectively. The first order phase transition line for µI = 0 is plotted by dotted line for comparison. The symbol σu or σd in the figure represents the region where the condensate has large value.
the study using random matrix model [44], Nambu−Jona-Lasinio model [45] and ladder-QCD approach [46], where the temperature of critical endpoints are not affected by µI because up quark sector and down quark sector are completely uncoupled in such approaches. In our approach, as discussed above, up and down quarks are non-trivially coupled via the integration of the temporal gauge link variable U0 at finite temperature.
5.3
The phase structure for µB = 0
We derive the analytical expression for the effective free energy in the case of µB = 0. In this case, we can put σ = σu = σd and obtain the following expression for Eq. (94); £ ¤ Det G−1 (m, n; ~x, φa ) (101) " µ ¶¾ ½ ¶¾# ½ µ N τ µ ¶2 Y d µI φa (~x) µI φa (~x) 2 = −i · M − i sin kn + +i . |π| + M + i sin kn + 2 Nτ 2 Nτ 2 n=1
This expression has the same form as the determinant calculated in Sec. 3.2 for SUc (2) QCD. Therefore we can use the formula in Appendix A.1 for the product over the Matsubara frequencies, and then we obtain £ ¤ Det G−1 (m, n; ~x, φa ) = {2 cosh [Nτ E− ] + 2 cos [φa (~x)]} · {2 cosh [Nτ E+ ] + 2 cos [φa (~x)]}
(102)
with one-dimensional up quark and down anti-quark (or up anti-quark and down quark) excitation energy µq E± = arccosh
(1 +
M 2 ) cosh2 [µI /2]
+
(d/2)2 |π|2
¶ ± M sinh [µI /2] .
(103)
30
5
QCD (NC ≥ 3, NF = 8) WITH FINITE ISOSPIN DENSITY
Using the formula in Appendix C, we can complete the SU(Nc ) integration over U0 in Eq. (93) for general Nc . Then we obtain the analytical expression for the effective free energy as follows; ( ) ´ X Nc d ³ 2 σ + |π|2 − T log det Rn+i−j , Feff [σ, π; T, µB = 0, µI ] = (104) i,j 2 n where R0 = 4 cosh [E− /T ] · cosh [E+ /T ] + 2 , R±1 = 2 cosh [E− /T ] + 2 cosh [E+ /T ] , R±2 = 1 ,
(105)
R|n|≥3 = 0
and the determinant is to be taken with respect to i, j = 1, 2, · · · , Nc . Note that for m = 0 and µI = 0, the effective free energy is a function only in terms of σ 2 + |π|2 . Of course this is from the chiral symmetry U(2)A of the original action at m = µI = 0. The symmetry between σ and π will play an important role in understanding numerical results on the phase structure. Although the effective free energy has the very complicated expression, it reduces to a simple form at T = 0. In the zero temperature limit, R0 ' e(E− +E+ )/T À R±1 ' emax{E− ,E+ }/T À R±2 ,
(106)
because E− and E+ are positive. Therefore we can neglect the contribution of R±1 , R±2 in Eq. (104), and then we obtain the effective free energy for µB = 0 and T = 0 as follows; · ³ ¸ ´ n o ´ Nc d ³ 2 d 2 2 2 Nc Feff [σ, π; T = 0, µB = 0, µI ] = σ + |π| − T log R0 = Nc σ + |π| − (E− + E+ ) . 2 2 (107) If we replace π by ∆ and µI by µB , the above expression corresponds to the free energy at T = 0 of SUc (2) QCD studied in Sec. 3 up to the overall factor Nc . This correspondence is rather natural from the point of view of the symmetry and the effect of chemical potential. In the present system, up and down quarks are indistinguishable because of chiral symmetry at µI = 0 and they undergo the effect of µI with opposite signs. On the other hand in SUc (2) QCD, quark and anti-quark are indistinguishable because of the Pauli-G¨ ursey symmetry [33] at µ = 0 and they also undergo the effect of µB with opposite signs. Therefore there is a correspondence between up (down) quark in the finite isospin density system and (anti-) quark in the finite baryon density SUc (2) system, which also means the correspondence between the pion condensation and the diquark condensation. Note that the difference of the effective free energy in the two systems at T 6= 0 is due to the integration of U0 for the finite isospin density system which couples up and down quarks non-trivially at finite temperature. As calculated in Sec. 3.3 for the case of SUc (2) QCD, we can derive analytical properties from the effective free energy at T = 0 in Eq. (107). The system has two critical chemical potentials, the lower one µlow and the upper one µup c c given respectively by p √ up µlow = 2 arccosh 1 + mM and µ = 2 arccosh 1 + K2 , (108) c c where M is a solution of the chiral gap equation with quark mass m, and K is defined as the solution of Eq. (56). The non-vanishing value of pion condensate π 6= 0 is possible only for µlow ≤ µI ≤ µup c c . low As long as µI < µc , the empty vacuum gives ρI = −∂Feff /∂µI = 0 and π = 0. On the other hand, for µI > µup c , the saturation of the isospin density occurs leading to ρI = Nc and π = 0. For sufficiently small m, the lower critical chemical potential reduces to ( )1/4 2 )1/2 − 1 (1 + d µlow = 2 m1/2 · . (109) c 2
5.3
The phase structure for µB = 0
31
µ I = 0.4
T=0 1
1
m=0
π
0.5
σ
0 0
1
2
1
m = 0.02
ρ I /3
π 0.5
0 0
0.5
ρ I /3 σ
0 0
0.5
2
1
1.5
1
m = 0.02
0.5
π
ρ I /3
σ 1
Condensates and Isospin Density
π Condensates and Isospin Density
m=0
ρ I /3
0 0
Isospin Chemical Potential µ I
0.5
σ
1
1.5
Temperature T
Figure 9: Chiral condensate σ, pion condensate π and isospin density ρI for Nc = 3, Nf = 8. In the left panels, they are plotted as functions of the isospin chemical potential µI at T = 0 for m = 0 (the upper panel) and m = 0.02 (the lower one). In the right panels, they are plotted as functions of the temperature T at µI = 0.4 for m = 0 (the upper panel) and m = 0.02p(the lower one). The dotted lines in the lower panels indicate a total magnitude of the condensates σ 2 + π 2 .
This expression can be rewritten as µlow = mπ with mπ obtained from the excitation spectrum in the c vacuum [38] up to the leading order of the 1/d expansion. This is nothing but a proof of the fact that the critical value of isospin chemical potential µcri I assumed in the previous subsection indeed exists and corresponds to the pion mass. 5.3.1
Condensates, isospin density and phase diagrams
Now we determine the chiral condensate σ and the pion condensate π numerically by minimizing the effective free energy with Nf = 8 flavors in Eq. (104) for Nc = 3, d = 3. The isospin density ρI = −∂Feff /∂µI is also calculated as a function of µI and T . We show the results in Fig. 9 for m = 0 and m = 0.02. The behaviors of σ, π and ρI are quite similar to those of σ, ∆ and ρB studied for SUc (2) QCD, and therefore the discussions in Sec. 3.4 hold true here. Although our results are in principle limited in the strong coupling, the behaviors of σ, π and ρI as functions of µI and T have qualitative agreement with the recent lattice data [16]. And the phase diagram of the strong coupling lattice QCD with Nc = 3, Nf = 8 in the T -µI plane and in the three dimensional T -µI -m space are shown in Fig. 10 and Fig. 11 respectively. The fact that SUc (3) QCD at finite isospin density has the same phase structure as that of SUc (2) QCD at finite baryon density can be understood from the aspect of the symmetry and its breaking pattern. SUc (3) QCD at µI = 0 and m = 0 has chiral symmetry between the chiral condensate and the pion
32
5
QCD (NC ≥ 3, NF = 8) WITH FINITE ISOSPIN DENSITY
T
0.8
Temperature T
1.0
π=0
2.4
π =/ 0
1.6
1.2
1.6
0.5 0
ρI = 3
0.8
µI
0.4
0.4
π =/ 0
m
ρI = 0
0.8
0 0
1
2
Isospin Chemical Potential µ I
Figure 10: Phase diagram of strong coupling QCD with Nc = 3, Nf = 8 in the T -µI plane. Solid (dashed) line denotes the critical line for pion condensation for m = 0 (m = 0.02).
Figure 11: Phase structure of strong coupling QCD with Nc = 3, Nf = 8 in the T -µI -m space. The surface represents the critical surface for the pion condensation, which separates the region where π 6= 0 (inside) from the region where π = 0 (outside).
condensate. On the other hand, SUc (2) QCD at µB = 0 and m = 0 has Pauli-G¨ ursey’s symmetry between the chiral condensate and the diquark condensate. In both theories, the introduction of m breaks the symmetries so that the chiral condensate is favored and the introduction of the µI /µB breaks the symmetries so that the pion/diquark condensate is favored. This is the reason why these two theories have the similar phase structures at finite density.
33
6
Summary and Discussion
In this thesis, we have studied the phase structure of hot and dense QCD with Nc = 2, 3 and Nf = 4, 8 in the strong coupling limit formulated on the lattice. In Sec. 2, we have explained how to derive the effective free energy written in terms of the chiral condensate σ and the diquark condensate ∆ at finite temperature T , baryon chemical potential µB and quark mass m by employing the 1/d expansion (only in the spatial direction). In Sec. 3, we consider strong coupling lattice QCD with Nc = 2 (2color-QCD) for Nf = 4. A major advantage of our approach is that we can derive rather simple formulae in an analytical way for the critical temperature (Tc ), the critical chemical potentials (µlow and µup c c ) and the baryon density (ρB ), which are useful to have physical insight into the problem. Although our results are in principle limited in the strong coupling, the behaviors of σ, ∆ and ρB in the T -µB -m space have remarkable qualitative agreement with the recent lattice data. Since we do not have to rely on any assumption of small µB nor small m in our approach, the strong coupling analysis presented in this thesis is complementary to the results of the chiral perturbation theory and directly provides a useful guide to the lattice 2color-QCD simulations. We have also found that the disappearance of diquark condensation with saturated density can be understood as a Mott-insulating phenomenon. In Sec. 4, we have investigated the phase structure with Nc = 3, Nf = 4 in the T -µB plane and the phase transition of chiral restoration was found to be of second order at high temperature region and of first order at low temperature region. Analytical formulae for the critical line of the second order transition and the position of tricritical point were derived. The critical temperature at small quark chemical potential µ = µB /Nc can be expanded as Tc (µ) ' Tc (0) − 1.5µ2 /Tc (0), and the slope was found to be much larger than that calculated in Monte-Carlo lattice simulations [9, 10, 11, 12]. We have discussed that this difference could be understood as the results of the strong coupling limit g → ∞ and the chiral limit m = 0. We also studied the effect of finite quark mass on the phase diagram: The position of the critical endpoint has relatively large dependence on the quark mass. Especially for small m, critical endpoint shifts in the direction of smaller T and smaller µB . This is because the gradient of critical line near the tricritical point is positive, and such a new feature in the phase diagram of QCD should be studied more. In Sec. 5, we have derived the free energy including isospin chemical potential µI and pion condensate π by extending the formulation studied in Sec. 2 with two species of staggered fermion (Nf = 8) for Nc = 3. Firstly, we have observed that the critical temperature of chiral restoration decreases by increasing the number of quark flavors due to the thermal excitations of quarks. Then we have studied the effect of small µI on the phase diagram in the T -µB plane at finite quark mass: Introduction of µI splits and shifts the first order phase transition line in the opposite directions of µB . In addition, µI moves two critical endpoints to higher temperatures than that for µI = 0. This is a non-trivial effect originating from the integration over the temporal gauge link variable at finite temperature which couples up quark sector and down quark one. Finally we have studied the phase structure in the space of T , µI and m and found a formal correspondence between color SUc (3) QCD with finite isospin density and color SUc (2) QCD with finite baryon density. Such a correspondence can be understood by considering the symmetry and its breaking pattern: chiral (Pauli-G¨ ursey) symmetry at m = 0 and µI = 0 (µB = 0) is broken by the quark mass in the direction of chiral condensation, while it is broken by the isospin (baryon) chemical potential in the direction of pion (diquark) condensation. The behaviors of σ, π and ρI in the T -µI -m space have again qualitative agreement with the recent lattice data at finite µI . There are several directions worth to be explored starting from the present work. Firstly for 2-color QCD, the derivation of an effective action written not only with the chiral and diquark fields but also with the Polyakov loop, L(~x), is interesting because this will allow us a full comparison for all the physical quantities calculated in our formalism and lattice simulations [14]. This is a straightforward generalization of the works in [49], which allows us to analyze hL(~x)i under the influence of chiral and
34
6
SUMMARY AND DISCUSSION
diquark condensates. Also calculation of the meson and diquark spectra including pseudo-scalar and pseudo-diquark channels will give us deeper understanding about the non-static feature of the present system. Another direction is to study the response of the Bose liquid discussed in this thesis under external fields. Although mesons and diquarks are color neutral in 2-color QCD, they can have electric charge so that the external electromagnetic field leads to a non-trivial change of the phase structure if the field intensity is enough strong. The remaining work to be explored for Nc ≥ 3 case is to investigate the phase structure with finite µB and finite µI as well as with T and m, where the non-trivial competition between the chiral and pion condensates takes place. In our formulation, such a study is possible by using the effective free energy given in Eq. (93) with numerical summation over Matsubara frequency and numerical integration over the temporal gauge link variable. How the chiral condensate at finite µB is replaced by the pion condensate as increasing µI is one of the most interesting problem to be examined.
Acknowledgments The author is grateful to all members of hadron theory group in University of Tokyo, H. Abuki, K. Fukushima, T. Hatsuda, K. Iida, S. Sasaki and M. Tachibana for discussions on physics. Especially, he thanks to his supervisor Professor Tetsuo Hatsuda for continuous and stimulating discussions on this work and related subjects.
35
A
Summation over the Matsubara frequency
A.1
Case 1
Let us first take the logarithm of Eq.(35);
log
p
Det[G−1 ]
=
Nτ X
£ ¤ log − cos2 (kn + θ/Nτ ) + 2Y cos (kn + θ/Nτ ) + X 2 .
(110)
n=1
Here X and Y are defined as X 2 = cosh2 µ + M 2 + By differentiating log
µ ¶2 d |∆|2 , 2
Y = M sinh µ .
(111)
p
Det[G−1 ] with respect to X, we obtain
p ∂ log Det[G−1 ] ∂X
(112) ¸ .
Nτ · X X 1 1 √ √ =√ − 2 2 2 2 X + Y n=1 cos (kn + θ/Nτ ) − Y + X + Y cos (kn + θ/Nτ ) − Y − X 2 + Y 2
Because cos(kn + θ/Nτ ) is invariant under the shift n → n + Nτ , we can make the summation of n over the range n = −∞ to n = +∞ with an appropriate degeneracy factor Ω. Then the residue theorem enables us to replace the summation by a complex integral as "I X 1 p X 1 ∂ dz 1 −iNτ −iNτ log Det[G−1 ] = √ − iNτ z 2 2 ∂X Ω 2πi cos (z + θ/N ) + k 1 + e − sin z ¯ 1 + eiNτ z¯ X +Y τ − z¯ # I X dw 1 −iNτ −iNτ 1 − + , (113) iN w τ 2πi cos (w + θ/Nτ ) − k+ 1 + e − sin w ¯ 1 + eiNτ w¯ w ¯ where k± =
p
X2 + Y 2 ± Y .
(114)
Owing to the infinite range of the summation over n, we can choose the closed contour at infinity for the complex integrals with respect to z and w, and thus such complex integrals go to zero. z¯ and w ¯ are the residues satisfying cos (¯ z + θ/Nτ ) + k− = 0 ,
cos (w ¯ + θ/Nτ ) − k+ = 0 .
(115)
Solving these equations, we obtain z¯ + θ/Nτ = ±iE− + π + 2πn ,
w ¯ + θ/Nτ = ±iE+ + 2πn ,
(n = −∞, . . . , ∞) ,
(116)
where E± = arccoshk± .
(117)
36
A SUMMATION OVER THE MATSUBARA FREQUENCY
Substituting Eq. (116) into Eq. (113), we obtain p ∂ log Det[G−1 ] ∂X µ ¶ ∞ X 1 X 1 −iNτ −iNτ q =√ − 1 + eNτ E− −iθ+iNτ π X 2 + Y 2 Ω n=−∞ −i k 2 − 1 1 + e−Nτ E− −iθ+iNτ π − µ ¶ −iNτ −iNτ 1 −q − 1 + e−Nτ E+ −iθ 1 + eNτ E+ −iθ 2 −1 i k+ ¾ ¾ ½ ½ Nτ ∂E+ Nτ ∂E− Nτ Nτ − + − = ∂X 1 + e−Nτ E− −iθ ∂X 1 + e−Nτ E+ −iθ 1 + eNτ E− −iθ 1 + eNτ E+ −iθ h n o n o n o n oi ∂ = log eNτ E− + e−iθ + log e−Nτ E− + e−iθ + log eNτ E+ + e−iθ + log e−Nτ E+ + e−iθ ∂X ∂ [−2iθ + log {2 cos θ + 2 cosh Nτ E− } + log {2 cos θ + 2 cosh Nτ E+ }] . (118) = ∂X We note that the degeneracy factor Ω is just canceled by the infinite degeneracy of the summation on n. Also we have used the fact that Nτ mustpbe an even integer for the staggered fermion. After the integration with respect to X, we find that Det[G−1 ] is expressed in a rather simple form up to irrelevant factors, q £ ¤ Det G−1 (119) ab (m, n; θ) = (2 cos θ + 2 cosh Nτ E− ) · (2 cos θ + 2 cosh Nτ E+ ) . This is the final form shown in Eq. (36) in the text.
A.2
Case 2
In this Appendix, we give the formula for the product over the Matsubara frequencies of the expression Nτ /2
Nτ Y £ ¤ Y £ 2 ¤1 2¯ 2 I= sin kn + λ = sin k¯n + λ2 2 n=1
(120)
n=1
with k¯n = 2π(n − 1/2)/Nτ + φ/Nτ − iµ and Nτ being an even integer. Let us first take the logarithm of above expression and differentiate it with respect to λ; N
τ X ∂ λ log I = . 2 ∂λ sin k¯n + λ2
(121)
n=1
Because sin(kn + φ/Nτ − iµ) is invariant under the shift n → n + Nτ , we can make the summation of n over the range n = −∞ to n = +∞ with an appropriate degeneracy factor Ω. Then the residue theorem enables us to replace the summation by a complex integral as ·I ∂ dz λ 1 −iNτ log I = 2 2 ∂λ Ω 2πi sin (z + φ/Nτ − iµ) + λ 1 + eiNτ z ¸ (122) X λ −iNτ − . 2 sin(¯ z + φ/Nτ − iµ) cos(¯ z + φ/Nτ − iµ) 1 + eiNτ z¯ z¯ Owing to the infinite range of the summation over n, we can choose the closed contour at infinity for the complex integrals with respect to z, and thus such complex integrals go to zero. z¯ are the residues satisfying sin2 (¯ z + φ/Nτ − iµ) + λ2 = 0 .
(123)
37
Solving this equation, we obtain z¯ + φ/Nτ − iµ = ±iE + 2πn ,
±iE + π + 2πn ,
with E = arcsinhλ and n = −∞, . . . , ∞. Substituting Eq. (124) into Eq. (122), we obtain ¸ · ∞ 1 ∂ 1 X Nτ Nτ log I = − ∂λ Ω n=−∞ cosh E 1 + e−Nτ E−iφ−Nτ µ 1 + eNτ E−iφ−Nτ µ · ¸ ∂E Nτ Nτ = − ∂λ 1 + e−Nτ E−iφ−Nτ µ 1 + eNτ E−iφ−Nτ µ o n oi ∂ h n Nτ E = log e + e−iφ−Nτ µ + log e−Nτ E + e−iφ−Nτ µ ∂λ ∂ [−iφ − Nτ µ + log {2 cosh [Nτ E] + 2 cos[φ − iNτ µ]}] . = ∂λ
(124)
(125)
We note that the degeneracy factor Ω is just cancelled by the infinite degeneracy of the summation on n. After the integration with respect to λ, we find that the result is expressed in a rather simple form up to irrelevant factors, I = 2 cosh [Nτ E] + 2 cos[φ − iNτ µ]
(126)
with E = arcsinhλ.
B
Proof of σ = 0 at the global minimum of Feff [σ, ∆]|m=0 For m = 0, it is useful to rewrite the free energy Eq. (40) in terms of the radial and angle variables, σ = λ sin φ ,
|∆| = λ cos φ .
(127)
Then the free energy is Feff [λ, φ] =
d 2 λ − T log {1 + 4 cosh (E+ /T ) · cosh (E− /T )} , 2
with the quasi-quark energy given by µq ¶ d 2 2 2 2 2 2 2 E± = arccosh (d/2) λ + cosh µ + (d/2) λ sinh µ sin φ ± λ sinh µ sin φ . 2
(128)
(129)
What we are going to prove here is that Feff [λ, φ] has the global minimum at φ = 0 for arbitrary T , µ, and λ. Actually we can prove the following statement in a more abstract expression; cosh{a arccosh(b ec )} · cosh{a arccosh(b e−c )} has the global maximum at c = 0 , where a > 1, b > 1, and − log b < c < log b . We can apply this corollary to our problem to prove that φ = 0 is the global minimum of the free energy. Obviously φ = 0 turns out to be the global maximum of cosh(E+ /T ) · cosh(E− /T ) once we substitute, ·q ¸ q 2 2 2 a = 1/T, b = (d/2)2 λ2 + cosh µ, c = log 1 + (dλ/2b)2 sinh µ sin φ + (dλ/2b) sinh µ sin φ . (130) Thus we have proven that Feff [λ, φ] is globally minimized at φ = 0, in other words, the chiral condensate vanishes in the chiral limit.
38
C
C
SU(NC ) INTEGRATION IN THE POLYAKOV GAUGE
SU(Nc ) integration in the Polyakov gauge In this Appendix, we give the formula for the SU(Nc ) integration Z J = dU0 F (U0 ) .
(131)
Here we consider the function which can be written by the product of f (θa ) in the Polyakov gauge as F (U0 ) =
Nc Y
(132)
f (θa ) .
a=1
Since the SU(Nc ) Haar measure in the Polyakov gauge is given by Z
Z dU0 =
Nc π Y
−π a=1
Z =
Nc π Y
−π a=1
¯2 ¯¯ dφa Y ¯¯ iφa iφb ¯ ¯ ¯e − e ¯ ¯ P 2π a
a
φa =0
¯2 ³X ´ dφa ¯¯ ¯ φa , ¯²i1 ···iNc eiφ1 (Nc −i1 ) · · · eiφNc (Nc −iNc ) ¯ · 2π δ 2π
(133)
the integration becomes Z J=
Nc π Y
−π a=1
ÃN ! N c c ¯2 X Y dφa ¯¯ ¯ φa × f (θa ) . ¯²i1 ···iNc eiφ1 (Nc −i1 ) · · · eiφNc (Nc −iNc ) ¯ · 2π δ 2π a=1
Because the delta function can be rewritten as # ÃN ! " Nc ∞ c X X X φa , φa = 2π δ exp −in n=−∞
a=1
(134)
a=1
(135)
a=1
we obtain J=
∞ X n=−∞
²i1 ···iNc ²j1 ···jNc
Nc Z Y
π
a=1 −π
∞ X dφa f (φa ) exp [−i (n + ia − ja ) φa ] = Nc ! det Mn+i−j . i,j 2π n=−∞
(136)
Here we have defined Mn as Z Mn =
π
−π
dφ f (φ) exp [−inφ] , 2π
and the determinant is to be taken with respect to i, j = 1, 2, · · · , Nc .
(137)
REFERENCES
39
References [1] The latest results of the PHOBOS, PHENIX, STAR and BRAHMS collaborations at RHIC are in B. B. Back et al., Phys. Rev. Lett. 91, 072302 (2003); S. S. Adler et al., Phys. Rev. Lett. 91, 072303 (2003); J. Adams et al., Phys. Rev. Lett. 91, 072304 (2003); I. Arsene et al., Phys. Rev. Lett. 91, 072305 (2003). [2] For a recent review on the signal of the quark gluon plasma, see M. Gyulassy, I. Vitev, X.-N. Wang, B.-W. Zhang, nucl-th/0302077. [3] R. Tamagaki, Prog. Theor. Phys. 44, 905 (1970). M. Hoffberg, A. E. Glassgold, R. W. Richardson and M. Ruderman, Phys. Rev. Lett. 24, 775 (1970). For further references, see the review: T. Kunihiro, T. Muto, T. Takatsuka, R. Tamagaki and T. Tatsumi, Prog. Theor. Phys. Suppl. 112, 1 (1993). [4] A. B. Migdal, Nucl. Phys. A210, 421 (1972). R. F. Sawyer and D.J. Scalapino, Phys. Rev. D 7, 953 (1973). For further references, see the review in [3]. [5] D. B. Kaplan and A. E. Nelson, Phys. Lett. B 175, 57 (1986). For further references, see the review: C. H. Lee, Phys. Rep. 275, 255 (1996). [6] The possibility of superconducting quark matter was originally studied in B. C. Barrois, Nucl. Phys. B129, 390 (1977); D. Bailin and A. Love, Phys. Rep. 107, 325 (1984). For the recent progress on such a system, see K. Rajagopal and F. Wilczek, in At the Frontier of Particle Physics: Handbook of QCD, edited by M. Shifman (World Scientific, Singapore, 2001), p. 2061, hep-ph/0011333; M. G. Alford, Ann. Rev. Nucl. Part. Sci. 51, 131 (2001). [7] See, for example, F. Karsch, Lect. Notes Phys. 583, 209 (2002). S. D. Katz, hep-lat/0310051. [8] For an introductory review on the lattice QCD at finite density and related works, see S. Muroya, A. Nakamura, C. Nonaka and T. Takaishi, Prog. Theor. Phys. 110, 615 (2003). [9] Z. Fodor and S.D. Katz, Phys. Lett. B 534, 87 (2002); J. High Energy Phys. 03, 014 (2002). [10] C.R. Allton, S. Ejiri, S. J. Hands, O. Kaczmarek, F. Karsch, E. Laermann, Ch. Schmidt and L. Scorzato, Phys. Rev. D 66, 074507 (2002). [11] P. de Forcrand and O. Philipsen, Nucl. Phys. B642, 290 (2002); Nucl. Phys. B673, 170 (2003). [12] M. D’Elia and M.-P. Lombardo, Phys. Rev. D 67, 014505 (2003). [13] S. Hands, J. B. Kogut, M.-P. Lombardo and S. E. Morrison, Nucl. Phys. B558, 327 (1999). S. Hands, I. Montvay, S. Morrison, M. Oevers, L. Scorzato and J. Skullerud, Eur. Phys. J. C 17, 285 (2000). [14] J.B. Kogut, D. Toublan and D.K. Sinclair, Phys. Lett. B 514, 77 (2001); Nucl. Phys. B642, 181 (2002); Phys. Rev. D 68, 054507 (2003). J. B. Kogut, D. K. Sinclair, S. J. Hands and S. E. Morrison, Phys. Rev. D 64, 094505 (2001).
40
REFERENCES
[15] D. T. Son and M. A. Stephanov, Phys. Rev. Lett. 86, 592 (2001); Phys. At. Nucl. 64, 899 (2001). T. D. Cohen, Phys. Rev. Lett. 91, 032002 (2003); Phys. Rev. Lett. 91, 222001 (2003). [16] J.B. Kogut and D.K. Sinclair, Phys. Rev. D 66, 014508 (2002); Phys. Rev. D 66, 034505 (2002). [17] E. Dagotto, F. Karsch and A. Moreo, Phys. Lett. B 169, 421 (1986). [18] E. Dagotto, A. Moreo and U. Wolff, Phys. Lett. B 186, 395 (1987). [19] J. U. Klatke and K. H. Mutter, Nucl. Phys. B342, 764 (1990). [20] P. H. Damgaard, N. Kawamoto and K. Shigemoto, Phys. Rev. Lett. 53, 2211 (1984); Nucl. Phys. B264, 1 (1986) P. H. Damgaard, D. Hochberg and N. Kawamoto, Phys. Lett. B 158, 239 (1985). [21] E.-M. Ilgenfritz and J. Kripfganz, Z. Phys. C 29, 79 (1985). G. F¨aldt and B. Petersson, Nucl. Phys. B264 [FS15], 197 (1986). N. Bili´c, K. Demeterfi and B. Petersson, Nucl. Phys. B377, 651 (1992). N. Bili´c, F. Karsch and K. Redlich, Phys. Rev. D 45, 3228 (1992). [22] N. Bili´c and J. Cleymans, Phys. Lett. B 335, 266 (1995). [23] R. Aloisio, V. Azcoiti, G. Di Carlo, A. Galante and A. F. Grillo, Nucl. Phys. B564, 489 (2000). E. B. Gregory, S.-H Guo, H. Kr¨oger and X.-Q. Luo, Phys. Rev. D 62, 054508 (2000). [24] Y. Umino, Phys. Rev. D 66, 074501 (2002). B. Bringoltz and B. Svetitsky, Phys. Rev. D 68, 034501 (2003). V. Azcoiti, G. Di Carlo, A. Galante and V. Laliena, J. High Energy Phys. 0309, 014 (2003). S. Chandrasekharan and F.-J. Jiang, Phys. Rev. D 68, 091501 (2003). [25] K. Fukushima, hep-ph/0312057. [26] M. Asakawa and K. Yazaki, Nucl. Phys. A504, 668 (1989). J. Berges and K. Rajagopal, Nucl. Phys. B538, 215 (1999). [27] M. A. Stephanov, Phys. Rev. Lett. 76, 4472 (1996). M. A. Halasz, A. D. Jackson, R. E. Shrock, M. A. Stephanov and J. J. M. Verbaarschot, Phys. Rev. D 58, 096007 (1998). [28] C. D. Roberts and S. M. Schmidt, Prog. Part. Nucl. Phys. 45, S1 (2000), and references therein. T. Ikeda, Prog. Theor. Phys. 107, 403 (2002). S. Takagi, Prog. Theor. Phys. 109, 233 (2003). [29] A. Barducci, R. Casalbuoni, S. De Curtis, R. Gatto and G. Pettini, Phys. Rev. D 41, 1610 (1990). A. Barducci, R. Casalbuoni, G. Pettini and R. Gatto, Phys. Rev. D 49, 426 (1994). [30] Y. Nishida, K. Fukushima and T. Hatsuda, hep-ph/0306066 to appear in Phys. Rep. (2004). Y. Nishida, hep-ph/0310160 to appear in Prog. Theor. Phys. Suppl. (2004). [31] Y. Nishida, hep-ph/0312371.
REFERENCES
41
[32] J. B. Kogut and L. Susskind, Phys. Rev. D 11, 395 (1975). T. Banks, J. B. Kogut and L. Susskind, Phys. Rev. D 13, 1043 (1976). L. Susskind, Phys. Rev. D 16, 3031 (1977). See also textbooks on lattice gauge theory, e.g., I. Montray and G. M¨ unster, Quantum Fields on a Lattice (Cambridge University Press, Cambridge, 1994). [33] W. Pauli, Nuovo Cimento 6, 205 (1957). F. G¨ ursey, Nuovo Cimento 7, 411 (1958). [34] H. Abuki, T. Hatsuda and K. Itakura, Phys. Rev. D 65, 074014 (2002). K. Itakura, Nucl. Phys. A715, 859 (2003). [35] This integral is known as the pfaffian. See e.g., J. Zinn-Justin, Quantum Field Theory and Critical Phenomena (Clarendon Press, Oxford, 1989), Chapter 1. [36] J.B. Kogut, M.A. Stephanov and D. Toublan, Phys. Lett. B 464, 183 (1999). J.B. Kogut, M.A. Stephanov, D. Toublan, J.J.M. Verbaarschot, and A. Zhitnitsky, Nucl. Phys. B582, 477 (2000). [37] K. Splittorff, D. Toublan and J.J.M. Verbaarschot, Nucl. Phys. B639, 524 (2002). [38] H. Kluberg-Stern, A. Morel and B. Petersson, Nucl. Phys. B215 [FS7], 527 (1983). H. Kluberg-Stern, A. Morel, O. Napoly and B. Petersson, Nucl. Phys. B220 [FS8], 447 (1983). T. Jolicoeur, H. Kluberg-Stern, A. Morel, M. Lev and B. Petersson, Nucl. Phys. B235 [FS11], 455 (1984). [39] N. Kawamoto and J. Smit, Nucl. Phys. B192, 100 (1981). [40] C. Van den Doel and J. Smit, Nucl. Phys. B228, 122 (1983). M. F. L. Golterman and J. Smit, Nucl. Phys. B245, 61 (1984). [41] N. G. Antoniou and A. S. Kapoyannis, Phys. Lett. B 563, 165 (2003). [42] Y. Hatta and T. Ikeda, Phys. Rev. D 67, 014028 (2003). [43] F. Karsch, C. R. Allton, S. Ejiri, S. J. Hands, O. Kaczmarek, E. Laermann and C. Schmidt, hep-lat/0309116. [44] B. Klein, D. Toublan and J. J. M. Verbaarschot, Phys. Rev. D 68, 014009 (2003). [45] M. Frank, M. Buballa and M. Oertel, Phys. Lett. B 562, 221 (2003). D. Toublan and J. B. Kogut, Phys. Lett. B 564, 212 (2003). [46] A. Barducci, G. Pettini, L. Ravagli and R. Casalbuoni, Phys. Lett. B 564, 217 (2003). [47] B. Vanderheyden and A. D. Jackson, Phys. Rev. D 64, 074016 (2001). [48] G. Schmid, S. Todo, M. Troyer and A. Dorneich, cond-mat/0110024. [49] K. Fukushima, Phys. Lett. B 553, 38 (2003); Phys. Rev. D 68, 045004 (2003).