J. Santamaria et al.
Influence of creep forces on the risk of derailment of railway vehicles J. SANTAMARIA*, E.G. VADILLO, J. GOMEZ Department of Mechanical Engineering, University of the Basque Country. Alameda Urquijo s.n., 48013 Bilbao, Spain
Provided from http://sites.google.com/site/bilbaorail/ for non-commercial research and education use. Not for reproduction, distribution or commercial use.
NOTICE: This is an electronic version of an article published in Vehicle System Dynamics, Vol. 47, Nº 6, pp. 721-752. 2009. Changes resulting from the publishing process, such as editing, corrections, structural formatting, and other quality control mechanisms may not be reflected in this document. VEHICLE SYSTEM DYNAMICS is available online and the final version can be obtained at: http://www.tandfonline.com/doi/abs/10.1080/00423110802368817
Please cite this paper as: Santamaria, J., Vadillo, E.G., Gomez, J. Influence of creep forces on the risk of derailment of railway vehicles. Vehicle System Dynamics, Vol. 47, pp. 721-752. 2009
*Corresponding author. Email:
[email protected]; Tel: +34 94 6014230; Fax: +34 94 6014215
J. Santamaria et al.
1
Influence of creep forces on the risk of derailment of railway vehicles J. SANTAMARIA*, E.G. VADILLO, J. GOMEZ Department of Mechanical Engineering, University of the Basque Country. Alameda Urquijo s.n., 48013 Bilbao, Spain *Corresponding author. Email:
[email protected]; Tel: +34 94 6014230; Fax: +34 94 6014215 Abstract: The derailment mechanism in a railway vehicle is a complex mechanical phenomenon which has been, and still is, the subject of intense research activity due to the serious consequences it can entail. Since Nadal deduced his well-known formula, many researchers have put forward alternative equations which all attempt to move closer to data obtained experimentally. This paper provides a summary of the best known, and draws up a new formulation based on the theoretical 3-D study of creep forces emerging in contact on the wheel likely to derail. It also provides an in-depth analysis of the role played by spin creepage, including its effect on obtaining theoretical derailment limits which are more realistic than those obtained using Nadal’s formula. Finally, a new derailment criteria is proposed. This new criteria leads to less conservative values than Nadal’s equation for zero yaw angles. When the yaw angle is high enough, the results obtained are coincident with those predicted by Nadal’s equation. Keywords: Whel/Rail contact; Flange climb; Spin creepage.
1. Introduction There are many lines of research in connection with railway dynamics, although the importance of one such line is enhanced by its direct effect on human safety: the analysis and study of the causes of derailment. Fortunately very few derailments actually occur, and this makes trains one of the safest means of transport. Nevertheless, every time a derailment leads to the loss of human life, news of such events have an enormous impact on public opinion, jeopardising that feeling of safety which it is important for passengers to have with regard to travelling by train. This is why it is important to reduce the risk of derailment as much as possible for both passenger transit and freight trains (the latter are frequently used to transport hazardous materials). The derailment mechanism occurs when the wheel flange makes contact with the rail edge, a certain amount of adherence appears, and the wheel climbs right up the rail neutralizing the steering system. In 1896 Nadal [1] established his famous simple equation setting out a limit relationship between lateral force and vertical force (L/V) which may be transmitted to a wheel without engendering any risk of derailment. The formula depends solely on the friction coefficient between the wheel and the rail, and the angle of the wheel flange, and is used as at least an initial or basic reference by railway authorities worldwide [2]. Nadal obtained his equation on the basis of calculation hypotheses which, it is now known, are not completely true, and can be improved. There is a general perception, observed by a large number of experimental measurements, that Nadal’s formula is rather conservative [3-8]. Tests have been performed in which derailment occurred for a forces quotient much greater than the limit envisaged in the equation [3,9]. The reason for discrepancies between experimental measurements and the theoretical formula is that the
2
Influence of creep forces on the risk of derailment coefficient
risk of derailment actually depends on other important factors such as the wheelset’s yaw angle or duration of lateral force. This has prompted a number of researchers in recent years to establish alternative improved formulae, which take into account not only the friction coefficient and the angle of the flange, but also one or more of the above mentioned factors [10-16]. These equations attempt to predict more accurately the actual risk of derailment at any given moment. Modern research focuses on the one hand on analysing the influence of certain factors on the risk of derailment, and on the other on adding these factors to a single mathematical equation for a more realistic definition of the risk of derailment. The use of this new equation in dynamic simulation will help establish to a greater degree of precision the safety of a vehicle’s movements as analysed under differing conditions, and thus optimise its design. This type of safety would be computed as the margin from L/V existing at each given moment to the L/V limit value at that moment. The main objective of this paper is to draw up a new formulation for the derailment limit L/V, based exclusively on a theoretical study of the forces emerging in wheel-rail contact in the moments preceding derailment. This new formulation establishes the same (L/V)lim than Nadal’s equation when the yaw angle of the wheelset is high, while allows an increase of this limit when the yaw angle is low or negative. This is coherent with experimental measurements [3,14], where derailment occurred for higher values of L/V than those predicted by Nadal’s equation when the yaw angle is small. 2. Derailment limits in railway dynamics 2.1 Nadal’s equation In 1896 Nadal drew up his well known elegant equation [1], establishing a limit relationship between lateral force and vertical force which may be transmitted to a wheel with no risk of derailment. Nadal’s formula is based on the equilibrium of forces acting on the wheel in the moments prior to derailment (figure 1). The lateral and vertical forces transmitted to the wheel are known as L and V respectively. N and Ty are the reactive forces which emerge on the wheel’s contact with the rail in the normal and tangential direction. Drawing up the equilibrium of lateral and vertical forces, the following emerges: L = N sin δ − T y cos δ
(1)
V = N cos δ + T y sin δ
(2)
where δ is the angle of the flange. When these two expressions are divided up by sides, the following is then obtained: Ty tan δ − L N = (3) Ty V 1 + tan δ N Nadal assumes that the most unfavourable situation arises when tangential force Ty is at its maximum, since this assists with derailment. According to Coulomb’s theory, the maximum Ty force which can arise in contact cannot be greater than the product of the static
J. Santamaria et al.
3
friction coefficient µ and the normal force, and this situation is known as the saturation condition (equation 4): T y max = µ N
(4)
Replacing this value in expression (3) leads to the following: L tan δ − µ = V 1 + µ tan δ
(5)
which is the equation established by Nadal, where δ represents the wheel’s maximum contact angle, which will match that of the flange, and µ represents the friction coefficient between the flange and the rail, which may differ from that of other areas on the wheel. Nadal’s formulation is widely studied in the bibliography, as for example in references [6,17].
V L N
Τy
δ
Figure 1. Equilibrium of forces on the wheel in the moments prior to derailment.
The importance of the Nadal criterion lies in that it furnishes a limit value for the lateral force which may be applied to the wheel, below which there is a guarantee that the flange cannot climb up the head of the rail, and therefore derailment will not take place. Nadal’s limit must be understood as a guaranteed minimum value, but it does not necessarily provide a realistic value indicating the real proximity of derailment. Henceforth considering the type of derailment due to the climbing flange, Nadal’s formula is quite conservative, mainly because it considers a lateral tangential force Ty as completely saturated in contact, when this is not actually the case. The possible existence of a longitudinal component of tangential force Tx would reduce the maximum value which could be attained by Ty, since according to Coulomb’s law the total tangential force cannot be greater than the saturation limit:
Tx + T y ≤ µ N 2
2
(6)
4
Influence of creep forces on the risk of derailment coefficient
Moreover, if the situation set out in figure 1 is analysed, where the wheelset yaw angle is zero, when the wheel derails it climbs up the rail, thereby causing upward creepage. Not only the tangential force which emerges from this lateral creepage is not a maximum ascending force, as shown in the figure, but it would be a descending force opposing the slide. This situation is much more favourable in terms of preventing the risk of derailment than that set out in figure 1, and this would explain the result that the data obtained experimentally for small yaw angles indicate much higher limits than those obtained using Nadal’s equation. Nadal in fact thought that the wheel climbed at a forward contact point with respect to the wheel’s vertical diametral section, and this only happens when the wheelset’s yaw angle is not zero. Furthermore, in this situation, at the forward contact point an ascending tangential force tends to emerge on the wheel due to the wheel’s own rolling movement, and this assists derailment (figure 2). Nadal’s theory establishes that, whatever this force finally is, it may never be greater than µ Ν and will not have an inclination greater than the flange of the wheel measured on the vertical diametral plane. 2.2 Alternative formulations In recent years a number of researchers have come up with alternative formulations or formulations as complements to Nadal’s limit in order to establish derailment risk indicators more in touch with reality [6]. Experimentation has proved, for instance, that for derailment to take place it is necessary that the lateral force applied to the wheel be maintained for a certain period of time, and certain theories add to Nadal’s limit by establishing minimum periods of time during which the lateral force must be maintained for derailment to take place [11]. Others attempt to consider the same effect by envisaging a minimum distance travelled by the vehicle with a lateral force on the wheel greater than Nadal’s limit [14]. Contact point
xw
Contact point xw
V
ψ
yw
V
Contact point y
V w
ψ xw
yw Wheel
Rail
Rail
Wheel
wheel
wheel
wheel
Wheel
Rail
Contact point
T
T
rail
Contact point
a) Lead contact
rail
Contact point
b) Radial position
rail
T
c) Lag contact
Figure 2. Three situations in the flange contact scenario. a) Lead contact (positive angle of attack), b) radial position (zero angle of attack) and c) lag contact (negative angle of attack).
J. Santamaria et al.
5
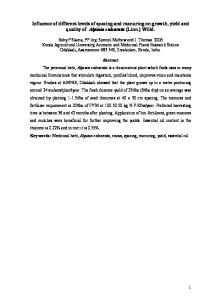
Some of the additional parameters included to establish more accurate derailment limits, apart from the friction coefficient and the flange angle, are as follows: • The wheelset yaw angle. This is a basic input datum since, as demonstrated in the previous section, the limit obtained using Nadal’s formula may be quite conservative for zero or negative yaw angles. • The friction coefficient on the wheelset’s other wheel. • The reduction of the vertical force applied to the wheel with respect to the nominal value. • The value of the longitudinal tangential force. The major parameter to be taken into consideration, omitted in Nadal’s equation, must surely be the wheelset’s angle of attack. This is certainly an indicator which may easily be evaluated in a dynamic simulation of the vehicle [18-20]. It could also be obtained on properly instrumented vehicles and track. The influence of the yaw angle on possible derailment is very high, and so it must be considered in ride safety estimations [20]. The graphs in figure 3 represent the L/V forces quotient for which a wheel derails in relation to the wheelset yaw angle, obtained both by theoretical expressions and by measured data. Experimental values have been taken from [3], and only the minimum value of the quotient obtained for each yaw angle has been drawn. Theoretical values correspond to Elkins&Wu criteria [12], and to the TCRP report 71 proposed criteria [14]. As may be observed, in all cases, for small yaw angles derailment occurs with high L/V values (significantly greater than Nadal’s theoretical limit), while as the yaw angle increases, the L/V value decreases to converge towards Nadal’s limit. Other researchs also show the same tendency comparing experimental measurements with dynamic simulations [5,9,21]. 1.8 Experimental values Elkins&Wu limit Nadal limit TTCI limit
1.7 1.6
(L/V) lim
1.5 1.4 1.3 1.2 1.1 1 0.9
0
1
2
3
4
5
ψ (mrad)
6
7
8
Figure 3. Value of the L/V quotient for which derailment occurs in relation to the yaw angle, as per experimental measurements and theoretical limits.
6
Influence of creep forces on the risk of derailment coefficient
3. Analysis of creepage forces in 3-D The forces involved in Nadal’s limit (L and V) are represented on a Cartesian coordinate system xyz linked to the track, which moves longitudinally at the same speed as the vehicle (figure 4). The longitudinal axis x follows the direction of the track, the y axis is the lateral direction over the track plane, and axis z is perpendicular to both. If there is no superelevation, the z axis will be vertical. An initial auxiliary Cartesian system is defined as attached to the wheelset, xwywzw, the result of rotating the global system around the z axis at angle ψ. This ψ is the wheelset’s yaw angle so that yw axis is the direction of the wheelset’s revolving shaft. A second auxiliary system of coordinates is positioned at the wheel-rail contact point, x’y’z’ (figure 5). In this system, the z’ axis is normal to the contact plane, the x’ axis is tangential to the rolling circle, and the y’ axis is perpendicular to the other two in such a way that this forms a clockwise system. Figure 5 also shows the orientation of the axes in this second auxiliary system if the contact point is not over the wheel’s vertical diametral section. Denoting ∆ as the contact point distance with respect to the vertical diametral plane over the xw axis, ξ is the angle rotated by the x’y’z’ system around the yw axis. An angle δ (the contact angle) is then rotated around the x’ axis. Figures 4 and 5 show the directions taken as positive for all axes. z y zw O
ψ
yw
x Ow
ψ
xw V
Figure 4. The xyz global reference system and the reference system attached to the wheelset, xwywzw.
zw
zw
yw
y’
xw x’
z’
δ r
δ a)
ξ ∆
z’ P
V
b)
Figure 5. a) The reference system associated with the contact point. b) A forward contact point with respect to the wheel’s vertical diametral section.
J. Santamaria et al.
7
The transformation matrix A between global system and the system associated with contact, in consideration of the rotations effected, is as follows:
0 1 A = 0 cos δ 0 − senδ
0 senδ cos δ
cos ξ 0 − senξ
0 senξ cosψ 1 0 − senψ 0 cos ξ 0
senψ cosψ 0
0 0 1
(7)
Thus, in order to express in the global system a vector v’ defined in the contact-associated system, it must be multiplied by matrix A transposed: v = AT v'
(8)
The reactive force r emerging on the wheel’s point of contact with the rail has two components: the normal component N, which has normal direction to the contact plane z’, and the tangential component t. This in turn may be broken down into the two directions defining the contact tangential plane (x’ y’) to obtain Tx and Ty. When r is defined in the contact-associated system, the following is obtained: r' = Tx x' + T y y' + N z'
(9)
Subsequently, therefore, to obtain the 3 components of the contact force within the global system, which is where the forces quotient will be computed, the following transformation must be made: r = AT r ' 10) Considering equilibrium of the wheel, the reactive force on the contact r is equal and opposite to the force transmitted to the wheel, f, including inertia forces. If the three components of this force in the global system are H, L and Z, f = H x + L y + Z z . Considering that the vertical component of the force used in Nadal’s equation V is oriented in the negative direction of z, V = -Z. These equalities lead to the following expressions: H = −Tx (cosψ cos ξ ) + T y (cosψ sin ξ sin δ + sinψ cos δ ) + N (cosψ sin ξ cos δ − sinψ sin δ ) (11)
L = −Tx (sinψ cos ξ ) − Ty (cosψ cos δ − sinψ sin ξ sin δ ) + N (cosψ sin δ + sinψ sin ξ cos δ ) (12) V = Tx (sin ξ ) + T y (cos ξ sin δ ) + N (cos ξ cos δ )
(13)
Drawing up the (L/V) forces quotient using the above equations, a new derailment limit is obtained which not only depends on the contact angle δ, but also on the wheelset’s yaw angle ψ and on the forward position of the contact point, represented by the angle ξ. Since these expressions are deduced in a system of coordinates linked to the track, they are independent of the track cant angle and can be used when the vehicle is negotiating a curve. The friction coefficient, which does not appear explicitly in the equations, is introduced by assuming saturation of the tangential force in the contact according to expression (6). If the tangential force is saturated, the components Tx and Ty are not independent. In order to study the influence of each of them on derailment, new coefficients are defined:
8
Influence of creep forces on the risk of derailment coefficient
tx =
Tx
ty =
T
Ty T
(14)
which represent the rate of tangential creep force emerging in direction x’ and direction y’ respectively, where T is the modulus of the total tangential force. For calculation of the derailment coefficient, it is assumed that the most unfavourable situation is a saturated tangential force (maximum force), since its two components Tx and Ty assist derailment: Ty due to its ascending vertical component (figure 1), and Tx because, if the contact point is in a forward position, this also creates an ascending vertical component (figure 2). Thus the saturation condition is: tx + t y = 1 2
2
(15)
While the contact angle δ can reach high values on the flange, angles ψ and ξ are always very small in railway dynamics. Although even these small values have a great influence on the vehicle’s dynamics, the practical influence of including these angles in Nadal’s coefficient is quite low. To demonstrate this, the variation of this coefficient (L/V) has been set out for non-zero values of the angles, drawn up separately for the sake of clarity. Thus, initially a zero value is assigned to ξ in expressions (12) and (13), and when the tx and ty coefficients are introduced the following is obtained: L = −t x T (sinψ ) − t y T (cosψ cos δ ) + N (cosψ sin δ )
(16)
V = t y T (sin δ ) + N (cos δ )
(17)
Assuming the saturation condition, division of the two forces gives the derailment coefficient in relation to the yaw angle:
(L / V ) =
tan δ cosψ − t y µ cosψ − t y µ tan δ + 1
t x µ sinψ cos δ
(18)
Here it should be noted that tx and ty are not independent, and are related by the saturation condition (15). If this function is represented for specific values of δ and µ (figure 6), it may be observed that the derailment limit is lower when the yaw angle is larger. Moreover, it is obvious that the limit also decreases with lower values of tx, since this involves a greater value of ty, which promotes the derailment, as mentioned above. When tx and ψ are zero, the value obtained is the same as that obtained by Nadal, since it represents the same situation. The following conclusions may be drawn from figure 6: • The variation in the derailment coefficient due to the yaw angle, considering its effect on the spatial decomposition of forces on the contact is extremely small. In rail simulations it is unusual that this will reach values of ψ = 4º. • When tx is zero (lateral force Ty saturated), the influence of the yaw angle is not appreciable. In fact, as may be observed in equation (18), there is a term which includes cos ψ in the numerator, but since this angle is very small, it is very close to 1. This means
J. Santamaria et al.
9
that the influence of angle ψ is observed due to the lateral component of longitudinal force Tx, and more so the greater the yaw angle. This formulation takes no account of the greater effect of a large yaw angle, which is the emergence of lateral creepage on the wheel, extremely unfavourable in terms of derailment. Thus the influence of ψ is insignificant. Section 6 will include this effect in the paper’s final formulation.
2.5
2
ψ=0º
L/V
1.5
ψ =6º 1
Nadal's value
0.5
0
0
0.2
0.4
tx
0.6
0.8
1
Figure 6. Variation of L/V in relation to the tx, parameter for two different yaw angles, in accordance with equation (18), assuming δ = 70º and µ = 0.3.
To study the influence of a contact point in a forward position with respect to the wheel’s vertical diametral section, a zero value is assigned to ψ and, as in the previous case, the following expressions are obtained for L and V: L = −t y T (cos δ ) + N (sin δ )
(19)
V = t x T (sin ξ ) + t y T (cos ξ sin δ ) + N (cos ξ cos δ )
(20)
It should be noted that in reality if the yaw angle ψ is zero, it is not possible for the contact point to be in a forward position with respect to the wheel’s vertical diametral section. However, the intention is to analyse the influence of the ξ parameter on the (L/V) quotient, and so it is more clear to assign a zero value to the yaw angle in order to separate both effects. Bearing in mind that tx and ty are dependents as per equation (15), (L/V) is now:
(L /V ) =
tan δ − t y µ sin ξ (1 + t y µ tan δ ) cos ξ + t x µ cos δ
(21)
Figure 7 shows equation (21) in relation to tx, for 3 values of angle ξ. Logically, the limit (L/V) decreases as this angle becomes greater, and the differences are more significant than
10
Influence of creep forces on the risk of derailment coefficient
in the case above. It may also be observed that the value converges towards Nadal’s limit for values tx = 0. One of the most interesting conclusions drawn from a study of figure 7 is that, when the forward position of the contact point is considered, the zero value of tx is no longer that which provides a minimum value for L/V. This effect is accentuated as angle ξ increases. The phenomenon may be explained by the fact that when the contact point is in the forward position, a vertical component of force Tx assists derailment. For small values of tx, force Ty barely decreases with respect to the saturated value, while an extra vertical component appears due to Tx, and so the global situation is more unfavourable than if tx were 0. 2.6 2.4 2.2
L/V
2
ξ = 20 º
1.8
ξ = 10 º
1.6
ξ =0º
1.4 1.2 1
Nadal's Value 0
0.2
0.4
tx
0.6
0.8
1
Figure 7. Variation of L/V in relation to parameter tx, for 3 different values of angle ξ, as per equation (21), assuming δ = 70º and µ = 0.3.
In the case of both angle ψ and angle ξ, they have very little influence on L/V as observed in the above results. Furthermore, analysis of the case in which tx = 0 (when lateral force is at its maximum) shows that this variation is practically non-existent. This contradicts the experimental results, where it is observed that the influence of the yaw angle is considerable. The explanation lies in the fact that if this parameter is used only for geometric decomposition of the forces at contact, this avoids the major repercussion of the yaw angle in derailment: the emergence of substantial lateral creepage. It may also be observed that when yaw angle ψ = 0, the L/V limit value obtained is the same as Nadal’s limit, and so this case does not match experimental results, where it has been observed that in these situations the limit is greater. In the light of these results, the method proposed in this paper to obtain a more realistic derailment limit is based on the following steps: • Study of the creep forces emerging on the contact when the wheelset’s yaw angle is zero, obtaining a theoretical value of the L/V limit greater than Nadal’s limit. • Correction of the limit obtained for the case where ψ = 0, based on the lateral creepage value emerging with yaw angles other than zero.
J. Santamaria et al.
11
4. Derailment coefficient for the case of a zero yaw angle Figure 8 shows the situation of a wheel in contact with the flange when the wheelset’s yaw angle is zero. There are many theories to calculate creep forces on the basis of creepage [17,22-25], and these are distinguished in particular by the level of accuracy obtained and computational effort. Normally these two objectives are counterpoised.
L
V
Τφ
Ω=
V ro
V sin δ ro
N
ΤL
δ
Figure 8. Forces on the wheel in a derailment situation, when the wheelset’s yaw angle is zero. The figure shows the two components of lateral force Ty and the wheelset rotation vector Ω.
Kalker’s linear theory [26], for instance, considers longitudinal force Tx and lateral force Ty in accordance with the following expressions: Tx = −(G a b C11 ) ν x
(22)
T y = −(G a b C 22 ) ν y − (G a b a b C 23 ) φ
(23)
where νx, νy and φ are longitudinal, lateral and spin creepage, G is the shear modulus, a and b are the semi-axes of the contact ellipse, and Cii the creep coefficients. Kalker’s linear theory is only true when creepages are very low. In the moments prior to derailment, when contact moves to a position over the wheel flange, obviously this condition is not fulfilled, and these expressions are not valid. However, Kalker’s linear equations may be used to demonstrate a behaviour pattern which is maintained when creepages become larger: while longitudinal force depends only on longitudinal creepage, lateral force depends on both spin and lateral creepage. Moreover, each force is uncoupled with respect to creepages of the other force, and the only mutual influence which may be exerted is in a saturation situation, when an increase in one force must necessarily lead to a reduction in the other to maintain Coulomb’s limit. Although in cases where creepage is great Ty can no longer be considered as a mere sum between two terms as in (23), its global value may be decomposed into two virtual components to represent the influence of both νy and φ. Denoting TL as the Ty component
12
Influence of creep forces on the risk of derailment coefficient
supposedly created by νy, and Tφ the component created by φ, figure 8 shows these forces acting on the wheel. If the yaw angle is zero, the only lateral creepage νy which can emerge on the wheel is that produced by lateral sliding of the wheel on the rail, when the wheelset is moving in a lateral direction. If it is assumed that the wheel is derailing, this sliding is in the upward direction, thereby creating a descending force TL to oppose derailment. The most unfavourable situation is therefore considering that this lateral creepage νy does not exist or, which comes to the same thing, that the wheel is commencing derailment. In a worst-case scenario, the only tangential force which ought to be considered for derailment is the lateral force created by spin, Tφ. When wheel-rail contact is on the flange, the spin is considerable due to the contact angle. Spin creepage is calculated as the angular velocity of the wheel in normal direction to the contact divided by the nominal velocity of the vehicle V. Due to the inclination of the flange, there is a large component of wheelset rotation velocity Ω on the normal direction to contact, as figure 8 shows. Denoting ro as the wheel’s nominal rolling radius, rotation velocity may be annotated as Ω = V/ro. The Ω component normal to the contact plane is divided by forward velocity V to obtain spin creepage:
φ=
−V
ro V
sin δ
=−
sin δ ro
(24)
As may be observed, spin is independent of the vehicle’s speed, and depends only on the contact angle and the wheel’s nominal rolling radius. Its negative direction along axis z’ creates a lateral force Tφ in the positive direction y’, as shown in figure 8. The objective to be considered now is to determine the maximum value of lateral force Tφ, since under normal conditions it will not be as high as the Coulomb limit sustained by Nadal, and so the derailment limit may be increased. To study maximum creepage forces and generalise the results, normalised creepage values are used in accordance with the following expressions: abG C11 ⋅ν x 3µN abG ν y '= − C 22 ⋅ν y 3µN abG φ'= − abC 23 ⋅ φ µN
ν x '= −
(25) (26) (27)
The contact forces are also normalised with respect to their maximum value: fx =
Tx µN
fy =
Ty
µN
Thus the expressions in Kalker’s linear theory (equations 22 and 23) now become:
(28)
J. Santamaria et al.
13 fx =
fy =
Tx = 3ν x ' µN
Ty
µN
= 3ν y '+φ '
(29) (30)
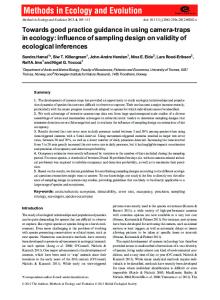
thereby obtaining a relationship independent of the contact parameters. For computation of tangential forces in this paper the FASTSIM subroutine was used [27], which obtains more accurate results than other theories. The subroutine discretises the contact ellipse in rectangular cells, and the resultant forces are obtained as the sum of those emerging in each cell – to this end, it is first determined whether the cell is in an adherence zone or a slide zone. In this paper the contact ellipses were discretised in 100 x 100 cells for accurate results. The utilisation of FASTSIM assumes that contact between wheel and rail is hertzian, and that therefore the area of contact between wheel and rail is an ellipse. Although that is not true when the wheel makes contact with the rail in an intermediate zone between the thread and the flange, since it is a conformal contact, it is considered sufficiently approximate for the case of contact with the flange (non-conformal contact), which is the case arising from a study of derailment. Hertzian theory is based on certain hypothesis that are never completely fulfilled in the case of wheel-rail contact, but it is well known that provides good results in railway dynamics when the wheel-rail contact is non-conformal (the size of the contact ellipse is much smaller than the radii of curvature of the bodies), and when the geometry of the profiles vary in a smooth way near the contact area [17,25]. That is the reason (besides the low computational cost) why Hertz's theory is so widely used in railway dynamics [28-31]. There are some situations in which this assumptions are no longer valid, for example when the contact occurs in the transition between the wheel thread and the flange (conformal contact), or, in the case of certain profiles, even when then contact point is located on the wheel thread, like is the case of the ORE-S1002 wheel and UIC-60 rail [32]. The geometry of the profiles can't be considered quadratic functions near the contact point in this case, and the real contact area is not an ellipse. A contact patch with a shape similar to an “8" appears, with two maximum normal stresses in different locations [32]. More advanced theories have been developed trying to solve all of these cases. Actually, when analysing the forces in the moments prior to derailment, the contact point is located on the wheel’s flange. In this situation, and taking into account the curvatures of the bodies mentioned before, the size of the contact area is smaller than the radii of curvature of the bodies in each principal direction. In addition, on the wheel’s flange there are not substantial changes of the profile geometry (it is a linear section). Therefore, the profiles can be approximated by quadratic functions near the contact area, and the curvatures remain constant along the contact patch. That is the reason why it can be considered that the contact area in the moments prior to derailment is an ellipse, according to the Hertz’s theory. Figure 9 shows how the normalised lateral tangential force fy varies in accordance with normalised spin φ’. Since, when spin is considered, the eccentricity of the contact ellipse exerts its influence on the result, figure 9 shows a number of curves, each of which represents different eccentricities of the contact ellipse. Ellipse eccentricity is defined as the quotient between its longitudinal and lateral semi-axes: σ = a/b. Zero creepages in the longitudinal and lateral directions were considered to obtain these graphs.
14
Influence of creep forces on the risk of derailment coefficient
1 0.9 0.8
a/b=9.4
0.7
a/b=18.7
fy
0.6 0.5
a/b=3.8
0.4 0.3
a/b=1
0.2 0.1 0
0
1
2
3
4
5
φ'
6
7
8
9
10
Figure 9. Non-dimensional lateral force fy in relation to normalised spin for 4 different eccentricities of the contact ellipse. A circle marks a typical point in rail dynamics.
The first thing observed in figure 9 is that force fy obtains a maximum value when φ’ equals 1, and subsequently decreases for greater values of φ’. This is because when spin is low, all or a large part of the contact ellipse is an adherence zone, and the lateral forces created by spin are orientated in the same direction [17,26]. With more spin, part of the contact ellipse is a slide zone, and stresses at these points are saturated. The upshot of this is that there is a zone to the rear of the ellipse where lateral stress emerge in opposition to the stress at the front of the zone, reducing the overall resultant force. The greater the spin and the slide zone, the greater this reduction. The value φ’ = 1 is, in fact, that which creates lateral stress close to saturation at all points on the ellipse’s central longitudinal line. If only these points are considered ( a / b → ∞ ), the lateral force obtained with φ’ = 1 is the maximum permitted by Coulomb’s law (fy = 1). However, as the ellipse becomes less eccentric, stresses also emerge in the longitudinal direction due to spin, and these reduce lateral stresses in slide zones. This reduction explains the fact that, for eccentricity values which are not so high, lateral force does not reach the maximum value established by Coulomb. Since, therefore, this maximum value is considerably less than 1 for small eccentricities, one may consider the possibility of establishing this value as an upper limit for the lateral tangential force in computation of the derailment coefficient. Unfortunately when contact appears on the wheel flange, the contact ellipse which emerges has substantial eccentricity. That is why the upper value of force fy cannot be efficiently set using this procedure, since the maximum values for the curves showing high eccentricities are close to 1 (indicating complete saturation). A wheel of nominal rolling radius 425 mm and a rail head with corner radius 13 mm may be considered (both these values are common in rail dynamics). The curvature of the rail in the longitudinal direction is zero, as is the curvature of the wheel in the transversal direction (the flange corresponds to a straight section of the profile). Also, the wheel’s curvature
J. Santamaria et al.
15
radius must be corrected by dividing it by the cosine of the contact angle δ, in order to obtain the main radius of curvature in accordance with the orientation of the flange (figure 10). Thus, taking a flange angle of 70º (another typical value), the wheel’s curvature radius in the longitudinal direction is 425 mm / cos 70º = 1,243 mm at the contact point (disregarding the small increase in rolling radius when the contact point is located on the flange, with respect to the nominal radius), while that of the rail in the transversal direction is 13 mm. This considerable difference in curvatures means that, according to Hertz’s theory, the contact ellipse is substantially prolonged in the longitudinal direction. Specifically, using these data the value of σ in this case is 18.7.
r r / cos δ
δ
rrail = 13 mm
Figure 10. Radii of curvature of the rail and the wheel when flange contact occurs.
Moreover, the value of spin calculated by means of equation (24) with ro = 0.425 and δ = 70º is 2.21. Normalising this in accordance with expression (27), a spin φ’ of 9.29 is finally obtained (taking µ = 0.3, G = 82 x 109 N/m2, and Poisson coefficient 0.28). This value for φ’ and its corresponding force fy (0.41) are represented by a circle in figure 9. As may be observed, the value of the resultant force is considerably lower than 1. This means that the lateral force cannot reach full saturation, and so the derailment limit will be greater than that predicted by Nadal. Taking the data from this example, assuming a value of fy = Ty/µN = 0.41 in equation (3) the following is obtained: L tan δ − 0.41µ = V 1 + 0.41µ tan δ
(31)
which, with δ = 70º and µ = 0.3, provides a limit value of 1.96, as against the original 1.34 in accordance with expression (5). This theoretical value obtained for a typical rail vehicle case and zero yaw angle provides a good match with experimental data [5]. The next step is to generalise this limit value of fy, in such a way that it cannot be exceeded whatever the characteristics of the vehicle and the track. Figure 9 shows that, in the case of great eccentricities of the contact ellipse, the curve tends to converge towards a higher limit value. Since the most unfavourable situation corresponds to the highest value of fy, the reference curve taken is that corresponding to eccentricity of σ = 600, assuming it is a value which is sufficiently large not to produce variations with greater eccentricities. In fact, the differences with respect to the curves for σ
16
Influence of creep forces on the risk of derailment coefficient
= 18.7 and σ = 9.4 are very small. Figure 11 shows this limit curve providing the maximum value of fy in relation to φ’. 1 0.9 0.8 0.7
fy
0.6 0.5 0.4 0.3 0.2 0.1 0
0
1
2
3
4
5
6
φ'
7
8
9
10
Figure 11. Normalised lateral force in relation to normalised spin, for eccentricity of contact ellipse σ = 600.
When the limit curve has been defined, the objective is to set the value of normalised spin φ’. Figure 11 shows that, for values of φ’ greater than 1, the most unfavourable situations arise when spin is minimum, since this is close to the curve maximum. Thus the task consists of determining the minimum value which φ’ may reach in accordance with the characteristics of the vehicle. According to expression (27), and introducing the value of spin as per (24), this value depends on:
φ'=
ab abC 23G sin δ ro µN
(32)
According to Hertz’s theory, the contact ellipse’s semi-axes a and b are proportional to N , and so the value of φ’ is independent of the normal force N. The quotient: 1/3
L = ab ab
N
(33)
depends only on the eccentricity of the contact ellipse, the curvatures of the bodies in contact, and the proportionality constant (function of the material’s elasticity constants). Since the eccentricity of the ellipse also depends on the curvatures of bodies in contact, this dependency may be exclusively reduced to the curvatures of the bodies. Furthermore, as set out in this section, in the case of flange contact there are only two non-zero curvatures, one of which corresponds to the corner of the rail, and this may be considered a constant in the study, equal to 0.013-1 m-1. This value is independent of the rail inclination. It is possible that, due to wear, this curvature will eventually be lower than the
J. Santamaria et al.
17
nominal value, but in this case the situation it would lead to would be less unfavourable since the eccentricity of the ellipse would also decrease. To sum up, the quotient L depends only on the curvature radius of the wheel at the flange, which in turn depends on the rolling radius of the wheel ro and the contact angle δ. The Kalker coefficient C23 varies with the eccentricity of the contact ellipse which, as has been observed, in this case only depends on ro and δ. Thus there are only 3 vehicle parameters which could effect changes in the value of φ’: δ, ro and µ. When expression (32) is rewritten, the following is obtained:
φ'=
K (δ , ro )
(34)
µ
It is obvious that a high friction coefficient leads to lower normalised spins, increasing the risk of derailment. With respect to the other two parameters, higher values of the flange angle δ clearly have favourable repercussions, since they increase the value of φ’. For one thing, the term sinδ is greater, and they also bring about an increase in the wheel’s curvature radius, and therefore in the eccentricity of the ellipse. Bearing in mind that the term C23 increases with this eccentricity, δ also increases φ’ through this term. With respect to the influence of value ro, its repercussion is not quite so clear since it creates opposing effects. It increases the wheel’s curvature radius, and thus the eccentricity of the ellipse and the term C23. It also reduces spin, since ro emerges in the denominator of equation (32). Figure 12 represents the value of the K(δ,ro) coefficient in relation to the rolling radius ro, for different flange angles δ. The influence of the wheel’s rolling radius on normalised spin is relatively minor in comparison to δ or µ. Figure 12 shows that the variation of coefficient K with ro is low, but very significant with δ. 7
δ = 80º
6
5
K
4
3
δ = 70º
2
δ = 60º
1
0
δ = 50º 0
0.2
0.4
0.6
0.8
1
1.2
r o (m)
1.4
1.6
Figure 12. Values of coefficient K in relation to ro, for different flange angles δ.
1.8
2
18
Influence of creep forces on the risk of derailment coefficient
Table1. Minimum values of coefficient K for different flange angles, considering a range of rolling radii ro 0.05 m to 2 m.
δ Kmin
45º 0.8502
50º 1.0029
55º 1.2321
60º 1.5112
65º 1.8682
70º 2.3836
75º 3.3489
80º 5.1085
85º 10.2867
Since lower values of φ’ are the most unfavourable and since coefficient K shows little variation with ro, the procedure is to take the minimum value of coefficient K for the entire range of possible rolling radii for the wheel. This makes the coefficient independent of ro, erring on the side of safety, with no excessive penalisation of the derailment coefficient (since this coefficient is relatively constant with ro). The range of rolling radii considered was ro = 0.05 m to ro = 2 m, in order to cover all the possible values in rail dynamics. Table 1 shows the results of these minimum K coefficients. A new coefficient K1 is defined with these minimum values of K, in such a way that it is independent of the value of ro. Equation (34) may be drawn up as follows:
φ'=
K 1 (δ )
(35)
µ
It should be noted that in this formulation the only parameters involved in the problem are the flange angle δ and the friction coefficient µ, the same parameters as Nadal’s criterion. As an alternative to table 1, equation (36) may be used to obtain coefficient K1 (where δ is entered in degrees). Equation (36) was calculated by fitting a double exponential expression to the data in table 1 using least squares. Figure 13 represents the fit. K1 = 2.55 ⋅ 10 −9 e0.254 δ + 0.1293 e0.041 δ
(36)
12 K1 obtained with FASTSIM Exponential fit 10
K1
8
6
4
2
0 45
50
55
60
65
70
δ (º )
75
80
85
Figure 13. The coefficient K1 in relation to flange angle δ, calculated using FASTSIM. The unbroken line represents the exponential fit according to equation (36).
J. Santamaria et al.
19
Once the value of φ’ is known, equation (37) is used to find the approximate value of fy:
f y = 0.31 + (0.9 − 0.3) e −0.2(φ ' −1)
(37)
Equation (37) has been obtained by fitting an exponential expression to the data in figure 11. Finally, the limit value of the (L/V) quotient is obtained by adding the value of fy obtained through equation (37) to equation (3): tan δ − f y µ L = V 1 + f y µ tan δ
(38)
5. Derailment coefficient for the general case of a non-zero yaw angle 5.1 Calculating normalised lateral forces When the wheelset is rotated at yaw angle ψ with respect to the direction of the track, lateral creepage νy appears at the wheel/rail contact point. This creepage is due to the forward movement of the wheelset which, since it runs along the track, forms an angle ψ with respect to the wheelset’s xw axis, and therefore with respect to the wheel plane (figure 2). The lateral force TL produced by νy has a positive orientation with respect to the y’ axis, and so this is unfavourable in terms of derailment. 1
νy' = 3
0.9 0.8
fy
0.7 0.6 0.5
νy' = 0
0.4 0.3 0.2 0.1 0
0
2
4
6
φ'
8
10
12
Figure 14. Normalised lateral force in relation to normalised spin for different values of normalised lateral creepage, where σ = 600 and νx = 0. Circles show the forces for normalised spin 9.33, a typical value in rail dynamics.
Figure 14 represents the normalised tangential force fy in relation to normalised spin creepage φ’, for different values of normalised lateral creepage νy’. Unlike the case of
20
Influence of creep forces on the risk of derailment coefficient
normalised spin, the relationship between fy and νy’ is univocal when the other creepages are zero. In other words, there is only one curve which relates fy to νy’ when νx = 0 and φ = 0, with no dependence on the eccentricity of the ellipse or any other parameter. To obtain the curves shown in figure 14, the most unfavourable case was considered in terms of eccentricity of the contact ellipse (σ = 600), and zero longitudinal creepage (νx = 0). As lateral creepage νy’ increases, lateral force fy also increases. The initial value, i.e. the lowest curve νy’ = 0, corresponds to that obtained in the previous section, when the yaw angle is zero. It is thus important to correct this initial value, and increase it in relation to the lateral creepage νy’ present at contact. Figure 15 shows the increase in normalised lateral force fy in relation to normalised lateral creepage νy’, for different values of normalised spin creepage φ’. The initial point on each curve is the value of fy calculated in the previous section for the case ψ = 0. 1.1
φ '= 2 1 0.9
fy
0.8 0.7 0.6 0.5
φ '= 12
0.4 0.3
0
0.5
1
1.5
ν y'
2
2.5
3
Figure 15. Normalised lateral force fy in relation to normalised lateral creepage νy’, for different values of normalised spin creepage φ’ between 2 and 12.
As figure 15 shows, the lower the value of normalised spin φ’, the greater the initial value of force fy and the greater its increase with lateral creepage νy’. It is also observed that the curves increase asymptotically up to the limit value of 1. The value of lateral force fy corresponding to zero lateral creepage νy’ is denoted as fyo obtained in the previous section. Figure 15 corrects this value fyo in relation to lateral creepage νy’. Alternatively, equation (39) may be used, which provides this value in consideration of the value of spin φ’ and lateral creepage νy’. To obtain equation (39), each curve in figure 15 has been approximated by two straight lines. The first straight line has the same slope (m) as the original curve at its initial point. The second represents saturation, and so it is horizontal with fy = 1. As figure 15 shows, the initial section of each curve is comparable to a straight line, and the error incurred with intermediate creepages is low and always on the side of safety, since the straight line provides higher values for lateral force fy than the original
J. Santamaria et al.
21
curve. In addition, taking into account that fy value needs to be evaluated in each integration step or measurement point, this linear approximation provides a very efficient equation in terms of computational cost.
f y = f yo + m ν y '
fy ≤1
(39)
m = 0.07 + (0.4753 − 0.07) e −0.22 (φ '−2)
The expression of slope m in (39) was obtained by using an exponential function to fit the values of initial gradients m in relation to normalised spin φ’. Figure 15 shows how these initial gradients decrease as φ’ increases. Figure 16 represents these slopes in relation to spin φ’, and compares them to the fitting obtained with equation (39). The criterion followed was an attempt to properly fit the interval of spins from 2 to 25, the most commonly used in railway dynamics but assuring at the same time that for any value of the normalized spin, the result of the approximation is conservative, higher than the result obtained with FASTSIM. The kind of approximation that best achieves both goals is an exponential equation as (39), where the function descends asymptotically to a lowest limit (0.07 in this case) but always above the values corresponding to the highest normalized spins. As it can be seen in figure 16, the fitting is excellent for common spin values, and on the safe side for greater spin values. The criterion of considering only spins greater than 2 was also employed. As seen in the previous section, it is extremely improbable that spin will ever be so low, and since for these spin values one is considering an initial value of fyo in such close proximity to 1, it is not worthwhile correcting it. The assumption in these limit cases is that force fy is totally saturated. Figure 17 compares the results obtained from the straight-line approximation in equation (39) with respect to the original curves. The greatest differences emerge for small normalised φ’ values when force fy approaches saturation. 0.5
0.4
m
0.3
0.2
Aproximate 0.1
Data 0
0
5
10
15
20
φ'
25
30
35
40
Figure 16. Initial slopes for curves fy – vy’ in figure 15 in relation to normalised spin φ’(broken line). The figure also shows fitting of m in accordance with expression (39) (unbroken line).
22
Influence of creep forces on the risk of derailment coefficient
Here it is important to point out that calculation of the slope in accordance with expression (39) need only be carried out once, at the beginning of experimental measurements or dynamic simulation. As explained in the previous section, the value of φ’ required to calculate fyo and m (equation 39) depends only on flange angle δ and the friction coefficient µ. Both these data are established at the commencement of the process, and so both φ’ and fyo are known from the outset. To calculate fy at a given moment while the vehicle is in motion, only the straight-line equation shown in the first equation in (39) is needed. The most costly operation in expression (39) in terms of computation time is the calculation of slope m. However, as said before, this calculation is performed only once, and it is not necessary to repeat the calculation while the vehicle is in motion. 1.1
1
0.9
φ' = 2
fy
0.8
0.7
φ' = 7
0.6
0.5
φ ' = 12 0.4
0
0.5
1
1.5
ν y'
2
2.5
3
Figure 17. Approximation of fy curves in relation to νy’ (unbroken lines) by straight lines (broken lines). The graph shows three specific cases of normalised spin creepage φ’.
5.2 Calculating normalised lateral creepage Once maximum lateral force fy, modified in accordance with normalised lateral creepage
νy’, has been obtained, the last step is to obtain lateral creepage νy’ in relation to the wheelset’s yaw angle. Lateral creepage νy appearing in contact at a certain time depends on many factors, such as the vehicle’s velocity, position of the contact point, the wheelset’s lateral velocity and, of course, the yaw angle. When considering the derailment situation, two hypotheses are assumed which simplify the calculation of creepage in this limit situation: • Contact is on the wheel flange. • The wheelset does not have lateral velocity. When the wheel is derailing, the wheelset’s lateral velocity causes creep in opposition to derailment, and so it is considered that the
J. Santamaria et al.
23
most unfavourable situation is that in which the wheelset’s lateral velocity is zero (quasistatic equilibrium of forces). Under these conditions (contact on the flange and quasi-static wheelset equilibrium), and assuming that the yaw angle is known, it is possible to determine lateral creepage and the contact point’s forward position with respect to the wheel’s vertical diametral section. In the case of a conical wheel profile, the contact point’s forward position, represented by angle ξ in figure 5, may be determined theoretically by imposing the tangency of the wheel and rail surfaces on contact. This angle ξ depends only on the cone angle δ and the yaw angle ψ, and can be calculated by the following equation: sin ξ = tan δ tanψ
(40)
A real wheel profile is obviously a long way from being perfectly conical. When a real vehicle is actually moving, or during a computer simulation, in general one cannot predict the longitudinal position of the contact point based on the contact angle [33], and it is necessary to conduct a detailed 3D geometric analysis of the profiles involved. However, in the moments prior to derailment, or while derailment is occurring, it is known that the contact point is located on the wheel flange. The flange constitutes a perfectly conical section of the wheel. All wheel profiles have a linear section that constitutes the inside face of the flange. This linear section usually has a great inclination (60º-70º) in order to avoid the derailment of the wheel. If the contact occurs in this section, as is the case in the moments prior to derailment, one can predict the location of the contact point in the longitudinal direction using tangency conditions. The rest of the geometry of the wheel profile doesn’t cause any influence if the contact point is located on the flange. In the case of a worn wheel, the linear section of the profile could disappear due to wear. The most unfavourable situation for this case is to consider the maximum contact angle of the wheel profile, since this produces the maximum forward separation of the contact point in longitudinal direction, and therefore, a higher lateral creepage. With respect to the value of lateral creepage νy, the calculation is performed in due consideration of the new forward position of the contact point due to the conicity of the flange. In quasi-static conditions, and on a conical surface area, this value is calculated in accordance with expression (41):
νy =
sinψ cos δ
(41)
where it must be observed that this creepage is considered in the contact reference system. Other researchers [3] use a more complex expression to calculate lateral creepage, in due consideration of the contact point’s forward position. If expression (40) is used to obtain this position, both formulations are equivalent for small yaw angles. In accordance with equation (26), by introducing expression (41) normalised lateral creepage νy’ may be considered as:
ν y '=
G abC 22 1 1 ⋅ ⋅ ⋅ 1 ⋅ sinψ 2 3 N 3 cos δ µ N 3
(42)
24
Influence of creep forces on the risk of derailment coefficient
As may be observed, creepage logically depends on the yaw angle ψ, where the relation is linear for small angles (as is almost always the case in rail dynamics). It also depends, as in Nadal’s limit and the calculation of fyo, on flange angle δ and friction coefficient µ, the two main parameters involved in calculating the risk of derailment. abC 22 The term does not depend on normal force since, as stated, the contact ellipse’s 2 3 N semi-axes (a and b) vary with N1/3. This term depends on the eccentricity of the ellipse, which in turn depends on the curvature radii of the contact surfaces, the influence of which may be reduced, as observed in the previous section, to ro and δ. The coefficient representing this term is denoted as C1, and it is defined by the following equation: C1 =
G abC 22 1 3 N 2 3 cos δ
(43)
in such a way that normalised lateral creepage νy’, in due consideration of equation (42), is now considered as follows:
ν y ' = C1 (ro , δ )
1
⋅
1
µ N 13
⋅ sinψ
(44)
Finally, and perhaps most importantly, normalised lateral creepage νy’ depends on the normal force in contact N, which was not the case for calculation of normalised spin φ’. As observed in equation (44), normal force emerges in the denominator to the power (1/3), and so the value of νy’ is not actually bounded. If normal force N tends towards zero, because the wheel is undergoing dynamic discharge when the vehicle is in motion, for instance, creepage νy’ will tend towards infinity, for any non-zero yaw angle. This means that lateral force fy will be completely saturated, and the derailment limit will be the same as Nadal’s limit. In practice, with non-zero normal forces, what happens is that the value of this normal force exerts a great influence on the speed with which the lateral force fy becomes saturated as the yaw angle becomes larger. Small normal forces lead to saturation of the lateral force with smaller yaw angles, and so from the point of view of derailment risk this is unfavourable. Once normalised lateral creepage in relation to all the parameters affecting the problem has been established in equation (44), the only task remaining is to determine the value of coefficient C1. Figure 18 represents the value of coefficient C1 in relation to the nominal rolling radius ro, for certain values of flange angle δ. To obtain these curves, G = 82 MPa has been considered, a curvature radius for the rail head in the transversal direction of 0.013 m, and ro/cos δ as the curvature radius for the wheel in the longitudinal direction (the remaining curvatures are zero). The curves shown in figure 18 are quite rectilinear, although with a certain amount of convexity. Also, as may be observed in this figure, the higher slopes correspond to curves providing higher values of coefficient C1. The ratio between slopes and C1 values remains relatively constant for the various flange angles. In order to obtain the best results for values of the parameters most characteristic of rail dynamics, adjustment of the curves in figure 18 is carried out considering the range of ro rolling radii between 0.2 and 0.7 metres. Figure 19
J. Santamaria et al.
25
shows coefficient C1 for this new range of values, where it may be observed that the curves are practically straight sections. 4
8
x 10
7
δ = 80º
C1
6 5 4 3
δ = 70º 2
δ = 60º
1 0
δ = 50º 0
0.2
0.4
0.6
0.8
1
1.2
r o (m)
1.4
1.6
1.8
2
Figure 18. Coefficient C1 in relation to nominal rolling radius ro, for different values of flange angle δ. 4
4
x 10
3.5
δ = 80º
3
C1
2.5 2 1.5
δ = 70º
1
δ = 60º
0.5
δ = 50º 0 0.2
0.25
0.3
0.35
0.4
0.45
0.5
0.55
0.6
0.65
0.7
r o (m) Figure 19. Values of coefficient C1 over the range of rolling radii between 0.2 m and 0.7 m, for 4 different values of flange angle. The broken lines show the fit obtained using rectilinear approximation.
The first and last values of the curves in figure 19 are used to calculate the gradients of the straight-line approximations. Thus, since this covers a more or less broad range of ro
26
Influence of creep forces on the risk of derailment coefficient
values, singularities are avoided and smoother results are produced. With a flange angle δ, the gradient of the corresponding curve is calculated as follows: mabs =
C1 ( r0 =0.7 ) − C1 ( r0 =0.2)
(45)
0.7 - 0.2
If this slope is divided by a specific value for the C1 coefficient on the actual curve, a relative slope mrel is obtained. The reason this relative slope is used is that, as will be observed below, its value remains relatively constant for the range of δ flange angles studied. The C1 coefficient for a rolling radius ro = 0.45 m is taken as the reference value. It is used to calculate the relative slope mrel and also to positionate the straight-line approximation, since it is a very common value for railway vehicles. Thus the relative slope mrel is defined as: mrel =
mabs C1
(46)
(ro = 0 .45 )
Figure 20 represents this value of the relative slope mrel for δ flange angle values between 50º and 80º. As may be observed, the value remains relatively constant within this zone. Maximum variation occurs between maximum value mrel = 1.39 and minimum value mrel = 1.24 for flange angles δ = 50º and δ = 66º respectively. If the mean value of the two is considered (mrel = 1.31) as the relative slope’s common value for the various flange angles, the maximum error incurred within the ranges studied is extremely small (around 1%).
1.4
1.2
m rel
1
0.8
0.6
0.4
0.2
0 50
55
60
65
δ (º)
70
75
80
Figure 20. Value of relative gradient mrel in relation to flange angle δ.
Therefore the curve fit in figure 19 is carried out using rectilinear lines with relative slope mrel = 1.31, placed at the point C1 (ro=0.45):
J. Santamaria et al.
27 C1 = C1
(ro = 0 .45 )
[1 + 1.31 (ro − 0.45)]
(47)
The value of C1 (ro=0.45) in relation to flange angle δ still has to be determined. Figure 21 shows this function, and also the exponential fit obtained using least squares according to expression (48), where the flange angle δ is in degrees.
C1 (ro = 0.45 ) = 1.35 ⋅ 10−5 e0.26 δ + 432 e0.0434 δ
(48)
In this way, once coefficient C1 (ro=0.45) has been obtained, a fit may be performed for the curves in figure 19 by rectilinear lines through equation (47). Figure 19 shows the fit result following the method described, in broken lines, for each of the 4 curves. Finally, calculation of creepage is reduced to the following:
ν y ' = (1.35 ⋅ 10− 5 e0.26 δ + 432 e0.0434 δ )
[1 + 1.31 (ro − 0.45)] sinψ 13 N
µ
(49)
Again it must be borne in mind that, with the exception of the last term of equation (49), the flange angle δ, the rolling radius ro and the friction coefficient µ are known at the commencement of analysis, and so it is only necessary to calculate the first part of the equation once. 4
3
x 10
(ro=0.45)
2
C1
2.5
1.5
1
0.5
0 50
55
60
65
δ (º)
70
75
80
Figure 21. Coefficient C1 for a rolling radius ro = 0.45 m, for the various flange angles δ.
5.3 Calculating lateral creepage for the case of negative yaw angles In the previous section, the case of a positive yaw angle has been studied. This situation is the most unfavourable in terms of risk of derailment. For that reason, derailment criteria
28
Influence of creep forces on the risk of derailment coefficient
including the influence of the yaw angle usualy focus on positive values of that angle. Results obtained for negative yaw angles are less critical, because the risk of derailment is always low under that circumstances. Therefore, all the coefficients obtained in the previous section have been calculated using positive values of the lateral creepage (corresponding to positive yaw angles). Nevertheless, these results can be easily extended to negative values of such creepages. The only thing that must be done is to consider the variation of the lateral force fy as a function of the lateral creepage νy’ (shown in figure 15) also for negative values of νy’. The goal is to fit the curves shown in figure 15 also for the negative values of νy’, in the same way equation (39) does for the positive values. In this way, one can reduce the lateral force fy when νy’ is negative, but always trying to obtain fitted values of fy higher than the real ones, this is, on the side of safety. Figure 22 shows two of the curves of figure 15 for negative values of νy’. It also shows the rectilinear fit obtained with equation (39). As can be observed, when the spin creepage is high, the curve is almost a straight line. The equation (39) provides a good match also for negative values of νy’ in this case. When the spin creepage is lower, the curves are not so rectilinear, although there is a central section near νy’ = 0 that can be considered as a straight line. 1
0.5
fy
φ ' = 12 0
-0.5
φ' = 2
-1 -5
-4
-3
ν y'
-2
-1
0
Figure 22. Approximation of fy curves in relation to νy’ (unbroken lines) by straight lines of equation (36) (broken lines). The graph shows two specific cases of normalised spin creepage φ’.
If equation (39) is used to approximate the curves of figure 15 also for negative values of lateral creepage νy’, the lateral force fy obtained is always higher than the one obtained with FASTSIM. In addition, it provides a very good match for high values of spin creepage, the usual situation in the case of derailment of railway vehicles. For lower values of spin creepage, equation (39) leads to more conservative values of the derailment limit, but nevertheless the result is a derailment limit higher than that obtained for a zero yaw angle, as was intended. Therefore, equation (39) can be used for negative values of νy’ , taking into account that the negative limit of fy is -1.
J. Santamaria et al.
29
5.4 Summary of the method The following are the equations to be applied to obtain the limit of (L/V) using the methodology expressed in the previous sections (table 2). It is also possible to include the favourable effect of a possible longitudinal creep force in the derailment limit obtained using this new formulation, as shown in section 3. If one disregards the influence of yaw angle ψ and the forward position of the contact point represented by angle ξ on the geometry of the problem, a final equation is obtained similar to that in table 2, substituting the term fy for ty in the expression of (L/V)lim. The difference is that, as considered in section 3, lateral force would be restricted here only by Coulomb’s limit, along with possible longitudinal creep force. If this force did not exist, the lateral force would be the maximum permitted by Coulomb (fy = 1), and this is not always true, as has been shown. Table 2. Summary of the equations.
Coefficients calculated only once.
φ'=
2.55 ⋅10 −9 e0.254 δ + 0.1293 e0.041 δ
µ
φ' >1
f yo = 0.31 + 0.6 e −0.2 (φ '−1) C = (1.35 ⋅10−5 e0.26 δ + 432 e0.0434 δ )
[1 + 1.31 (ro − 0.45)] µ
m = 0.07 + 0.4053 e −0.22(φ '−2)
Coefficients calculated at each measurement point, as a function of ψ and N.
f y = f yo + m ⋅ C ⋅
sinψ N 1/3
-1 ≤ f y ≤ 1
tan δ − f y µ L = V lim 1 + f y µ tan δ
Initially considering the possibility that fy may not be saturated (i.e., fy < 1), an increase in longitudinal force (bringing about an increase in tx) would not initially cause a reduction in lateral force fy, since the resultant force would not be saturated. It is as of a certain value of tx that the resultant force becomes saturated, and fy begins to fall. Logically, for tx values above that limit, the lateral force fy = ty (considering equation 15) is smaller than the one obtained with table 2. Thus the expression to be used is shown in equation (50): tan δ − f y′µ L = V lim 1 + f y′µ tan δ
sinψ f y′ = min f yo + m ⋅ C ⋅ 1/3 , N
2 1− tx ≤ 1
(50)
30
Influence of creep forces on the risk of derailment coefficient
In relation to the geometric influence of angles ψ and ξ, disregarded in expression (50) and in the equations in table 2, on observation of figure 6 it may be concluded that it serves no purpose to consider the influence of the yaw angle ψ, since the differences obtained are minimum. Nor does angle ξ have much influence, as shown by figure 7. Considering a flange angle δ = 70º, a yaw angle ψ = 4º (a value which is not usually exceeded in rail dynamics), and equation (40), one finds ξ = 11º. Even so, this influence could be appreciable if tx is a high value close to 1. This influence may be included in equation (50) by merely using formula (21) to calculate (L/V)lim, substituting coefficient ty for f’y, defined in equation (50). 6. Discussion of results As has been observed, the main parameters influencing the derailment limit are the flange angle δ, the friction coefficient µ, the nominal rolling radius of the wheel ro, the wheelset yaw angle ψ, and the normal force on contact N. Of these 5 parameters, the first 3 are known at the commencement of analysis, while the values of the yaw angle and normal force change as the vehicle moves along the track. This is why it is necessary to include these values and update the derailment limit at each measurement point, or at each step of integration. The negative influence of the yaw angle on the derailment limit is well known. It is also well known that dynamic reductions of the vertical load on the wheel are extremely unfavourable in terms of derailment, since they cause a reduction in normal force and therefore an increase in the coefficient (L/V) [3,13]. In fact, a reduction in normal force is specially harmful since not only does it increase the value of the coefficient (L/V), but simultaneously reduces the permissible limit (L/V)lim. This is because, with low normal forces, lateral creepage saturates rapidly, even when the wheelset’s yaw angles are small. These results agree with some experimental measurements where it is shown that light vehicles are more likely to derail. Some of the results obtained for the derailment limit (L/V)lim for a number of wheel characteristics are set out below, with exclusive application of the equations in table 2. All the graphs show the limit value of the (L/V) quotient in relation to the yaw angle, comparing the results obtained for several normal forces. Broken lines show the limit established with Nadal’s equation (which is independent of the yaw angle). In the light of the results shown in figure 23, it may be observed that the fall in the (L/V) quotient as the yaw angle increases is practically linear in all cases. It may likewise be observed how the nominal rolling radius ro exerts an influence on the results which cannot be considered as negligible. A high value of ro leads to a sharper fall in (L/V)lim with the yaw angle, and this is unfavourable in terms of derailment. This negative influence of the wheel’s nominal radius was observed in Parena’s work [34], that was based on dynamic simulations of a single wheelset, although the cause of this behaviour was not studied. On the other hand, as deduced in section 4, the initial value of (L/V)lim with a zero yaw angle is independent of ro. Finally, analysis of the graphs in figure 23 allows one to determine that the parameters exerting a negative influence on the derailment limit according to Nadal’s theory are actually twice as harmful, since they cause a sharper fall in the limit with the yaw angle. It can be observed how, when the friction coefficient µ rises or the flange angle δ decreases, not only do the (L/V) quotients fall, but the curves also approach Nadal’s limit more rapidly as the yaw angle increases.
J. Santamaria et al.
31 d = 70º , mu = 0.3, ro = 0.6 m
d = 70º , mu = 0.3, ro = 0.45 m
2
2 N = 1000 N N = 10000 N N = 40000 N N = 100000 N Nadal's value
1.9
1.8
1.8
(L/V) lim
(L/V) lim
N = 1000 N N = 10000 N N = 40000 N N = 100000 N Nadal's value
1.9
1.7
1.6
1.7
1.6
1.5 1.5 1.4 1.4 1.3 0
1
2
3
4
5
ψ (mrad)
(a)
6
7
1.3
8
(b)
0
1
2
3
4
5
ψ (mrad)
6
7
8
d = 70º , mu = 0.5, ro = 0.45 m
d = 60º , mu = 0.3, ro = 0.45 m 1.5
1.3 N = 1000 N N = 10000 N N = 40000 N N = 100000 N Nadal's value
1.25 1.2
N = 1000 N N = 10000 N N = 40000 N N = 100000 N Nadal's value
1.4
(L/V) lim
1.3
(L/V) lim
1.15 1.1
1.2
1.05 1.1 1 1 0.95 0.9
0.9 0
1
2
3
(c)
4
5
ψ (mrad)
6
7
8
0
(d)
1
2
3
4
5
ψ (mrad)
6
7
8
d = 60º , mu = 0.5, ro = 0.6 m
d = 70º , mu = 0.3, ro = 0.3 m 2
0.95 N = 1000 N N = 10000 N N = 40000 N N = 100000 N Nadal's value
1.9
N = 1000 N N = 10000 N N = 40000 N N = 100000 N Nadal's values
0.9
(L/V) lim
(L/V) lim
1.8
1.7
0.85
0.8
1.6 0.75 1.5 0.7
1.4
1.3 0
1
2
(e)
3
4
5
ψ (mrad)
6
7
8
0.65
(f)
0
1
2
3
4
5
ψ (mrad)
6
7
8
Figure 23. (L/V) obtained using the procedure described in table 2, in relation to the wheelset’s yaw angle. The various curves on each graph show different values for the normal force on the wheel. a) Wheel with δ = 70º, µ = 0.3 and ro = 0.45 m. b) Wheel with δ = 70º, µ = 0.3 and ro = 0.6 m. c) Wheel with δ = 60º, µ = 0.3 and ro = 0.45 m. d) Wheel with δ = 70º, µ = 0.5 and ro = 0.45 m. e) Wheel with δ = 70º, µ = 0.3 and ro = 0.3 m. f) Wheel with δ = 60º, µ = 0.5 and ro = 0.6 m.
7. Conclusions This paper has performed a theoretical study of the role played by creepage forces during the derailment process. As a result, a methodology has been established for simple practical application to increase the Nadal limit when circumstances are not so adverse as those
32
Influence of creep forces on the risk of derailment coefficient
contemplated when the limit was deduced. In particular, the new formulation takes account of the yaw angle of the wheelset as a basic input parameter to correct Nadal’s limit, increasing the limit when this angle is smaller. The result is a method which is efficient and fast in terms of computation, providing derailment coefficient limit values which are less conservative than Nadal’s limit, as observed in real situations. The results are also compatible with Nadal’s formula in the sense that when the wheelset’s yaw angle increases, the limit obtained tends towards Nadal’s theoretical limit, and it is not reduced in any case. The method considered may be used in both dynamic computer simulations and in instrumented vehicles to provide more realistic values of derailment proximity at all times. In addition to providing a new procedure for calculation of the derailment limit, the theoretical analysis used also shows how, apart from the flange angle and the friction coefficient, other vehicle data may also exert significant influence on the derailment limit. In particular, the wheel’s rolling radius can considerably reduce this limit in view of the effect of contact curvature on creepage forces. Similarly, it has been demonstrated theoretically that the influence of other parameters on the risk of derailment is greater than was originally established. For instance, a reduction in the normal force in contact causes a significant reduction in the derailment limit when the yaw angle is not zero. In consequence, wheels with light loads or wheels subject to dynamic discharge while the vehicle is in motion are more likely to derail not only due to an increase in the (L/V) quotient, as is well known, but also due to simultaneous reduction of the quotient limit. One major contribution of the formulation in this paper is that, once the friction coefficient and the flange angle are known, derailment limits are obtained which do not only vary with the yaw angle, but also with the other parameters mentioned, providing more accurate values. It has likewise been shown that the negative influence on the risk of derailment of an increase in the friction coefficient and a reduction in the flange angle is slightly greater than the influence envisaged by Nadal’s formulation. Acknowledgements The authors wish to thank the Spanish Ministry of Development for the finance received through the T 83/2006 research project. The authors also acknowledge the financial help received from the Department of Education, Universities and Research of the Basque Government.
References [1] Nadal, M.J., 1896, Theorie de la stabilite des locomotives. Part II: Mouvement de lacet, Annales des Mines, 10, pp. 232–255. [2] UIC Code 518, 2005, Test and approval of railway vehicles from the points of view of dynamic behaviour, safety, track fatigue and ride quality. Union Internationale des Chemins de fer. 3rd edition. [3] Braghin, F., Bruni, S. and Diana, G., 2006, Experimental and numerical investigation on the derailment of a railway wheelset with solid axle. Vehicle System Dynamics, 44, pp. 305-325. [4] Xiao, X., Jin, X. and Wen, Z., 2007, Effect of disabled fastening systems and ballast on vehicle derailment. Transactions of the ASME, Journal of Vibrations and Accoustics, 129, pp. 217-229. [5] Jun, X. and Qingyuan, Z., 2005, A study on mechanical mechanism of train derailment and preventive measures for derailment. Vehicle System Dynamics, 43, pp. 121-147. [6] Elkins, J.A. and Carter, A., 1993, Testing and analysis techniques for safety assessment of rail vehicles: the state of the art. Vehicle System Dynamics, 22, pp. 185-208. [7] Shust, W.C. and Elkins, J.A., 1997, Wheel forces during flange climb. Part I: Track loading vehicle test. Proc. of the ASME- IEEE Joint Railroad Conference, Boston, MA, USA pp.137-147. [8] Sany, J.R., 1996, Another look at the single wheel derailment criteria. Proc. of the ASME-IEEE Joint Railroad Conference, Oakbrook, IL, USA, pp.17-22.
J. Santamaria et al.
33
[9] Clementson, J. and Evans, J., 2002, The use of dynamic simulation in the investigation of derailment incidents. Vehicle System Dynamics, 37 (supplement), pp.338-349. [10] Weinstock, H., 1984, Wheel climb derailment criteria for evaluation of rail vehicle safety. Proceedings of the ASME winter annual meeting, pp. 1-7. [11] Elkins, J.A. and Wu, H., 1999, Angle of attack and distance-based criteria for flange climb derailment. Vehicle System Dynamics, 33 (supplement), pp. 291-305. [12] Elkins, J.A. and Wu, H., 2000, New criteria for flange climb derailment. ASME/IEEE Joint Railroad Conference, Newark, NJ, USA , pp. 1-7. [13] Ishida, H., Miyamoto, T., Maebashi, E., Doi, H., Iida, K. and Furukawa, A., 2006, Safety Assessment for Flange Climb Derailment of Trains Running at Low Speeds on Sharp Curves. Quarterly Report of RTRI (Japan), 47, pp. 65-71. [14] Wu, H., Shu, X. and Wilson, N., 2005, Flange Climb Derailment Criteria and Wheel/Rail Profile Management and Maintenance Guidelines for Transit Operations. TCRP Report 71, Vol. 5, Transit Cooperative Research Program. [15] Wu, P. and Zeng, J., 1998, Dynamic Analysis for Derailment Safety of Railway Vehicles. Proceedings of the 1998 International Symposium on Safety Science and Technology, pp. 292-299. [16] Spinola, R., 2004, A 3D contact force safety criterion for flange climb derailment of a railway wheel. Vehicle System Dynamics, 42, pp. 289-300. [17] Iwnicki, S., 2006, Handbook of railway vehicle dynamics. Taylor & Francis Group, CRC Press. [18] Garg, V.K. and Dukkipati, R.V., 1984, Dynamics of Railway Vehicle Systems. Academic Press, Canada. [19] Santamaría, J. and Vadillo, E.G., 2004, Equivalent conicity and curve radius influence on dynamical performance of unconventional bogies. Comparison analysis. Vehicle System Dynamics, 41 (supplement), pp.133-142. [20] Cheli, F., Corradi, R., Diana, G. and Facchinetti, A., 2003, Wheel-rail contact phenomena and derailment conditions in light urban vehicles. 6th International Conference on Contact Mechanics and Wear of Rail/Wheel Systems (CM2003), Gothenburg (Sweden) June 10-13. [21] Kik, W., Menssen, R., Moelle, D., Bergander, B. and Vincent, 2002, Comparison of results of calculations and measurements of DYSAF-tests, a research project to investigate safety limits of derailment at high speeds. Vehicle System Dynamics, 37 (supplement), pp.543-553. [22] Wickens, A.H., 2003, Fundamentals of Rail Vehicle Dynamics. Guidance and Stability. Swets & Zeitlinger, B.V. Lisse, The Netherlands. [23] Shen, Z.Y., Hedrick, J.K. and Elkins, J.A., 1984, A comparison of alternative creep-force models for rail vehicle dynamics analysis. Proceedings of the 8th IAVSD Symposium, Cambridge, August 1983, Swets and Zeitlinger Publishers, Lisse, 591-605. [24] Polach, O., 1999, A fast wheel-rail forces calculation computer code. Vehicle System Dynamics, 33 (supplement), pp. 728-739. [25] Iwnicki, S., 2003, Simulation of wheel-rail contact forces. Fatigue & Fracture of Engineering Materials & Structures, 26, pp. 887-900. [26] Kalker, J.J., 1990, Three-dimensional elastic bodies in rolling contact. Kluwer Academic Publishers, The Netherlands. [27] Kalker, J.J., 1982, A fast algorithm for the simplified theory of rolling contact. Vehicle System Dynamics, 11, pp. 1-13. [28] Shabana, A. A., Berzeri, M. and Sany, J. R., 2001, Numerical Procedure for the Simulation of Wheel/Rail Contact Dynamics. Journal of Dynamic Systems Measurement and Control-Transactions of the ASME, 123, pp. 168-178. [29] Shabana, A. A., Zaazaa, K. E., Escalona, J. L. and Sany, J. R., 2002, Modeling Two-Point Wheel/Rail Contacts Using Constraint and Elastic-Force Approaches. Proceedings of the IMECE'02: 2002 ASME International Mechanical Engineering Congress and Exposition, New Orleans, Louisiana, pp. 17-22. [30] Pombo, J., Ambrósio, J. and Silva, M. A., 2007, New Wheel-Rail Contact Model for Railway Dynamics. Vehicle System Dynamics, 45, pp. 165-189. [31] Pombo, J. and Ambrósio, J., 2008, Application of a Wheel-Rail Contact Model to Railway Dynamics in Small Radius Curved Tracks. Multibody Systems Dynamics, 19, pp. 91-114. [32] Ayasse, J.B., Chollet, H., 2005, Determination of the wheel rail contact patch in semi-Hertzian conditions. Vehicle System Dynamics, 34, pp. 161-172. [33] Santamaría, J., Vadillo, E.G. and Gómez, J., 2006, A comprehensive method for the elastic calculation of the two-point wheel-rail contact. Vehicle System Dynamics, 44 (supplement), pp. 240-250. [34] Parena, D., Kuka, N., Masmoudi, W. and Kik, W., 1999, Derailment situation, Parametric Study. Vehicle System Dynamics, 33 (supplement), pp. 155-167.