Clinical Hemorheology and Microcirculation 31 (2004) 257–266 IOS Press
257
Influence of P. vivax malaria on erythrocyte aggregation and deformability Sanjay Jayavanth a , K. Jagadeesan b and Megha Singh a,∗ a b
Biomedical Engineering Division, Indian Institute of Technology, Madras-600036, India K.J. Hospital, Madras-600084, India
Received 25 August 2003 Revised 6 June 2004 Accepted 16 June 2004 Abstract. Malaria due to Plasmodium vivax affects blood flow in cardiovascular system. The present work is aimed to determine the variability of erythrocyte deformability and aggregation in malaria patients in comparison with that of normal subjects. Blood samples of malaria patients (n = 16), selected based on occurrence of parasitaemia, are categorized into low (LP), medium (MP) and high parasitaemia (HP), which represent increasing levels of the disease severity. For measurement of aggregation and deformability, by laser aggregometer and optical hemorheometer, the erythrocyte suspensions are prepared in plasma and physiological saline at hematocrit 5%. The results show that the erythrocyte deformability is significantly reduced (p < 0.001) with the increasing level of parasitaemia. Despite this decrease in deformability, the aggregation parameters are significantly increased, indicating the occurrence of hyper-aggregation, particularly in MP and HP, due to involvement of various factors. These changes may partly be contributing in the observed changes in blood flow in the microcirculation. Keywords: Malaria, parasitaemia, erythrocyte aggregation and deformability, laser aggregometer, optical hemorheometer
1. Introduction Malaria parasite enters blood stream of human host during blood meal of anophelous female mosqiuito. Thereafter, this invades the erythrocyte, gets internalized, and rapidly grows and multiplies. During the intercellular development, the parasite causes many functional and morphological changes in the erythrocyte. These include consumption and degradation of the erythrocyte proteins, appearance of knobs like protrusions in the membrane, electron dense material, clefts and vesicles in the cytoplasm [1,2], which contribute in the transfer of parasite-derived proteins into the erythrocyte cytoplasm and the membrane [1,3]. The parasite-proteins deposited at the site of knobs make the erythrocyte membrane sticky, leading to adherence to endothelium. By this process the parasites avoid spleenic clearance and evasion of host immunity [4]. The prominent biochemical changes in erythrocytes are increase in accumulation of ATP [5], increase in sodium influx and potassium efflux through the membrane and its calcium uptake [2], and reduction in the surface charge of the RBC [6]. These changes in the membrane and interior of the cells are partly responsible for reduction in erythrocytes deformability [7–9], leading to their elimination while passing *
Corresponding author. E-mail:
[email protected] /
[email protected].
1386-0291/04/$17.00 2004 – IOS Press and the authors. All rights reserved
258
S. Jayavanth et al. / Influence of P. vivax malaria on erythrocyte aggregation and deformability
through the spleen. Dondrop et al. [7] have suggested that the anemia and reduced deformability could be used as markers of malaria. But through the invasion process a selected population of erythrocytes is affected, as in the P. vivax invasion reticulocytes are generally subjected to these changes [8]. Due to these membrane changes the parasitized red blood cell (PRBC) acts as a core for attachment of several non-parasitized cells (nPRBC) around this, thus forming the rosettes. The force of attachment of PRBC with nPRBC is more than that of aggregates of normal erythrocytes [10–12]. In healthy subjects, the aggregation of erythrocytes is a reversible process, leading to formation of three-dimensional chain-like structure under near stasis conditions [13]. The disc-like shape transformation of erythrocytes, primarily due to their deformability, in presence of plasma proteins promotes the aggregation process [14]. But erythrocyte deformability, in malaria is significantly reduced due to decreased surface-to-volume ratio [9], stiffening of the membrane [15] and cytoskeletal remodeling [16]. Due to altered biochemical composition of plasma and erythrocyte membrane, an increasing number of rosettes are formed during the parasite invasion [10] resulting in the formation of large size aggregates, without any significant contribution from the deformation of erythrocytes. After the invasion of parasite the number of erythrocytes affected by parasitaemia tends to grow. Depending on their number the severity of malaria increases. These morpho-functional changes in erythrocytes could further influence the erythrocytes deformability and their aggregation. An analysis based on these parameters may provide information on hemorheological status of blood flow. This forms the objective of the present work and has been carried out by measurement of these parameters from the blood samples obtained from malaria patients suffering from various degrees of parasitaemia and are compared with that of normal subjects. 2. Materials and methods 2.1. Laser aggregometer This system consisted of a 2 mW He–Ne laser source (Spectra Physics, USA) of wavelength 632.8 nm and beam diameter of 1.0 mm. The specimen chamber was made of optically flat glass plates with internal dimensions 8.0 × 1.6 × 70 mm, to allow interaction between cells and sedimentation of the formed aggregates. The TI variation, due to entry and exit of an aggregate through observation volume (OV) of length 1.6 mm and diameter 1.0 mm, was detected by a photodiode-amplifier assembly (HAD 1000, EG&G, USA). This output signal was further amplified and digitized by a 12-bit ADC card and processed by the computer. A well mixed erythrocytes suspension of hematocrit 5% was placed in the chamber, which reduced the TI to a minimum. After an interval of time due to formation and sedimentation of the aggregates the mean TI, superposed with fluctuations, was observed. Initially these fluctuations were of smaller amplitude indicating minimum change in the number of cells in the OV but with the increase of time duration the amplitude of fluctuations was increased. Finally after the sedimentation of the formed aggregates the TI attained a maximum value, similar to that obtained by plasma in the chamber. By analysis of the TI signal the following parameters related to aggregation process of erythrocytes were obtained: (a) Aggregation size index (ASI): represented in terms of change of the number of erythrocytes at any instant of time, in comparison with their initial number (700,000) in the OV. The TI amplitude fluctuations corresponding to various changes were divided into four groups. The amplitude variations due to less than 3000 cells were omitted.
S. Jayavanth et al. / Influence of P. vivax malaria on erythrocyte aggregation and deformability
259
(b) Aggregation sedimentation time index (ASTI): measured as the time interval (sec) at the base of each fluctuation. This referred to the time taken by the aggregate to cross the OV and was also represented similar to the ASI in four groups of time intervals. (c) Process completion time (PCT): represented the total time taken from the onset to completion of the sedimentation process of aggregates. The end of the process was shown by the maximum TI due to plasma alone in the OV. Based on the ASI and ASTI variation the following parameters were calculated: (i) Effective number of cells (ENC): represented the number of cells in the OV at any given time. This was obtained by subtracting the number of cells as calculated from the ASI variations from the total number of erythrocytes initially present in the observation volume. (ii) Effective cellular sedimentation duration (ECSD): obtained from the ASTI variations as the effective time taken by the formed aggregates and erythrocytes to sediment through the observation volume. The aggregation parameters thus obtained described quantitatively the dynamic nature of this process. Further details of the experimental and computational procedures are given elsewhere [17,18]. 2.2. Optical hemorheometer This system was consisting of a syringe fixed into a filter membrane holder. The cellulose filter membrane of thickness 400 µm and curved pores of diameter 20 ± 5 µm (Schleicher and Schull, Germany) was placed in the membrane holder. A three-way valve controlled the flow of suspension through the tortuous paths of the membrane. A sheath of light, obtained from a light emitting diode operating at 640 nm, passed through the erythrocyte suspension and the transmitted light intensity (TLI) was measured by a photo-detector. On filling the sample, due to optical scattering by the erythrocytes, the sensor output reduced to the minimum value. After opening of the three-way valve the suspension passed through the measurement region. During this the TLI varied from the minimum to maximum. These data, digitized by ADC card, were stored in the computer for further processing. The sample volume flowing through the membrane for this observation was 0.6 ml. The time taken by this volume to pass through the membrane is inversely proportional to the deformability of erythrocytes. Further details of this procedure are given elsewhere [19,20]. 2.3. Sample preparation Fresh blood samples from malaria patients (n = 16) and normal subjects (n = 10) were obtained by venepuncture in test tubes containing citrate phosphate dextrose (10 : 1.4) as an anticoagulant. After centrifugation at 3000 rpm for 20 minutes, the supernatant plasma was separated and the buffy layer on top of the cells was removed and discarded. For aggregation measurement the erythrocyte suspension in plasma at 5% hematocrit was prepared. For deformability measurement the erythrocytes were suspended in physiological saline containing 0.5 g% albumin at 5% hematocrit. The respective measurements from these suspensions were carried out within 30 min, in a room maintained at temperature 25 ± 1◦ C. 2.4. Classification of malarial samples Two drops of blood sample were obtained from each malaria patient and a thin smear was prepared on glass slide, and allowed to dry in the air. Leishman’s stain was applied to the slide for 2 min and
260
S. Jayavanth et al. / Influence of P. vivax malaria on erythrocyte aggregation and deformability
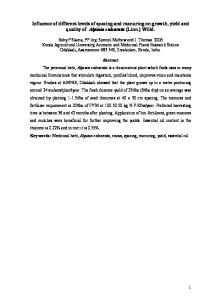
later on washed to remove excess of stain. After drying, the slide was examined by video-microscopic system (Leitz Dilux 20, Germany) using 100× objective. The blood smear images were recorded on a video cassette by videocassette recorder connected to microscope via the CCD camera. The images were digitized using Matrox frame capture card and stored in the computer for further processing. For classification of malaria samples the number of PRBCs in 50 digitized smear frames / images was counted. Based on the PRBC count, ranging from 1–2, 3–5, and more than 5, these samples were classified in low (LP), medium (MP) and high (HP) parasitaemia categories, respectively. Out of 16 P. vivax malarial samples, 6, 6 and 4 were in the LP, MP and HP categories, respectively. 2.5. Data acquisition and analysis For aggregation analysis the specimen chamber was filled with the well-mixed erythrocyte suspension in plasma at hematocrit 5% and was placed on the stage between the laser source and detector. The data acquisition was started immediately and continued till the TI attained a constant maximum value, indicating the movement of aggregates below the OV. The aggregation data were stored in the computer for further processing. Figure 1 shows an example of the aggregation data in terms of variation in the TI at various time intervals as observed in the suspensions of erythrocytes of normal subject and malaria patient. By processing the TI signals the various parameters, as mentioned above, were determined. For measurement of erythrocytes deformability, the syringe was filled with erythrocyte suspension in saline of hematocrit 5%. Air bubbles trapped in the membrane were removed by flushing it with physiological saline prior to flow of the suspension. Thereafter the erythrocyte suspension was filled up to a level of 3 mm below the top of the syringe. By opening the three-way valve the suspension was allowed to flow through the membrane and the data on the change in the TLI with time were acquired. This process was repeated three times. The digitized data were plotted as the TLI variation with respect to time. Thereafter the slope of this curve at various points was calculated and plotted with respect to time. At 50% height of this curve the passage time was determined by T2 − T1 , where T1 and T2 are time intercepts on the left and right sides of the curve, respectively. The same process was repeated three times with the same membrane and a mean passage time (MFT), which is reciprocal of erythrocyte deformability, was obtained. An example of the measured TLI and its corresponding FT is shown in Fig. 2. The statistical analyses of the data were carried out by Student t-test.
Fig. 1. Variation of TI during sedimentation of aggregates at various time intervals of erythrocyte suspensions of normal and malaria samples.
S. Jayavanth et al. / Influence of P. vivax malaria on erythrocyte aggregation and deformability
261
Fig. 2. Variation of transmitted light intensity and its slope curves at various intervals during the passage of erythrocyte suspension of normal sample through filter membrane.
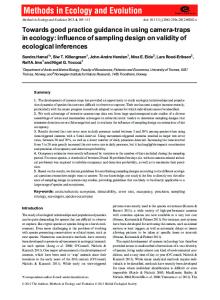
3. Results Figure 3 shows the blood smears images of malaria patients of various categories. With the presence of parasite in erythrocyte its normal appearance is changed. The examples of the LP, MP and HP are shown in images A, B and C, respectively. The total number of PRBC increases with increases of parasitaemia and is the maximum in HP category, as counted in 50 frames. Figure 4 shows the aggregate size index as calculated by the analysis of the TI fluctuations at various time intervals. This is a representation of the number of formed aggregates in various groups. The ASI for all categories of malaria changes throughout the sedimentation process. In general the number of aggregates is large initially followed by decrease with increase of sedimentation duration. The numbers of aggregates in category HP is the maximum followed by a decreasing trend in other categories and normal subjects. Accordingly their sedimentation process in the HP is completed faster than that of others. This also indirectly indicates the formation of aggregates of large sizes with a change in number of cells less than 3000, which as per this analysis are not counted. The number of such aggregates is less in other categories. This process indicates the increasing hyper-aggregation tendency of erythrocytes in patients with the increase of parasitaemia. Figure 5 shows the comparison of mean effective number of cells in normal and malaria subjects at various time intervals. Due to the same hematocrit initially the ENC is same for all the samples. But with progression of sedimentation, the ENC of malarial group is lower than that of normal subjects at any given time. The slopes of these curves indicate that the change in number of cells with time is faster in the HP compared to that of other categories. Figure 6 shows the comparison of mean effective cellular sedimentation duration. These data are indicator of effective time taken by all the aggregates to pass through the OV. The total time taken by large number of fluctuations due to aggregates in HP category at any interval of time is longer compared to that time taken by other categories. But the total time taken for completion of the process is shorter than that of others.
262
S. Jayavanth et al. / Influence of P. vivax malaria on erythrocyte aggregation and deformability
Fig. 3. Blood smear images of malaria samples of low parasitaemia (A), medium parasitaemia (B) and high parasitaemia (C) by P. vivax.
Figure 7 shows the variation in the MFT of normal and malaria samples. The MFT is minimum for normal and maximum for HP malaria. With the increase of PRBC in the sample the overall deformability of the erythrocytes is reduced. The various parameters obtained by these methods are further compared statistically (Table 1). The data for ENC and ECSD are chosen at 12th minute of sedimentation duration due to the non-overlapping region among various samples. While the data of ENC, ECSD, and PCT show no significant difference for LP, a significant difference for the MP (p < 0.001) and HP (p < 0.001) categories compared to that of normal is observed. The erythrocyte deformability (reciprocal of filtration time) is decreased significantly in the MP (p < 0.001) and HP (p < 0.001) categories.
4. Discussion The present work describes the changes in erythrocyte aggregation and deformability due to P. vivax malaria under increasing disease severity conditions. The malarial samples are divided into three severity
S. Jayavanth et al. / Influence of P. vivax malaria on erythrocyte aggregation and deformability
263
Fig. 4. Comparison of aggregate size index of normal and malaria samples of low, medium and high parasitaemia categories.
categories (LP, MP and HP) based on the PRBC count in blood smear slides. Such a classification is appropriate as higher parasitaemia level corresponds to greater severity of the infection and acute phase of malaria [21]. A number of studies show that during malaria the erythrocytes are subjected to biochemical, pathological and morphological changes [4–6,22–25], which could lead to variation in the deformability at the individual RBC level [15] as well as their cell–cell interaction [25]. Most of these
264
S. Jayavanth et al. / Influence of P. vivax malaria on erythrocyte aggregation and deformability
Fig. 5. Variation in mean effective number of cells at various time intervals of normal subjects and malarial parasitaemia of various categories.
Fig. 6. Variation in mean effective cellular sedimentation duration at various time intervals for normal subjects and malaria parasitaemia of various categories.
Fig. 7. Variation in mean filtration time (MFT) of normal and malaria samples of various categories.
S. Jayavanth et al. / Influence of P. vivax malaria on erythrocyte aggregation and deformability
265
Table 1 Comparison of aggregation parameters, viz., effective number of cells (ENC), effective cellular sedimentation duration (ECSD), process completion time (PCT), and mean filtration time of various categories of malaria samples with that of normal subjects Category
12th minute data ENC ECSD (sec) (number) × 105
Normal (n = 10) 5.23 ± 0.7# 0.38 ± 0.04 LP (n = 6) 5.01 ± 0.7 0.40 ± 0.04 MP (n = 6) 3.90 ± 0.7∗∗ 0.46 ± 0.03∗∗ HP (n = 4) 3.02 ± 0.4∗∗ 0.51 ± 0.04∗∗ # ∗ ∗∗ Mean ± SD, p = 0.05, p < 0.001.
PCT (min)
MFT (sec)
33.8 ± 4.24 30.0 ± 4.10∗ 21.5 ± 1.52∗∗ 15.8 ± 0.10∗∗
1.73 ± 0.29 1.98 ± 0.29∗ 2.29 ± 0.25∗∗ 2.8 ± 0.52∗∗
studies are focused on individual cells infected by P. falciparum, which is considered to be malignant. A decrease in erythrocyte deformability, as measured by LORCA [7] and other techniques [9] due to this infection is reported. Similarly the mechanical properties of the membrane of PRBC [10,11,15] are also altered. The present study with erythrocytes infected with parasite P. vivax, measured under initial flow conditions, shows a significant decrease in deformability with the increase of parasitaemia. These results show that this effect of P. vivax on erythrocyte deformability may also lead to microcirculatory complications similar to that as observed in malaria due to P. falciparum [26,27], particularly in the HP category [28]. The regions where parasitaemia cells are circulating could be maximally affected. Malaria induces various morpho-functional changes in erythrocytes [1–6]. The aggregation of erythrocytes is the result of various plasmatic and erythrocyte factors. The deformability of erythrocytes, which plays an important role in aggregation of erythrocytes, may not contribute to a larger extent as PRBC form rosette with nPRBC [10]. The rosette formation increases with the availability of PRBC. Thus, in contrast to normal blood which shows the formation of aggregates due to intra-cellular bridges formed by fibrinogen, the infected cells are equipped with an additional mechanism due to rosette formation. This tendency increases with the increase of parasitaemia and is significantly different compared to several cardiovascular diseases [29]. With the increase of parasitaemia, the rosette formation further leads to strongly bound large aggregates [10–12]. Besides this, the soluble factors produced by the parasite could also contribute in the aggregation process [7]. Our recent observations show that the morphology of the formed aggregates in malaria is totally changed. The stacking appearance of erythrocytes in normal blood is changed to overlapping of erythrocytes in malaria [30]. In contrast to erythrocyte deformability, which mainly influences the capillary transport, these aggregates affect the blood flow in micro-vessels. In conclusion, in malaria the reduced deformability, increased erythrocyte aggregation and anemia could be used as a marker of malarial conditions. To reduce the severity of the disease such an analysis may prove to be valuable in assessing the prevention or reversal of the adhesion with anti-adhesive therapeutics [24,31]. Based on the measured values of these parameters, the disease severity could further be analyzed by neural network analysis [32].
References [1] M. Aikawa, Morphological changes in erythrocytes induced by malaria parasites, Biol. Cell. 84 (1988), 173–181. [2] Y. Yuthawong, Alterations of the erythrocyte membrane in malarial infection, J. Sci. Soc. Thailand 11 (1985), 53–65. [3] K. Haldar, B.U. Samuel, N. Mohandas, T. Harrison and N.L. Hiller, Transport mechanisms in plasmodium-infected erythrocytes: lipid raft and tubular network, Internat. J. Parasitol. 31 (2001), 1393–1401.
266
S. Jayavanth et al. / Influence of P. vivax malaria on erythrocyte aggregation and deformability
[4] R. Ramasay, Molecular basis for evasion of host immunity and pathogenesis in malaria, Biochim. Biophys. Acta 1406 (1998), 10–27. [5] F.J. Oelshlegal, B.J. Sander and G.J. Brewer, Role of in vivo pyruvate kinase activity. A. Inheritance of elevated red cells ATP levels. B. Red cell malarial parasite interactions, in: Erythrocyte Structure and Function, G.J. Brewer, ed., Alan R. Liss, New York, 1975, pp. 199–218. [6] I.W. Sherman and J.R.T. Greenan, Plasmodium falciparum regional differences in lectin and cationized ferritin binding to surface of malaria infected human erythrocyte, Parasitology 93 (1986), 17–32. [7] P.M. Dondrop, B.J. Angus, K. Chotivanich, K. Silamut, R. Ruanngaverayuth, M.R. Hardeman, P.A. Kager, J. Vrecker and N.J. White, Red blood cell deformability as predictor of anemia in severe falciparum malaria, Am. J. Trop. Med. Hyg. 60 (1999), 733–737. [8] L.A.M. Bashawri, A.A. Mandil, A.A. Bahnassy and M.A. Ahmed, Malaria: hematological aspects, Ann. Soudi. Med. 22 (2002), 372–377. [9] S.P. Sutera and D.J. Krogstad, Reduction in surface–volume ratio: A physical mechanism contributing to the loss of red cell deformability, Biorheology 28 (1991), 221–229. [10] G.B. Nash, E.O. Brien, E.C. Gordon-Smith and J.A. Dormandy, Abnormalities in the mechanical properties of the red blood cell caused by plasmodium falciparum, Blood 74 (1989), 855–861. [11] F.K. Glenister, R.L. Coppel, A.F. Cowman, N. Mohandas and B.M. Cooke, Contribution of parasite proteins to altered mechanical properties of malaria-infected red blood cells, Blood 99 (2001), 1060–1063. [12] Q. Chen, V. Fernandez, A. Sundastrom, M. Schlichtherle, S. Datta, P. Hagblom and M. Wahlgren, Developmental selection of various gene expression in plasmodium falciparum, Nature 394 (1998), 392–395. [13] M. Lucius and J.F. Stoltz, Importance of erythrocyte aggregation on the viscoelastic and thixotropic properties of blood, Clin. Hemorheol. 7 (1987), 63–70. [14] R. Skalak, Aggregation and disaggregation of erythrocytes, Biorheology 23 (1984), 463–476. [15] H.A. Cranston, C.W. Boylan, G.L. Carroll, S.P. Sutera, J.R. William, I.Y. Gluzman and D.J. Krogstad, Plasmodiun falciparum maturation abolishes physiologic red cell deformability, Science 223 (1984), 400. [16] B.M. Cooke, F.K. Glenister, N. Mohandas and R.L. Coppel, Assignment of functional roles to parasite proteins in malariainfected red cells by competitive flow-based adhesion assay, Br. J. Hematology 17 (2002), 203–211. [17] M. Singh and M. Kumaravel, A computerized system for sequential analysis of aggregation of erythrocytes under dynamic conditions, Comput. Biomed. Res. 27 (1994), 325–336. [18] M. Singh and M. Kumaravel, Influence of jaundice on aggregation process and deformability of erythrocytes, Clin. Hemorheol. 15 (1995), 273–290. [19] V. Nagaprasad and M. Singh, Sequential analysis of the influence of blood storage on aggregation, deformability and shape parameters of erythrocytes, Clin. Hemorheol. Microcirc. (1998), 273–284. [20] S. Jayavanth and M. Singh, Changes in erythrocyte aggregation and deformability during human ageing, Curr. Sci. 82 (2002), 191–196. [21] P. Kumar and M. Clark, Clinical Medicine, WB Saunders, London, 1999. [22] P. Langreth and E. Peterson, Pathogenicity, stability and immunogenicity of a knob-like clone of Plasmodium falciparum in Colombian owl monkey, Infect. Immunol. 47 (1985), 760–766. [23] J. Kannani and H. Ginsburg, Metabolic inter-connection between the human malarial parasite Plasmodium falciparum and host erythrocytes, J. Biol. Chem. 264 (1989), 3194–3199. [24] A.P. Singh, S.K. Puri and C.E. Chitnis, Antibodies raised against receptor-binding domain of Plasmodium knowlesi. Duffy binding protein inhibit erythrocyte invasion, Mol. Biochem. Parasitol. 121 (2002), 21–31. [25] D.K. Kaul, E.P. Roth, R.L. Nagel, R.J. Howard and S.M. Handunnetti, Rosetting of P. falciparum infected red blood cells with uninfected red blood cells enhance microvascular obstruction under flow conditions, Blood 78 (1991), 812–819. [26] H.P. Sachdev, Can plasmodium vivax cause cerebral malaria?, Indian Pediatr. 33 (1996), 791–792. [27] M.A. Beg, R. Khan, S.M. Baig, Z. Gulzar, R. Hussain and R.A. Smego, Cerebral involvement in benign tertian malaria, Am. J. Trop. Med. Hyg. 67 (2002), 230–232. [28] B. Sina, Focus on plasmodium vivax, Trends in Parasitology 18 (2002), 287–288. [29] J.-F. Stoltz, M. Singh and P. Riha, Hemorheology in Practice, IOS Press, Amsterdam, 1999. [30] S. Jayavanth and M. Singh, Influence of malaria parasite (P. vivax) on erythrocyte aggregation: A study based on dynamic imaging and analysis, Indian J. Exp. Biol. (2004), in press. [31] B.M. Cooke, K.L. Walker, B. Scrabb, M.E. Wickham, F.K. Glenister, L.M. Stubberfield, D.W. Buckingham, N. Mohandas, A.F. Cowman and R.L. Coppel, Unraveling the molecular mechanism underlying altered cell adhesion induced by intraerythrocytic adhesion, Biorheology 39 (2002), 597–598. [32] S. Jayavanth and M. Singh, Artificial neural network analysis of malaria severity through aggregation and deformability parameters of erythrocytes, Clin. Hemorheol. Microcirc. 29 (2003), 457–468.