REPORTS bacteria (15) and is well supplied with tracheae and Malpighian tubules; in situ bacterial N fixation or N recycling are plausible scenarios. (For further discussion, see supporting online text.) Coupled with observations of foraging, isotopic ratios lend insight into the probable effects of ants on TRF plants (supporting online text). Taxa obtaining substantial N from prey are most likely to benefit plants by reducing herbivore loads. However, the most abundant arboreal TRF taxa are typically trophobiont tenders (2, 3, 8) fueled by rapid growth of hemipteran populations (10, 36). Of genera appearing as superabundant in canopy-fogging samples [Camponotus, Oecophylla, Dolichoderus, Azteca, Technomyrmex, Crematogaster, Myrmicaria, and Paraponera (1, 3)], all but Paraponera and a few Camponotus species tend large populations of trophobionts (23), not only parasitizing plant N, carbohydrates, and water, but potentially transmitting plant pathogens. Among trophobiont tenders that are well represented in the mid-story or high canopy, only neotropical Azteca (dolichoderines 14 to 21), paleotropical Oecophylla (formicine 36), and the four unicolonial species included in our study (Figs. 1 and 2) obtain most of their N from prey. If the proportion of N acquired through carnivory correlates with the quality of protection afforded to plants by ants, this may help to explain why so many neotropical myrmecophytes have evolved relationships with Azteca species (37) and why Oecophylla has proven useful for 1700 years in suppressing herbivores of Chinese citrus crops (13) (supporting online text). Together with the disproportionate representation of ants in canopy samples (1–3) and the probable undersampling of their trophobionts by standard methods (5, 6), large contributions of nonprey N to the diets of trophobiont-tending and other arboreal ants evidence the high combined costs of biotic antiherbivore defenses and herbivory by ants and their associates. Plant resource losses to insects, the dominant herbivores of lowland TRFs (6), greatly exceed the current estimate of 0.8 tons/ha/year [versus only 0.3 tons/ha/ year for vertebrates (6)].
References and Notes
1. J. E. Tobin, in Forest Canopies, M. D. Lowman, N. M. Nadkarni, Eds. (Academic Press, New York, 1995), pp. 129 –147. 2. D. W. Davidson, L. Patrell-Kim, in Neotropical Biodiversity and Conservation, A. C. Gibson, Ed. (Mildred E. Mathias Botanical Garden, Univ. of California, Los Angeles, 1996), pp. 127–140. 3. D. W. Davidson, Biol. J. Linn. Soc. 61, 153 (1997). 4. A. Floren, A. Biun, K. E. Linsenmair, Oecologia 131, 137 (2002). 5. A. Dejean, D. McKey, M. Gibernau, M. Belin, Sociobiology 35, 403 (2000). 6. E. G. Leigh Jr., D. M. Windsor, in The Ecology of a Tropical Forest: Seasonal Rhythms and Long-term
972
7. 8. 9. 10. 11. 12. 13. 14. 15. 16. 17. 18. 19. 20. 21. 22. 23. 24. 25.
Changes, E. G. Leigh, Jr., Ed. (Smithsonian Press, Washington, DC, 1996), pp. 111–122. D. W. Davidson, Ecol. Entomol. 24, 484 (1998). J. E. Tobin, in Nourishment and Evolution in Insect Societies, J. H. Hunt, C. A. Nalepa, Eds. (Westview Press, Boulder, CO, 1994), pp. 279 –307. E. Schupp, D. Feener Jr. in Ant-Plant Interactions, C. R. Huxley, D. F. Cutler, Eds. (Oxford Univ. Press, Oxford, 1991), pp. 175–197. R. C. Buckley, Annu. Rev. Ecol. Syst. 18, 111 (1987). H. G. Baker, P. A. Opler, I. Baker, Bot. Gaz. 139, 322 (1978). J. P. Sandstrom, N. A. Moran, Physiol. Entomol. 26, 202 (2001). B. Ho¨lldobler, E. O. Wilson, The Ants (Belknap Press, Cambridge, MA, 1990). C. Sauer, E. Stackebrandt, J. Gadau, B. Ho¨lldobler, R. Gross, Int. J. Syst. Evol. Microbiol. 50, 1877 (2000). S. van Borm, A. Buschinger, J. J. Boomsma, J. Billen, Proc. R. Soc. London Ser. B. 269, 2023 (2002). F. H. Caetano, C. da Cruz-Landim, Naturalia 10, 37 (1985). F. H. Caetano, K. Jaffe, R. W. Crewe, Les Insectes Sociaux, in A. Lenoir, G. Arnold, M. Lepage, Eds. (Universite ´ Paris Nord, Paris, 1994), p. 391. Enzymes responsible for amino acid deamination and transamination remove ‘light‘ 14N-containing amino groups preferentially (19). S. A. Macko, M. L. Fogel-Estep, M. H. Engel, P. E. Hare, Geochim. Cosmochim. Acta 50, 2143 (1986). Fractionations average 3‰ per trophic level for animals in neutral nitrogen balance (21). M. J. DeNiro, S. Epstein, Geochim. Cosmochim Acta 45, 341 (1981). Materials and methods are available as supporting material on Science Online. D. W. Davidson, S. C. Cook, R. R. Snelling, T. H. Chua, unpublished data. M. L. Thao, L. Baumann, P. Baumann, N. A. Moran, Curr. Microbiol. 36, 238 (1998). N. A. Moran, C. Dale, H. Dunbar, W. A. Smith, H. Ochman, Environ. Microbiol. 5, 116 (2003).
26. C. von Dohlen, S. Kohler, S. T. Alsop, W. R. McManus, Nature 412, 433 (2001). 27. T. L. Wilkinson, D. Adams, L. B. Minto, A. E. Douglas. J. Exp. Biol. 204, 3027 (2001). 28. A. Nakabachi, H. Ishikawa, Insect Biochem. Molec. Biol. 27, 1057 (1998). 29. A. E. Douglas, Annu. Rev. Entomol. 43, 17 (1998). 30. G. Febvay, Y. Rahbe ´, M. Rynkiewicz, J. Guillaud, G. Bonnot, J. Exp. Biol. 202, 2639 (1999). 31. P. J. Folgarait, D. W. Davidson, Oecologia 104, 189 (1995). 32. M. Heil, B. Fiala, W. Kaiser, K. E. Linsenmair, Funct. Ecol. 12, 117 (1998). 33. G. C. Wheeler, J. Wheeler, Ant Larvae: Review and Synthesis (Memoirs of the Entomological Society of Washington no. 7, Entomological Society, Washington, DC). 34. T. Yoneyama, L. L. Handley, C. M. Scrimgeour, D. B. Fisher, J. A. Raven, New Phytol. 137, 205 (1997). 35. J. J. Wernegreen, A. B. Lazarus, P. H. Degnan, Microbiology 148, 2551 (2002). 36. N. Blu¨thgen, K. Fiedler, J. Anim. Ecol. 71, 793 (2002). 37. D. W. Davidson, D. McKey, J. Hymenop. Res. 2, 13 (1993). 38. Funded by NSF grant IBN-9707932 to D.W.D. We thank Peru’s Instituto Nacional de Recursos Naturales and officials of Parque Nacional Manu, Museo de Historia Natural, Universidad Nacional Agraria La Molina, Universiti Brunei Darussalam, and Brunei Museums for granting or facilitating permissions to study and collect in national parks. D. Bowling, D. McKey, and G. Orians commented helpfully on our manuscript, and R. Kohout, S. Cover, and C. Cook provided technical assistance. Supporting Online Material www.sciencemag.org/cgi/content/full/300/5621/969/ DC1 Materials and Methods SOM Text Table S1 References and Notes 6 January 2003; accepted 3 March 2003
Long-Term Effects of Wildfire on Ecosystem Properties Across an Island Area Gradient David A. Wardle,1,2* Greger Ho¨rnberg,1 Olle Zackrisson,1 Maarit Kalela-Brundin,3 David A. Coomes4 Boreal forest soils play an important role in the global carbon cycle by functioning as a large terrestrial carbon sink or source, and the alteration of fire regime through global change phenomena may influence this role. We studied a system of forested lake islands in the boreal zone of Sweden for which fire frequency increases with increasing island size. Large islands supported higher plant productivity and litter decomposition rates than did smaller ones, and, with increasing time since fire, litter decomposition rates were suppressed sooner than was ecosystem productivity. This contributes to greater carbon storage with increasing time since fire; for every century without a major fire, an additional 0.5 kilograms per square meter of carbon becomes stored in the humus. In understanding the global carbon cycle and its response to human activity, key issues that emerge are the extent to which terrestrial ecosystems can serve as a sink for carbon and how this could help to mitigate potential human-induced increases in atmospheric CO2 levels (1–4 ). Because the boreal forests of the Northern Hemisphere compose 11% of the Earth’s terrestrial sur-
face (5) and contain a greater amount of stored carbon on a global basis than any other forest biome (6 ), the boreal forest biome has the potential to function as a major sink or source of atmospheric CO2 (6, 7 ). The main natural disturbance regime in boreal forests is wildfire from lightning strikes, and lightning-induced fires in these forests have a natural return period of 50 to
9 MAY 2003 VOL 300 SCIENCE www.sciencemag.org
REPORTS 100 years (8 –10). However, over the past 2 centuries, deliberate wildfire suppression by humans has taken place throughout substantial areas of the world’s terrestrial ecosystems. Wildfire is a major driver of ecosystem carbon cycling and storage (11–13), and it has been predicted that fire suppression by humans may have important effects on ecosystem carbon storage patterns (14– 16 ), possibly explaining part of the socalled “missing carbon” sink, carbon that is evolved as CO2 but remains unaccounted for in global carbon budgets (12–17 ). Here, we present evidence from a system that provides an opportunity for studying how long-term fire history can affect ecosystem carbon flows and sequestration in the time scale of centuries to millennia. The system involves a series of lake islands in two adjacent Swedish lakes, Lake Hornavan and Lake Uddjaure (65°55⬘N to 66°09⬘N; 17°43⬘E to 17°55⬘E). It has previously been shown for this system with tree fire scar data and 14C dating of charcoal particles in the humus that large islands burn more frequently than smaller ones; this is presumably because they have a larger area to intercept lightning strikes (18, 19). Several larger islands have burned in the past century, whereas some smaller islands have not experienced a major fire for the past 4000 years. All islands are of similar age (having been created after the most recent glaciation) and have been subjected to similar extrinsic factors other than wildfire history. Earlier work on these islands focused on how island area influences ecosystem processes by altering the functional composition of the vegetation (18, 19). The present investigation is focused on how differences in wildfire regimes across islands influence ecosystem productivity (carbon gain), decomposition (carbon loss), and total carbon sequestration. We studied 30 islands: 10 “large” islands (⬎1.0 ha; mean time since last major fire is 585 years), 10 “medium” islands (0.1 to 1.0 ha; mean time since fire is 2180 years), and 10 “small” islands (⬍0.1 ha; mean time since fire is 3250 years) (20). For each island, we measured several variables that are indicative of either plant productivity or plant biomass (21). Total standing tree biomass and net tree productivity over the 3 years preceding biomass measurement were estimated through the 1 Department of Forest Vegetation Ecology, Faculty of Forestry, Swedish University of Agricultural Sciences, SE901 83 Umeå, Sweden. 2Landcare Research, Post Office Box 69, Lincoln, New Zealand. 3Museum of Forestry, Box 176, SE921 23 Lycksele, Sweden. 4Department of Plant Sciences, University of Cambridge, Downing Street, Cambridge CB2 3EA, UK.
*To whom correspondence should be addressed. Email:
[email protected]
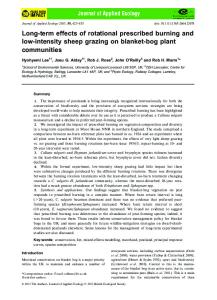
use of allometric relationships applied to individually measured trees (21). Further, for each of 3 years, net tree litter production was quantified through the use of fieldbased litter trays, and measurements were made of net productivity and standing biomass of the ericaceous dwarf shrubs that compose the field-layer vegetation (21). Light capture by trees was also assessed by measuring the proportion of incident light intercepted by the forest canopy. These measurements in combination provide consistent evidence that the large- and medium-sized islands are much more productive, and support more plant standing biomass per unit of area, than the small islands (Fig. 1). This means that extended periods without fire eventually lead to an ecosystem decline, with less carbon fixed by plants per unit of land area over time. However, the absence of fire for periods of less than about 2500 years is unlikely to have an important effect on ecosystem
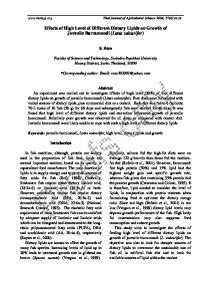
productivity; no measure of plant productivity or biomass differed significantly between the large- and medium-sized islands (Fig. 1). The loss of ecosystem productivity that occurs after the prolonged absence of wildfire is matched by important changes in the relative contribution of different plant species to total productivity (Fig. 2). Most of the carbon fixed by trees was fixed by Picea abies on the small islands and by Pinus sylvestris on the large islands. Further, Empetrum hermaphroditum made a substantial contribution to total productivity in the dwarf-shrub layer on the small islands and only a minor contribution on the large islands, where productivity was dominated by Vaccinium myrtillus. Both Picea and Empetrum are recognized as latesuccessional forest species that dominate only in the prolonged absence of fire and are often associated with reduced ecosystem productivity (22, 23). Litterfall data
Fig. 1. Measures of productivity and biomass of vascular vegetation per unit of area in relation to island size. (A) Average annual tree productivity for the 2000, 2001, and 2002 growing seasons; (B) standing tree biomass in June 2002; (C) total tree litterfall for August 1999 to August 2002; (D) ericaceous dwarf-shrub productivity during the 2000, 2001, and 2002 growing seasons; (E) dwarf-shrub total biomass, averaged over August 2000, 2001, and 2002; and (F) interception of incident light by the forest canopy measured during 7 to 14 August 2001. S, M, and L correspond to small (⬍0.10 ha), medium (0.10 to 1.0 ha), and large (⬎1.0 ha) islands, respectively. The mean times since last fire for small, medium, and large islands are 3250, 2180, and 585 years, respectively. All P values are derived from one-way analysis of variance (ANOVA), and within each set of three bars bars topped by the same letter are not significantly different at P ⫽ 0.05 (least significant difference test). Methodology for each measurement is given in (21).
www.sciencemag.org SCIENCE VOL 300 9 MAY 2003
973
REPORTS collected over 3 years also point to large differences across island size groups in the types of tree material produced; with increasing time since last fire, there was a decline in the relative contribution of Pinus needles and an increase in the contributions of Picea needles and twig material. The observed pattern of reduced production on smaller islands was matched by patterns of reduced carbon loss from litter during decomposition. Earlier work on these islands has indicated a positive relationship between island size and the activity of soil decomposer organisms (18). In the present investigation, we used a “litter reciprocal transplant experiment” to assess
the mechanistic basis through which decomposition may be influenced by wildfire history (21). We used the 30 islands to create 10 replicate groups of three, with each group consisting of a large, medium, and small island, each chosen at random without replacement. Litter was collected from each island for each of the three main tree species and the three main dwarf-shrub species characterizing the system. Collected litter was placed in litterbags and left to decompose for two years on all three islands belonging to the same group as the island from which it was sourced (21). This design enables us to test the importance of each of three mechanisms through
which litter decomposition may be retarded on small islands relative to large ones and reveals all three to be important ( Table 1): (i) Individual species effects, in which plant species that produce poorer quality litter become relatively more abundant with decreasing island size. For the entire data set, decomposition rates of the six species differed significantly (F5,502 ⫽ 78.2, P ⬍ 0.001), with Empetrum (an important component only on small islands) and Vaccinium vitis-idaea producing the slowest and second-slowest decomposing litters, respectively, and with Pinus (a dominant only on large islands) producing the fastest decomposing litter. (ii) Phenotypic plastic-
Fig. 2. Contribution of (A) tree species to total tree productivity, (B) litter types to total litterfall, and (C) dwarf-shrub species to total dwarfshrub productivity (total values are given in Fig. 1). All data are averaged over all 3 years for each measurement. “Small,” “medium,” and “large” islands were classified as described in the text. Lvs, leaves; ndls, needles. Significance of differences in proportions of different components among the island size class groups were determined with the use of one-way ANOVA on arcsinetransformed data as follows: (A) tree productivity: Betula: F ⫽ 1.67, P ⫽ 0.209; Pinus: F ⫽ 9.65, P ⬍ 0.001; Picea: F ⫽ 7.42, P ⫽ 0.003; (B) litterfall: Betula: F ⫽ 0.17, P ⫽ 0.842; Pinus: F ⫽ 6.03, P ⫽ 0.007; Picea: F ⫽ 3.69, P ⫽ 0.044; twigs, F ⫽ 9.88, P ⬍ 0.001; reproductive material: F ⫽ 0.10, P ⫽ 0.901; (C) dwarf-shrub productivity: Empetrum: F ⫽ 21.87, P ⬍ 0.001; V. myrtillus: F ⫽ 11.93, P ⬍ 0.001; V. vitis-idaea: F ⫽ 6.85, P ⫽ 0.004.
Table 1. Percentage litter mass loss over a 2-year period as determined with the use of a litter reciprocal transplant experiment, in which litter from small, medium, and large island size classes was placed on islands of all three size classes (21). All F and P values were derived through ANOVA. Degrees of freedom for F values for each of the six individual plant species are 2 and 89 for factors A Factor A: size of island that litter was collected from Plant species
Pinus sylvestris Betula pendula Picea abies Vaccinium myrtillus Vaccinium vitis-idaea Empetrum hermaphroditum All species
974
and B and 4 and 89 for A ⫻ B interaction. For the “all species” analysis (based on a single analysis of the entire data set), degrees of freedom are 2 and 502 for factors A and B and 4 and 502 for A ⫻ B interaction. Within each row for each of factors A and B, numbers followed by the same letter (a, b, or c) are not significantly different at P ⫽ 0.05 (least significant difference test). Factor B: size of island that litter was placed on
A⫻B interaction F and p values
Small
Medium
Large
F and P values
Small
Medium
Large
F and P values
50.2 a 45.9 a 46.7 a 42.2 b
48.4 a 46.8 a 47.5 a 46.3 ab
48.0 a 48.4 a 48.4 a 50.9 a
1.64 (0.203) 0.56 (0.572) 1.55 (0.324) 9.09 (⬍0.001)
45.6 b 46.4 a 43.6 c 45.8 a
49.8 a 46.5 a 47.5 b 46.2 a
51.2 a 48.1 a 51.6 a 47.1 a
10.20 (⬍0.001) 0.30 (0.739) 24.23 (⬍0.001) 0.28 (0.760)
0.86 (0.493) 0.81 (0.525) 1.75 (0.152) 1.35 (0.340)
38.1 b
39.7 ab
42.1 a
3.84 (0.026)
36.8 b
40.6 a
42.2 a
7.46 (0.001)
1.15 (0.340)
33.1 a
33.2 a
33.9 a
0.71 (0.501)
30.3 b
34.5 a
34.7 a
7.71 (⬍0.001)
0.55 (0.701)
42.8 b
43.7 b
45.1 a
5.89 (0.003)
41.5 c
44.2 b
45.9 a
19.80 (⬍0.001)
1.99 (0.096)
9 MAY 2003 VOL 300 SCIENCE www.sciencemag.org
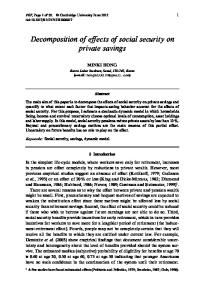
REPORTS ity effects, in which a given plant species produces poorer quality litter when growing on a smaller island. For the entire data set, litter produced on smaller islands decomposed significantly more slowly overall (F2,502 ⫽ 5.89, P ⫽ 0.003), and when each species was considered separately this pattern was significant for both of the Vaccinium species ( Table 1). (iii) Microhabitat effects, in which a given litter is broken down more slowly when placed in the humus of a small island. For the whole data set, litter broke down more slowly when placed on small islands (F2,502 ⫽ 19.8, P ⬍ 0.001), and this pattern was also significant for four of the six species when the data from each were analyzed separately ( Table 1). These results point to strong mechanistic bases through which decomposition (and hence carbon loss from the ecosystem) is retarded during the ecosystem decline that results from the long-term absence of wildfire. In addition to influencing both ecosystem carbon input and output, island size also significantly affected the total amount of carbon sequestered in the ecosystem (Fig. 3). The large, medium, and small islands stored 6.4, 16.2, and 27.3 kg C m⫺2 in the humus and 9.9, 19.2, and 29.0 kg C m⫺2 in total, respectively. Dating of the most recent charcoal present on each island was performed by 14C analysis (21), and there were strong positive relationships detected between ecosystem carbon storage and the age of this charcoal (Fig. 3). Linear regression equations fitted to the right-hand panels of Fig. 3 reveal that for every 100 years without a major fire an additional 0.49 kg m⫺2 of carbon should become stored in the humus layer or 0.45 kg m⫺2 of carbon in the whole ecosystem. Although we recognize the limitations of extrapolating our results to the entire boreal zone, if this rate of accumulation occurred in all Fig. 3. Storage per unit area of carbon in the soil and in the soil plus vegetation in relation to island area and time since most recently dated fire determined with the use of 14C dating of charcoal. Carbon storage data are from (18).
boreal forests then every century without a major fire would cause an additional 7 gigatons of carbon to become stored in the world’s boreal forest soils. Although this amount represents just over 1% of the rate of carbon released by fossil fuels (1), it would nevertheless represent a 4% increase of that which is currently stored in these soils (6 ). The negative association between fire frequency and soil carbon accumulation may be because of carbon losses either through combustion caused by fire or through reduced rates of decomposition with increased time since last fire. Although it was not possible to quantify the contribution of the first of these mechanisms, our results show that the second of these mechanisms makes an important contribution to soil carbon accumulation. Carbon accumulation in soils is promoted whenever decomposition is suppressed relative to net primary productivity. In our study, litter decomposition and quality of litter input were significantly less on medium islands than those on large ones (bottom row of Table 1 and Fig. 2), whereas no measure of plant productivity differed significantly between these two island size classes (Fig. 1). This suggests that after cessation of wildfire, impairment of decomposition occurs sooner than impairment of productivity. This should, in turn, cause fire suppression to promote carbon storage in the soil well before ecosystem productivity declines. Our results indicate that wildfire, which is an important agent of disturbance in many of the world’s natural ecosystems, is likely to contribute to long-term patterns of carbon storage and ultimately ecosystem productivity. Anthropogenic fire suppression, which is performed in a wide range of naturally fire-driven ecosystems including the inhabited regions of the boreal zone, is
likely to promote net carbon storage in these ecosystems. However, other elements of human-induced global change may promote greater fire frequency and accelerate carbon loss. For example, in the uninhabited regions of the boreal zone where fire suppression is not practiced, global warming may increase the frequency of wildfire (24 ). Further, global warming may make fire suppression more difficult even where it is practiced and could induce effects on carbon storage through altering the balance between rates of productivity and decomposition. On a global basis, the boreal forest functions as an important sink or source of carbon (6, 7 ), and our results indicate that this role is likely to be substantially affected on the order of centuries by any global-change phenomenon that alters the natural wildfire regime in the boreal zone. References and Notes
1. D. S. Schimel et al., Nature 414, 169 (2001). 2. J. M. O. Scurlock, D. O. Hall, Global Change Biol. 4, 229 (1998). 3. R. F. Keeling, S. C. Piper, M. Heimann, Nature 381, 218 (2001). 4. J. Y. Fang, A. P. Chen, C. H. Peng, S. Q. Zhao, L. Ci, Science 292, 2320 (2001). 5. G. B. Bonan, H. H. Shugart, Annu. Rev. Ecol. Syst. 20, 1 (1989). 6. J. M. Anderson, Ecol. Appl. 1, 326 (1991). 7. C. L. Goodale et al., Ecol. Appl. 12, 891 (2002). 8. O. Zackrisson, Oikos 29, 22 (1977). 9. S. Payette, in A Systems Analysis of the Global Boreal Forest, H. Shugart, R. Leemans, G. B. Bonan, Eds. (Cambridge Univ. Press, Cambridge, 1992), pp. 144 – 169. 10. C. P. S. Larsen, J. Biogeogr. 24, 663 (1997). 11. J. W. Harden et al., Global Change Biol. 6 (suppl.), 174 (2000). 12. D. Tilman et al., Ecology 81, 2680 (2001). 13. R. A. Houghton, J. L. Hackler, K. T. Lawrence, Global Ecol. Biogeogr. 9, 145 (2000). 14. G. C. Hurtt et al., Proc. Nat. Acad. Sci. U.S.A. 99, 1389 (2002). 15. D. S. Ojima, D. S. Schimel, W. J. Parton, C. E. Owensby, Biogeochemistry 24, 67 (1994). 16. R. A. Houghton, J. L. Hackler, K. T. Lawrence, Science 285, 574 (1999). 17. D. S. Schimel, Global Change Biol. 1, 77 (1995). 18. D. A. Wardle, O. Zackrisson, G. Ho¨rnberg, C. Gallet, Science 277, 1296 (1997). 19. D. A. Wardle, J. Biogeogr. 29, 583 (2002). 20. All measurements were performed on plots that were located at similar elevations and similar distances from the shore on each island, irrespective of island size, to minimize the potential of confounding factors covarying with island size such as edge effects and microclimate. 21. Materials and methods are given as supporting material on Science Online. 22. G. Sire ´n, Acta For. Fenn. 62, 1 (1955). 23. M. Haapasaari, Acta For. Fenn. 135, 1 (1998). 24. M. D. Flannigan, C. E. Van Wagner, Can. J. For. Res. 21, 61 (1991). 25. We thank K. Altgott, N. Anthes, T. Fukami, M. Karlsson, N. Rodda, O. Petchey and J. Wilmshurst for field assistance and M.-C. Nilsson, D. Peltzer, and four anonymous reviewers for helpful comments on the manuscript. Supported by the Swedish Natural Science Research Council. Supporting Online Material www.sciencemag.org/cgi/content/full/300/5621/972/DC1 Materials and Methods References and Notes 23 January 2003; accepted 9 April 2003
www.sciencemag.org SCIENCE VOL 300 9 MAY 2003
975