Madras Agric. J., 93 (7-12) : 226-231 July-December 2006
Correlation studies in chillies (Capsicum annuum L.) A.RUTH BEULAH RANI AND D.VEERARAGAVATHATHAM Horticultural College and Research Institute, Tamil Nadu Agrl. Univesity, Coimbatore – 641 003.
Abstract : In a correlation analysis in chillies, all the characters under study except per cent disease index were positively associated with marketable fruit yield per plant in two sets of crosses. This suggests that least incidence of anthracnose would result in more marketable fruit yield. Total phenol was found to possess a strong negative association with disease incidence in both direct and reciprocal crosses suggesting that total phenol plays a significant role in reducing disease incidence. Capsaicin was positively associated with total phenol content which imparts resistance thus paving way for simultaneous selection for yield, quality and resistance. Keywords : Chillies, correlation analysis, disease index, authracnose, marketable fruit yield.
Introduction One of the major constraints in the production of hot pepper is anthracnose caused by seed-borne pathogen, which damages the yield and quality of the produce. To improve the quality and productivity of marketable chillies, besides disease resistance, it is essential to consider the quantitative characters, especially, the yield. The trait resistance to disease if dominant over susceptibility can be directly availed in F 1 hybrids, thus eliminating the tedious process of selecting resistant segregants in successive generations. Therefore, hybrids having moderate resistance with good horticultural traits need to be developed. Selection of hybrids based on individual traits may not be rewarding always. So, character association studies are of great significance in the process of selection by which simultaneous improvement of more than one character is possible. Hence the present study was undertaken at the Department of Vegetable Crops, Horticultural College and Research Institute, Tamil Nadu
Agricultural University, Coimbatore during 1999-2002, to study the association of biometric and biochemical characters in the F1 hybrids of chillies with particular reference to anthracnose disease incidence and marketable produce of chilli. Materials and methods Through screening of a germplasm of chilli comprising ninety three genotypes, three genotypes were identified as field resistant to anthracnose and five as high yielders with moderate level of tolerance to the disease. Resistant donors, namely Sln 1, Sln 2 and Sln 3 were crossed with moderately resistant genotypes, namely, Arka Lohit, CC 4, KDC 1, Pepper Hot and Ujwala in a line x tester fashion (both direct and reciprocal) and the hybrids were studied. Thirty hybrids and eight parents of chillies were raised in the field, in a randomized block design, replicated thrice. All the recommended package of practices were followed except application
Correlation studies in chillies (Capsicum annuum L.)
of fungicide. Phenotypic and genotypic correlation coefficients between marketable fruit yield, as this trait is decided by the percentage of disease affected fruits in the total fruit yield, and its component characters were estimated and also among the components themselves. The component traits studied were plant height, number of branches per plant, days to first flowering, days to 50 per cent flowering, length, girth and weight of fruit, number of fruits per plant, number of seeds per fruit, thousand seed weight, ascorbic acid content (AOAC method, 1970), capsaicin content (Sadasivam and Manickam, 1992), total phenol content (Bray and Thrope, 1954) and ortho dihydroxy phenol content (Mahadevan and Sridhar, 1982). Besides the important data collected on per cent disease index (Wheeler, 1969) were also included to study the correlation with marketable fruit yield and other component traits. The correlation coefficients among yield and its attributes were calculated as suggested by Panse and Sukhatme (1957). Phenotypic and genotypic correlation coefficients were estimated according to the formulae given by Johnson et al. (1955). The significance of the phenotypic and genotypic correlation coefficients was tested by referring to the standard table given by Snedecor and Cochran (1967). Results and Discussion In the present study aimed at developing hybrids with high yield and resistance to anthracnose disease, marketable fruit yield per plant is the prime concern rather than mere yield per plant since this is the ultimate factor based on which selection programmes must be outlined. Changes in one or more component characters lead to changes in yield of the produce. But all changes in the components need not necessarily be expressed by changes in yield. This is because of
227
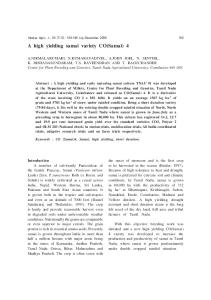
varying degrees of correlation between yield and its component traits and among the components themselves, in the positive and negative directions. Character association studies are of great significance in the process of selection by which simultaneous improvement of more than one character is possible. It is obvious that improvement of one trait results in the simultaneous improvement of all positively associated component characters (Kalloo, 1988). For majority of the traits, genotypic correlations were of higher magnitude than that of the corresponding phenotypic correlations, indicating the strong association between the characters in both direct (Table 1) and reciprocal (Table 2) crosses. Also, all the component characters except per cent disease index were positively associated with marketable fruit yield per plant in both the set of crosses. This is in accordance with the results of Saraladevi and Arumugam (1999) for plant height, Thakur (1993) for branches per plant, Thangaraj (1984) for days to flowering, Shah et al. (1988) for fruit length, Sundaram (1992) for fruit weight, Vadivel (1987) for number of fruits and Singh and Singh (1970) for thousand seed weight. The strong and significant negative association exhibited by per cent disease index with marketable fruit yield (-0.509 in direct crosses and -0.578 in the reciprocal crosses) clearly shows that least incidence of anthracnose results in more marketable fruit yield. The two characters days to first flowering (0.378) and orthodihydroxy phenol content (0.281) had significant positive association with marketable fruit yield only when the resistant donors were used as female parents (direct crosses) and the association was non significant in the reciprocal set, which suggests that these two traits may be possibly under the influence of cytoplasmic genes present in the resistant donors.
Days to G first flowering P
Days to G 50% flowering P
Length of fruit
Girth of fruit
Fruit weight
Number of fruits per plant
Number of seeds per fruit
Thousand seed weight
Ascorbic acid G content P
Capsaicin content
Total phenol content
OD phenol content
Percent disease G index P
Marketable fruit yield per plant
X3
X4
X5
X6
X7
X8
X9
X10
X11
X12
X13
X14
X15
Y
1.000 1.000
X1
* Significant at 5 per cent level,
G P
G P
G P
G P
G P
G P
G P
G P
G P
G P
G P
Number of branches per plant
X2
G P
Plant height
X1
Character 0.176 0.173
X4
1.000 1.000 1.000 1.000
0.938** 0.885**
0.248* 0.376** 0.213 0.338**
0.102 0.089
X3
** Significant at 1 per cent level.
1.000 1.000
0.579** 0.594**
X2
1.000 1.000
-0.045 -0.034
-0.188 -0.169
0.137 0.124
-0.201 -0.184
X5
1.000 1.000
-0.237* -0.227
0.358** 0.342**
0.347** 0.331**
0.378** 0.338**
0.438** 0.424**
X6
1.000 1.000
0.557* 0.537**
0.057 0.046
0.336** 0.326**
0.309** 0.291*
0.692** 0.611**
0.571** 0.539**
X7
1.000 1.000
0.240* 0.237*
0.092 0.084
0.569** 0.533**
0.242* 0.238*
0.099 0.096
0.304** 0.294*
-0.014 -0.002
X8 0.167 0.161
X10
0.050 0.042
0.160 -0.154
X11
0.290* 0.266*
0.267* 0.259*
X12
0.006 0.002
1.000 1.000
0.215 0.213
1.000 1.000
0.449** 0.445**
0.336** 0.328**
0.835** 0.445* 0.837** 0.438**
0.694** 0.465** 0.673** 0.454**
-0.004 -0.011
1.000 1.000
-0.109 -0.109
0.120 0.119
0.137 0.135
-0.21 -0.021
-0.026 -0.026
0.199 0.189
1.000 1.000
-0.134 -0.134
0.275* 0.275*
0.462** 0.456**
0.279* 0.272*
0.240* 0.236*
0.387** 0.376**
-0.052 -0.050
0.407** 0.535** -0.338** 0.383** 0.395** 0.522** -0.329** 0.371**
0.403** 0.488** -0.326** 0.372** 0.384** 0.476** -0.17** 0.363**
0.580** 0.507** 0.514** 0.458**
0.541* 0.512**
X9
1.000 1.000
0.787** 0.780**
0.054 0.054
0.264* 0.261*
0.533** 0.527**
0.369** 0.366**
0.283* 0.280*
0.535** 0.522**
-0.015 -0.019
0.331** 0.325**
0.325** 0.316**
0.518** 0.475**
0.443** 0.427**
X13
Table 1. Genotype (G) and phenotypic (P) correlation between marketable fruit yield and other traits (Direct crosses)
-0.301* -0.273*
-0.208 -0.199
X15
0.710** 0.631**
0.541** 0.514**
Y
0.127 0.115
0.516** 0.500**
0.831** 0.831**
0.116 0.114 -0.757** 0.607** -0.755** 0.601**
-0.041 -0.041
-0.378** 0.511** -0.378** 0.506**
-0.332** 0.832** -0.328** 0.831**
-0.117 -0.115
-0.0778 -0.075
-0.458** 0.593** -0.444** 0.574**
0.172 0.164
-0.488** 0.433** -0.475** 0.423**
1.000 1.000
1.000 1.000
-0.199 -0.198
1.000 1.000
-0.509** -0.502**
0.281* 0.277*
0.391** -0.809** 0.692** 0.386** -0.802** 0.682**
0.250* 0.250*
-0.092 -0.091
-0.069 -0.069
0.010 0.009
0.302** 0.298*
0.110 0.109
0.162 0.158
0.213 0.206
-0.131 -0.133
-0.257* -0.521** 0.378** -0.245* -0.505** 0.360**
0.382** 0.353**
0.421** 0.410**
X14
228 A.Ruth Beulah Rani and D.Veeraragavathatham
Days to G first flowering P
Days to G 50% flowering P
Length of fruit
Girth of fruit
Fruit weight
Number of fruits per plant
Number of seeds per fruit
Thousand seed weight
Ascorbic acid G content P
Capsaicin content
Total phenol content
OD phenol content
Percent disease G index P
Marketable fruit yield per plant
X3
X4
X5
X6
X7
X8
X9
X10
X11
X12
X13
X14
X15
Y
1.000 1.000
X1
* Significant at 5 per cent level,
G P
G P
G P
G P
G P
G P
G P
G P
G P
G P
G P
Number of branches per plant
X2
G P
Plant height
X1
Character
1.000 1.000
0.127 0.105
0.072 0.057
X3
1.000 1.000
0.781** 0.673**
0.294* 0.262*
0.318** 0.287*
X4
-0.228 -0.220
0.266* 0.227
0.095 0.067
X5
1.000 1.000
-0.289* -0.256*
** Significant at 1 per cent level.
1.000 1.000
0.669* 0.684**
X2
1.000 1.000
-0.381** -0.358**
0.676** 0.628**
0.421** 0.395**
0.202 0.190
0.261* 0.249*
X6
1.000 1.000
0.718** 0.691**
-0.128 -0.117
0.665** 0.606**
0.344** 0.336**
0.591** 0.550**
0.549** 0.516**
X7
1.000 1.000
0.016 0.018
-0.052 -0.053
0.471** 0.450**
-0.256* -0.230
-0.367** -0.345**
0.364** 0.339**
0.218 0.201
X8
0.380** 0.362**
0.274* 0.261*
0.252* 0.241*
X10
0.217 0.214
-0.145 -0.142
1.000 1.000
0.083 0.082
1.000 1.000
0.139 0.136
-0.045 -0.044
0.835** 0.391** 0.841** 0.381**
0.682** 0.656**
-0.140 -0.130
0.489** 0.437** 0.441** 0.415**
0.158 0.166
0.552** 0.516**
0.439** 0.415**
X9
0.481** 0.471**
0.364** 0.357**
0.135 0.119
0.357** 0.335**
0.495** 0.472**
0.435** 0.418**
0.422** 0.402**
X12
1.000 1.000
0.125 0.125
0.149 0.145
1.000 1.000
0.406** 0.404**
0.258* 0.258*
0.330** 0.324**
0.414** 0.368** 0.410** 0.361**
0.086 0.083
0.102 0.101
0.196 0.189
0.217 0.204
0.301* 0.286*
0.225 0.215
0.137 0.130
X11
1.000 1.000
0.814** 0.800**
0.417** 0.410**
0.143 0.141
0.331** 0.321**
0.383** 0.374**
0.422** 0.409**
0.223 0.223
0.279* 0.254*
0.324** 0.307**
0.323** 0.299*
0.589** 0.570**
0.535** 0.513**
X13
0.196 0.177
0.432** 0.402**
0.208 0.208
0.601** 0.566**
0.568** 0.542**
Y
-0.245* -0.236*
0.796** 0.799**
-0.358** 0.550** -0.346** 0.531**
-0.178 -0.169
-0.276* -0.262*
-0.350** -0.331**
-0.289* -0.279*
-0.263* -0.251*
X15
1.000 1.000
0.148 0.144
0.153 0.150
0.115 0.133
0.024 0.025
-0.297* -0.268*
0.270* 0.266**
0.651** 0.659**
1.000 1.000
0.096 0.093
1.000 1.000
-0.578** -0.565**
0.130 0.135
-0.806** 0.701** -0.793** 0.682**
-0.802** 0.781** -0.796** 0.770**
-0.449** 0.377** -0.448** 0.370**
-0.139 -0.138
-0.209 -0.203
0.314** -0.353** 0.541** 0.308** -0.348** 0.527**
-0.161 -0.138
-0.168 -0.156
0.162 0.155
-0.133 -0.140
-0.023 -0.004
-0.180 -0.168
0.111 0.110
X14
Table 2. Genotype (G) and phenotypic (P) correlation between marketable fruit yield and other traits (Reciprocal crosses)
Correlation studies in chillies (Capsicum annuum L.) 229
230
A knowledge of inter correlations among the yield contributing characters is equally important as that of association between yield and its components, because the improvement of one component influences the related component. All the traits studied were negatively associated with disease index except fruit length in direct crosses and orthodihydroxy phenol in reciprocal crosses. This again confirms that orthodihydroxy phenol imparts resistance only due to the cytoplasmic genes in resistant donors. But in both set of crosses, total phenol (-0.809 and -0.806 in direct and reciprocal crosses) was found to be negatively associated with disease incidence suggesting that total phenol plays a significant role in reducing disease incidence than orthodihydroxy phenol and the reaction of genotypes as resistant or susceptible could depend on the relative content of total phenol in plants. Supporting evidence is obtained from the results of Bhullar et al. (1972), Narain and Mahapatra (1973), Azad (1991) and Borua and Das (2000). In the present study the two resistant hybrids S1n 1 x Ujwala and S1n 2 x CC 4 obtained from direct crosses had exhibited lesser fruit length. Except this, improvement of all other traits under study can reduce the incidence of disease and thereby increase the marketable fruit yield per plant. The biotic stresses induced by the pathogen alter the chemical constituents of the fruit resulting in reduction of ascorbic acid and capsaicin (Narain and Das, 1970; Azad, 1991; Jeyalakshmi et al., 1999). Thus resistant hybrids were found to possess high capsaicin and ascorbic acid contents and these traits were positively associated with total phenol content which imparts resistance. This paves way for simultaneous selection for yield, quality and resistance. Number of seeds and seed weight were positively related and improvement in these
A.Ruth Beulah Rani and D.Veeraragavathatham
traits increased capsaicin and total phenol contents resulting in more marketable fruit yield. Since capsaicin is mainly present in the placenta, more number of seeds and seed weight would have created better placental weight thereby enhancing the total capsaicin content of fruits. This is in line with the findings of Anandanayaki (1997) and Malathi (2001). Thus all the growth and fruit characters except fruit length had positive association with resistance traits besides being positively inter correlated among themselves. Fruit length and girth were negatively associated (Sundaram, 1992). In the direct crosses days to flowering was negatively correlated with ascorbic acid content (-0.326) which had been reported earlier by Manikantan Nair et al. (1984) and also with number of fruits (-0.367) in reciprocal crosses. In such situations when flowering is delayed though the number of fruit is lesser, the girth is more thereby yield is not affected. References A.O.A.C. (1970). Official methods of analysis. Eleventh ed. Association of Analytical Chemists, Washington, D.C. pp. 777-778. Anandanayaki, D. (1997). Genetic studies of yield and quality parameters in chilli (Capsicum annuum L.) through diallel analysis. M.Sc. (Hort.) Thesis, Tamil Nadu Agric. Univ., Coimbatore, India. Azad. (1991). Fate and role of chemical constituents of chilli fruits during infection with Colletotrichum capsici. Indian Phytopath., 44: 129-131. Bhullar, B.S., Bajaj, K.L. and Bhatia, I.S. (1972). Studies on the phenols of resistant and susceptible varieties of chillies in relation to anthracnose disease. Phytopath. Z., 75: 236-240. Borua, I. and Das, D. (2000). Changes in activities of polyphenol oxidase, acid phosphatase
Correlation studies in chillies (Capsicum annuum L.)
231
and phenol content in developing chilli varieties susceptible and resistant to Colletotrichum capsici. Crop Res., 19(2): 230—234.
Panse, V.G. and Sukhatme, P.V. (1957). Statistical Methods for Agricultural workers. Indian Council of Agricultural Research, New Delhi, pp. 97.
Bray, H.G. and Thrope, W.V. (1954). Analysis of phenolic compounds of interest in metabolism. Meth. Biochem. Anal., 1: 27 - 52.
Sadasivam, S. and Manickam, A. (1992). Biochemical methods for agricultural sciences, Wiley Eastern Limited, Madras, pp. 201.
Jeyalakshmi, C., Seetharaman, K. and Ebenezer, E.G. (1999). Qualitative losses of chilli fruits due to infection by Colletotrichum capsici (Syd.) Butler and Bisby. Capsicum and Egg Plant Newsl., 18: 80-82. Johnson, W.W., Robinson, H.F. and Comstock, R.E. (1955). Genotypic and phenotypic correlation in soybeans and their implications in selection. Agron. J., 47: 477-482. Kalloo, G. (1988). Vegetable Breeding, Vol. I. C.R.C. Press. Inc. Boca Raton, Florida, pp. 105-128. Mahadevan, A. and Sridhar, R. (1982). Methods in Physiological Plant Pathology. 2nd ed. Sivakami Publications, Madras, p. 316. Malathi, G. (2001). Performance of two F1 hybrids and their parents in chilli (Capsicum annuum L.) in three different seasons. M.Sc. (Hort.). Thesis, Tamil Nadu Agric. Univ., Coimbatore, India. Manikantan Nair, P., Mary, K.G., Mohanakumaran, N., Nair, V.G. and Saraswathy, P. (1984). Studies on correlation and path analysis in Capsicum annuum L. South Indian Hort., 32: 212-218. Narain, A. and Mahapatra, B.N. (1973). Factors controlling the resistance of chilli leaves to Colletotrichum capsici. Indian Phytopth., 26: 364-365. Narain, A. and Das, D.C. (1970). Toxin production during pathogenesis of Colletotrichum capsici causing anthracnose of chillies. Indian Phytopath., 23: 484-490.
Saraladevi, D. and Arumugam, R. (1999). Correlation and path coefficient analysis in chilli (Capsicum annuum L.). Crop Res., 17(1): 90-93. Shah, A.S., Lai, D. and Pant, C.C. (1988). Correlation and path coefficient analysis in chillies. Prog. Hort., 20(3-4): 219-223. Singh, N.B. and Singh, B. (1970). Interrelationship, heritability estimate and genetic advance in yield and other characters in chillies. Madras Agric. J., 57(7): 369-372. Snedecor, G.W. and Cochran, C.W.G. (1967). Statistical methods. The Iowa State University Press, IOWA, USA. Sundaram, V. (1992). Evaluation of F3 and F4 generation for genetic enhancement of yield in sweet pepper (Capsicum annuum L.). M.Sc.(Hort.) Thesis, Tamil Nadu Agric. Univ., Coimbatore, India. Thakur, P.C. (1993). Correlation studies in sweet pepper (Capsicum annuum L.). Capsicum Newsl., 12: 55-56. Thangaraj, T. (1984). Studies on the evaluation of biparental and F3 progenies in chilli. Ph.D. (Hort.) Thesis, Tamil Nadu Agric. Univ., Coimbatore, India. Vadivel, E. (1987). An evaluation of genetic parameters and study of gene action in chilli (Capsicum annuum L.). Ph.D. (Hort.) Thesis, Tamil Nadu Agric. Univ., Coimbatore, India. Wheeler, B.E.J. (1969). An introduction to plant diseases. John Wiley and Sons Ltd., London, pp. 301.