Madras Agric. J., 94 (7-12) : 174-178 July-December 2007
Trait association and path coefficient analysis for yield attributing traits in sesame (Sesamum indicum L).
and yield
P. SUMATHI, V.MURALIDHARAN AND N.MANIVANNAN Centre for Plant breeding and Genetics, Tamil Nadu Agricultural University, Coimbatore-641003,
Abstract: An experiment was conducted with eighty branched and non branching sesame genotypes to study the association between the yield and yield attributing traits. Observations were recorded on eight traits viz., days to 50 per cent flowering, days to maturity, plant height, number of branches per plant, number of capsules per plant, 100 seed weight, grain yield per plant and oil content. In general the genotypic correlation coefficients were slightly higher than the phenotypic correlation coefficients, indicating the masking effect of the environment in the total expression of the genotypes. Plant height and number of capsules per plant showed significant and positive correlations with single plant yield at both genotypic and phenotypic levels. The trait plant height and number of capsules per plant showed positive correlation with all the other traits except 100 seed weight where as number of branches per plant showed negative correlation to oil content. The character number of capsules per plant showed high positive direct effects on grain yield per plant. The indirect effect of number of capsules per plant on grain yield through plant height, number of branches per plant, oil content and days to maturity was high. Key words: Sesame, grain yield, genotypic correlation coefficient and path analysis
Introduction Sesame (Sesamum indicum L.) is one of the important oilseed crops in India. Sesame oil is characterized for its stability and quality. Sesame oil is used as a cooking- oil in southern India. So the production of this important oilseed crop has to be stepped up by evolving a high yielding variety. Yield is a complex quantitative trait, greatly influenced by environmental fluctuations. A study of nature and degree of association of component characters with yield assumes greater importance for fixing up characters that play a decisive role in influencing yield. Correlation coefficient analysis measures the mutual relationship between various characters and is used to determine the component character on which selection can be done for improvement in yield. Path coefficient analysis permits the
separation of direct effects from indirect effects and gives more realistic relationship of the characters and helps in effective selection. With this view a study was conducted with eighty branched and non branching sesame genotypes to determine the association between yield and yield components in segregating generation. Material and Methods Eighty branched and non branching sesame genotypes were collected from different sources and taken for the study. The crop was raised during kharif, 2003 at the Department of Oilseeds, Centre for Plant Breeding and Genetics, TNAU, Coimbatore in a randomized block design with three replications. Each plot consisted of two rows of 4m length spaced at 30 cm between rows and 15 cm between
G P
G P
G P
G P
G P
G P
G P
G P
Days to 50% flowering
Plant height (cm)
No.of branches per plant
No.of capsules per plant
100 seed weight (g)
Oil content (%)
Days to maturity
Grain yield per plant (g)
1.000 1.000
0.135 0.125
Plant height (cm)
1.000 1.000
0.282 0.279
0.520 0.477
No.of branches per plant
** Significance at P = 1% level
1.000 1.000
Days to 50% flowering
* Significance at P = 5% level ;
d
Characters
1.000 1.000
0.364 0.355
0.903** 0.888**
0.116 0.107
No.of capsules per plant
1.000 1.000
-0.033 -0.026
0.154 0.151
-0.103 -0.096
-0.067 -0.068
100 seed weight (g)
1.000 1.000
0.043 0.043
0.411 0.401
-0.074 -0.063
0.418 0.404
-0.057 -0.055
Oil content (%)
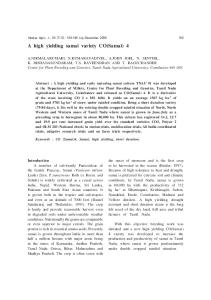
Table 1. Genotypic (G) and Phenoypic (P) Correlation Coefficients between different characters in sesame
1.000 1.000
0.189 0.187
-0.005 -0.006
0.341 0.333
0.559 0.524
0.437 0.427
0.642* 0.632*
Days to maturity
1.000 1.000
0.328 0.323
0.433 0.427
0.162 0.164
0.898** 0.891**
0.411 0.392
0.767** 0.757**
0.064 0.062
Grain yield per plant (g)
Trait association and path coefficient analysis for yield and yield attributing traits in sesame (Sesamum indicum L). 175
P. Sumathi, V.Muralidharan and N.Manivannan
0.064 0.767** 0.411 0.898** 0.162 0.433 0.328 Residual effect =
0.3695
Bold figures are direct effects
** Significant at P = 0.01
-0.07 -0.09 0.06 0.34 -0.0007 0.02 0.071 0.006 -0.084 -0.008 0.409 0.006 0.09 0.013 0.007 0.02 0.02 -0.03 0.15 0.003 -0.0004 Days to 50% flowering Plant height (cm) No.of branches per plant No.of capsules per plant 100 seed weight (g) Oil content (%) Days to matuirity
-0.11 -0.03 0.06 0.12 -0.01 -0.01 0.05
-0.02 -0.21 0.031 0.99 -0.02 0.04 0.03
-0.06 -0.06 0.11 0.36 0.02 -0.01 0.04
-0.01 -0.18 0.04 0.997 -0.005 0.04 0.02
Oil content (%) 100 seed weight(g) No.of capsules per plant No.of branches per plant Plant height (cm) Days to 50% flowering Characters
Table 2. Direct and indirect effects of different characters towards grain yield at genotypic level in Sesame
Days to maturity
Grain per plant yield (g)
176
plants. Normal recommended cultural practices and plant protection measures were followed. Five competitive plants were randomly selected for recording biometrical measurements on eight traits viz., days to 50 per cent flowering, days to maturity, plant height, number of branches per plant, number of capsules per plant, 100 seed weight, grain yield per plant and oil content. Correlation coefficients for yield and yield components were evaluated utilizing the formula suggested by Al-jibouri et al. (1958). Further partitioning of correlations into direct and indirect effects by path coefficient analysis was estimated by using the procedure suggested by Dewey and Lu (1959). Results and Discussion In general the genotypic correlation coefficients were slightly higher than the phenotypic correlation coefficients, indicating the masking effect of the environment in the total expression of the genotypes (Table 1). Such results are in concurrence with the results of Ganesh and Sakila (1999). The characters, plant height and number of capsules per plant showed significant and positive correlations with single plant yield at both genotypic and phenotypic levels. Similar results were reported by Pawar et al. (2002) and Deepa Sankar and Ananda Kumar (2003) for plant height and number for capsules per plant and Rami Reddy Kumar and Sundaram (2002) for number of capsules per plant. The grain yield was positively correlated with all the other traits but non significant. The information on the inter correlation between the yield contributing traits showed the nature and extent of their relationship with each other. This will be thelpful for the simultaneous improvement of different characters along with the seed yield in
Trait association and path coefficient analysis for yield and yield attributing traits in sesame (Sesamum indicum L).
breeding programmes. Days to 50 per cent flowering had positive correlation with all the other traits except 100 seed weight and oil content both at genotypic and phenotypic level, they showed negative correlation but non significant. The traits plant height and number of capsules per plant showed positive correlation with all the other traits except 100 seed weight where as number of branches per plant showed negative correlation to oil content. Backiyarani et al. (1999) reported positive correlation between number of branches and number of capsules per plant. Negative association may occur due to the competition of two developing structures of the plant for limited measures like nutrient and water supply (Adams, 1967). Newell and Eberhart (1961) were of the view that it would be difficult to exercise simultaneous selection for the characters which show negative association with each other. The results of path coefficient analysis based on the genotypic correlation coefficient are presented in table. 2. The character number of capsules per plant showed high positive direct effects on grain yield per plant. The traits number of branches and 100 seed weight showed positive but low direct effects on grain yield per plant. The direct effect of oil content and days to maturity on grain yield was negligible. The indirect effect of plant height, days to 50 per cent flowering, number of branches per plant, 100 seed weight, oil content and days to maturity via other traits was not considerable, but the indirect effect of number of capsules per plant on grain yield through plant height, number of branches per plant, oil content and days to maturity was high.
177
In the present study, the residual effect (0.37) was high in magnitude which showed that some other important yield contributing characters which contributed to yield had to be included. From the above results, it could be inferred that the characters, number of capsules per plant and plant height were to be given prime importance as they revealed a significant positive correlation coefficient and a high positive direct effect compared to other traits. References Adams, M.W. (1967). Basis of compensation in crop plants with special reference to field bean (Phaseolus vulgaris). Crop Sci., 7: 505-510. Aljibouri, H.A., Miller, P.A. and Robinson, H.P. (l985).Genotypic and environmental variances and covariances in upland cotton cross of interspecific origin. Agron. J., 50: 633-36. Backiyarani, S., Subramanian, M. and Shanthi, S. (1999). Character association and path coefficient analysis in segregating generations of sesame (Sesame indicum L.). Crop Res., 18: 251-255. Deepa Sankar, P. and Ananda Kumar, C.R. (2003). Genetic analysis of yield and related components in sesame (Sesamum indicum L.) Crop Res., 25(l) : 91-95. Dewey, D.R. and Lu, K.H. (1959). A correlation and path coefficient analysis of components of crested wheat grass seed production. Agron. J., 51: 515-18. Ganesh, S.K. and Sakila, M. (1999). Association analysis of single plant yield and its yield contributing characters in sesame (Sesamum indicum L.) Sesame and Safflower Newsl., 14 : 15-17.
178
Mishra, A.K. and Yadav, L.N. (1998). Association analysis of different populations of sesame. Sesame and Safflower Newsl., 13 : 55 - 62. Newell, L.C. and Eberhart, S.A. (1961). Clone and progeny evaluation in the improvement of switch grass (Panicum virgatum L). Crop Sci., l: 117-121.
P. Sumathi, V.Muralidharan and N.Manivannan
Pawar, K.N., Chetti, M.B. and Shamrao Jahagirdar, (2002). Association between seed yield and yield attributing characters in sesamum (Sesamum indicum L.) Agri. Sci. Digest, 22(1) : 18-20. Rami Reddy Kumar, A. and. Sundaram, T. (2002). Inter relationships among yield and yield components in sesame (Sesamum indicum L.) J. Res. ANGRAU, 30 (2) : 42-44.