Modelling Lean ITIL in EPF Juliana Isabel Marques Pantaleão, nº 54288
Dissertação para obtenção de Grau de Mestre em
Engenharia Informática e de Computadores
Júri Presidente: Orientadores: Professor Doutor Miguel Leitão Bignolas Mira da Silva Engenheira Ana Paula Valente Vogal:
Maio 2010
I
ACKNOWLEDGEMENTS I would like to show gratitude to a great deal of people who helped me get ahead of all the obstacles that appeared during the last year. I would like to express my gratitude to my supervisor, Prof Dr. Miguel Mira da Silva, whose expertise, motivation, encouragement, understanding and patience, added considerably to my graduate experience. I would like to thank my co-supervisor, Eng. Ana Paula Pereira for her guidance, vision and knowledge that supported me in all phases of this research work. I would also like to thank my parents and sister for the support they provided me through my entire life and in particular, I must acknowledge my best friend, Ricardo, without whose love, encouragement and editing assistance, I would not have finished this thesis.
II
ABSTRACT Many organizations have already implemented Information Technology Infrastructure Library (ITIL) in order to control and manage their Information Technology (IT) Departments more effectively. ITIL is a public framework that describes best practices in IT Service Management, with specially attention on the continual measurement and progress of the quality of IT service delivered. However, organizations are now focused on continually improving of their ITIL processes in order to become even more efficient. Lean is a methodology that can be used to drive the ITIL services and their improvement through a process of reduction of waste. Understand how Lean should be applied to the ITIL v3 processes is the main objective of this work. After a research phase about these two methodologies, it was developed a modeling process of Lean practices applied to ITIL v3 processes - Lean Information Technology Infrastructure Library (LITIL) used Eclipse Process Framework Composer (EPFC) tool that is able to formalize and describe all types of processes in an agile way. According with LITIL, it was developed a case study in a private organization in order to discover improvement opportunities in value‟s delivery process. The results showed that Lean can be applied to the processes of ITIL v3 and also that this cooperation contributes directly to reducing waste in order to make organizations more efficient.
KEYWORDS Lean, ITIL, Information Technology, Modeling, Customer, Value, Waste, Improvement, Quality.
III
RESUMO Actualmente, são já muitas as organizações que implementaram ITIL de forma a controlar e gerir mais eficazmente os seus departamentos de Tecnologias de Informação. ITIL é uma Framework pública de boas práticas de gestão de Tecnologias de Informação, com especial enfoque na melhoria contínua dos serviços entregues aos clientes. Com vista a acompanharem as constantes alterações de negócio, as organizações estão agora concentradas na melhoria contínua dos processos de ITIL previamente implementados. A metodologia Lean pode ser aplicada aos processos de ITIL de modo a promover directrizes para uma melhoria contínua através da redução de desperdícios. Perceber como é que a metodologia Lean deverá ser aplicada aos processos ITIL v3 de modo a melhorá-los continuamente representa o principal objectivo deste trabalho. Após uma fase de investigação das metodologias, foi desenvolvido um modelo cooperativo entre a metodologia Lean e os processos de ITIL v3 intitulada Lean Information Technology Infrastructure Library (LITIL). Para modelar este processo foi utilizada a ferramenta Eclipse Process Framework Composer (EPFC), capaz de formalizar e descrever todo o tipo de processos de forma ágil. No âmbito do processo modelado, foi realizado um estudo numa organização privada de modo a evidenciar eventuais oportunidades de melhoria no desenvolvimento de valor para o cliente. Os resultados obtidos permitem concluir que a metodologia Lean pode ser aplicada aos processos de ITIL v3, esta cooperação contribui ainda directamente para a redução de desperdícios e maior eficácia dos mesmos.
PALAVRAS-CHAVE Lean, ITIL, Tecnologias de Informação, Modelação, Cliente, Valor, Desperdício, Qualidade.
IV
V
TABLE OF CONTENTS ACKNOWLEDGEMENTS ........................................................................................................................... II ABSTRACT ............................................................................................................................................... III KEYWORDS ......................................................................................................................................... III RESUMO ................................................................................................................................................. IV PALAVRAS-CHAVE............................................................................................................................... IV TABLE OF CONTENTS .............................................................................................................................. VI LIST OF TABLES ..................................................................................................................................... VIII LIST OF FIGURES ..................................................................................................................................... IX ACRONYMS AND ABBREVIATIONS ......................................................................................................... XI 1
2
INTRODUCTION ........................................................................................................................... - 1 1.1
PROBLEM ............................................................................................................................. - 2 -
1.2
RESEARCH METHODOLOGY ................................................................................................. - 3 -
1.3
THESIS STRUCTURE .............................................................................................................. - 4 -
RELATED WORK ........................................................................................................................... - 6 2.1
ITIL ....................................................................................................................................... - 6 -
2.2
LEAN .................................................................................................................................... - 7 -
2.2.1
Types of Waste ............................................................................................................ - 8 -
2.2.2
Lean Practices .............................................................................................................. - 9 -
2.2.3
Lean Design ............................................................................................................... - 11 -
2.3
CASE STUDIES .................................................................................................................... - 13 -
2.3.1
Lean Six Sigma and ITIL by ISQ and SQS .................................................................... - 13 -
2.3.2
Applying Lean to the ITIL v3 Event Management Process ........................................ - 14 -
2.4
EPF COMPOSER ................................................................................................................. - 15 -
2.4.1
Method Content Versus Process ............................................................................... - 16 -
2.4.2
Why EPF? ................................................................................................................... - 17 -
3
PROPOSAL ................................................................................................................................. - 19 -
4
IMPLEMENTATION .................................................................................................................... - 22 4.1
LEAN LIBRARY .................................................................................................................... - 22 -
4.2
ITIL LIBRARY ....................................................................................................................... - 23 -
4.3
LITIL LIBRARY ..................................................................................................................... - 24 -
4.3.1
Demand Management............................................................................................... - 27 -
4.3.2
Service Portfolio Management.................................................................................. - 27 VI
5
4.3.3
Service Catalogue Management ............................................................................... - 27 -
4.3.4
Service Level Management ....................................................................................... - 28 -
4.3.5
Capacity Management .............................................................................................. - 28 -
4.3.6
Supplier Management ............................................................................................... - 28 -
4.3.7
Service Validation and Testing .................................................................................. - 29 -
4.3.8
Release and Deployment Management .................................................................... - 29 -
4.3.9
Incident Management ............................................................................................... - 30 -
4.3.10
Service Reporting ...................................................................................................... - 30 -
ACTION ...................................................................................................................................... - 33 5.1
5.1.1
COMMERCIAL DEPARTMENT .................................................................................... - 33 -
5.1.2
SERVICES DEPARTMENT ............................................................................................ - 34 -
5.1.3
SUPPORT DEPARTMENT ............................................................................................ - 35 -
5.2 6
IDENTIFIED PROBLEMS ...................................................................................................... - 44 -
6.1.1
APPROVAL WORKFLOW ............................................................................................ - 44 -
6.1.2
TWO SLA AND POOR INFORMATION SHARING......................................................... - 44 -
6.1.3
NO EXECUTION OF THE SERVICE REPORTING PROCESS ............................................ - 45 -
CONCLUSION ............................................................................................................................. - 47 7.1
8
ITIL METRICS IN CASE STUDY ............................................................................................. - 36 -
EVALUATION AND LEARNING .................................................................................................... - 38 6.1
7
AS-IS VALUE FLOW ............................................................................................................ - 33 -
FUTURE WORK................................................................................................................... - 47 -
REFERENCES .............................................................................................................................. - 49 -
VII
LIST OF TABLES Table 1: Critical Analysis – ITIL and Lean Six Sigma Methodology .................................................... - 13 Table 2: Critical Analysis – LEAN Principles Identified in Event Management Improvement ........... - 15 Table 3: Action Research’s Phase and objectives.............................................................................. - 20 Table 4: Association of Lean Principles and Practices modeled in EPF Composer............................ - 22 Table 5: Classification of ITIL processes ............................................................................................ - 25 Table 6: LITIL processes and its ITIL Lifecycle Stage .......................................................................... - 26 Table 7: LITIL processes and its adoption reasons ............................................................................ - 31 Table 8: Workflow Phases of Project 1 and its dates ........................................................................ - 38 Table 9: Lead and Cycle Time for Project 1 ....................................................................................... - 39 Table 10: Workflow Phases of Project 2 and its dates ...................................................................... - 40 Table 11: Lead and Cycle Time for Project 2 ..................................................................................... - 41 Table 12: Workflow Phases of Project 3 and its dates ...................................................................... - 42 Table 13: Results for Project 3........................................................................................................... - 43 -
VIII
LIST OF FIGURES Figure 1 – Action Research Methodology ........................................................................................... - 3 Figure 2 – ITIL [14] ............................................................................................................................... - 7 Figure 3 – Lean Design....................................................................................................................... - 12 Figure 4 – Goals and Problems in Infosys Event Management Process ............................................ - 14 Figure 5 – EPF Context Overview ...................................................................................................... - 16 Figure 6 – Method Content and Process Examples in EPF ................................................................ - 17 Figure 7 – EPF Conceptual Architecture ............................................................................................ - 18 Figure 8 – Proposed Solution ............................................................................................................ - 19 Figure 9 – Architecture’s Solution ..................................................................................................... - 19 Figure 10 – Lean Design in EPF Composer ........................................................................................ - 23 Figure 11 – Types of Guidance used in ITIL Library [27] .................................................................... - 23 Figure 12 – ITIL Design in EPF Composer .......................................................................................... - 24 Figure 13 – Value Stream Mapping for LITIL Process ........................................................................ - 32 Figure 14 – Principal Areas of Value Development in Organization ................................................. - 33 Figure 15 – LITIL vs Case Study .......................................................................................................... - 37 Figure 16 – Chart of Project 1 Timeline and its Phases ..................................................................... - 39 Figure 17 - Chart of Project 2 Timeline and its Phases ...................................................................... - 41 Figure 18 - Chart of Project 3 Timeline and its Phases ...................................................................... - 42 Figure 19 – Problem Identified: Lack communication between areas .............................................. - 45 Figure 20 – Problem Identified - No validation of the SLA after the end of the project ................... - 46 Figure 21 – Post placed on the discussion forum of EPF Composer ................................................. - 48 -
IX
X
ACRONYMS AND ABBREVIATIONS ITIL
Information Technology Infrastructure Library
IT
Information Technology
LITIL
Lean Information Technology Infrastructure Library
EPF
Eclipse Process Framework
EPFC
Eclipse Process Framework Composer
ISQ
Instituto de Soldadura e Qualidade
SQS
Software Quality Systems
DMAIC
Define, Measure, Analyze, Improve, Control
ICOV
Identify, Characterize, Optimize, Verify
OMG
Object Management Group
UML
Unified Model Language
SPEM
Software Process Engineering Metamodel
Open UP
Open Unified Process
XP
Extreme Programming
RUP
Rational Unified Process
DSDM
Dynamic Systems Development Method
MDA
Model-driven Architecture
TOGAF
The Open Group Architecture Framework
RVA
Real-Value-Add
BVA
Business-Value-Add
NVA
Non-Value-Add
SLA
Service Level Agreement
RFP
Request for Proposal
CMMI
Capability Maturity Model Integration
SAM
Supplier Agreement Management
XI
1 INTRODUCTION After World War II, Japan launched a methodology for reducing waste called Lean, which is currently very popular in organizations that want to be more efficient with fewer costs and with more value to the customer.
Lean is based on five values, such as:
Specify what represents value to the customer;
Identify all specific actions required to bring a product or service from order to delivery;
Eliminate all kinds of non-value adding activities;
Produce only what the customers need;
Pursue perfection.
All these principles allow a systematic and continuous improvement, based mainly on eliminating waste and improving production flows that enable the reduction of a set of resources (human effort, space, manufacturing, inventory, percentage of defects and time spent on developing new products). This methodology is focused on the value stream that originates the product, aiming at maximizing value and eliminating waste, optimizing the whole and not just the parts of the process which is only possible by increasing the process speed [1].
While Lean is focused on product development management, operations, customer value and suppliers, the constant concern of ITIL is the IT service management. ITIL is a framework of best practices for delivering IT Services. It was published between 1989 and 1995 by the British Office of Government Commerce in order to efficiency in the delivery of programs and projects in the public sector [2]. The initial version of ITIL consisted of a library of 31 associated books covering the description of the most important processes in an IT organization, including checklists for tasks, procedures and responsibilities which can be used as basis for organizational needs satisfaction [3]. In 2007, it was published the third version of ITIL, that contains only five core books. These books analyze each one of the services supported by ITIL - Service Strategy, Service Design, Service Transition, Service Operation and Continual Service Improvement.
Nowadays, ITIL is seen as a guarantee for better quality of services, lower costs and improved alignment between business and IT. IT Managers are been pressured to implement it. Although, it was originally developed to be used in manufacturing processes, Lean can also improve the ITIL implementation and today there are already some success cases about its application in Service Desks. In this time of economic crisis, Lean practices can provide guidance for the hard task of ITIL implementation, in order to improve IT processes, making them more effective and efficient. The
-1-
proposal of this thesis is to develop a Lean process modeling on ITIL Services, applying Lean principles
and
practices
to
the
five
stages
of
ITIL
lifecycle,
in
EPF.
1.1 PROBLEM Nowadays, many organizations are concerned with reducing costs without sacrificing what represents value to the customer. Understanding what can be improved is not simple and conducting the improvements is even harder. Today, many companies have already implemented some ITIL processes in order to improve the management of their IT Departments. Promote the continuous service improvement is not a simple task; organizations that already implement ITIL have difficulty to ensure the improvement of processes. Even the Continuous Service Improvement book of ITIL v3 presents a small section for implementation of processes improvements
[4]. In the same way that organizations need help for implement ITIL, they need a guidance that provides a clear and specific roadmap to continuously improve what already have been done. This guidance can be supplied through the application of the Lean practices to ITIL services [5]. The main problem focuses in fact that Lean was developed to be used in manufacturing processes and only now begun to be applied in IT services management. The novelty of this challenge requires a clear study of Lean practices in order to apply it in corrected services of ITIL. The managers need to understand which practices satisfy the principles of this methodology, how do they do it and how these relations allow the reduction of waste. However, achieve this overview it is not a simple task. Currently there is much information about Lean but this information is described in a way that makes difficult to obtain an overview of the relations between its concepts. It is also important to keep improving the processes always aiming to align the IT departments with business. Because business is not static, IT Departments must be aware and prepared for organizational changes. This is another important motivation for IT Departments to continuously improve their processes. But once again, the information provided by ITIL documentation is not detailed enough to establish a guidance to improve the implemented processes. And in this way, Lean can help again with their principles and practices. Managers only must provide a clear study of these two methodologies to understand where Lean can be applied to ITIL. With all the organizational and managing changes, the resistance to change is another problem that can appear. It is important how this resistance can be mitigated, assuring that a process can effectively be improved and that once it was, there is no coming back. The main problem that this thesis is proposed to resolve can be summarized in the following sentence:
Organizations want to improve their ITIL Services with Lean principles but they do not know how.
-2-
In order to overcome this problem, the main objectives of this thesis are focus on realize what Lean can offer to ITIL v3 for establishing a cooperation of optimization services between these two methodologies. The resulting process will be entitled LITIL, this name follows the composition of two words represented by the name of the methodologies in study, Lean and ITIL.
1.2 RESEARCH METHODOLOGY The research methodology that will be used in the development of this thesis is the Action Research. In the end of 1990‟s, action research grew in educated investigations of information systems, although it initially was focused on a research method for the social and medical sciences. This methodology is based on a systematic and iterative process, which promotes the introduction of changes in the processes by observing the effects of these changes. The knowledge acquired in each iteration can put into practice in the next one [6]. In an ideal domain of this method, the researcher is highly involved, having benefits for him and the organization. Action Research has five stages that must be executed iteratively – Diagnosing, Action Planning, Action Taking, Evaluation and Specifying Learning. The sequence of these stages, which perform the Action Research cycle, is represented in Figure 1.
Diagnosing
Specifying Learning
Action Planning
Evaluating
Action Taking
Figure 1 – Action Research Methodology
Each of these stages has the following characteristics: Diagnosing – Identifies the most visible problems that are responsible for the desire of organization change, it is at this stage that a theory about nature of problems is developed. This stage corresponds to an analysis of the current situation in the area.
-3-
Action Planning – Specifies the actions to solve the first problems found, plans the proposal solution, its steps and tool development; Action Taking – Implementation of the actions outlined in the previous stage; Evaluation – After finishing the actions, the researcher and the participants evaluate the results. This evaluation checks if the expected effects in theory have been put into practice and whether the problems were solved. The theory should be adjusted in the next iteration process in case of persisting problems. It corresponds to the evaluation of the proposal solution. Specifying Learning – After assessing the proposal solution, is checked if the problem is solved, specifying the learning taken from its implementation. For all the features listed, the Action Research Methodology was chosen for development of this thesis. This methodology was chosen also because it is able to produce relevant research results in practical environments with a carefully informing theory [7] [8]. This thesis will require at least an iteration of the Action Research cycle that should be performed in the IT Department of a Portuguese private organization.
1.3 THESIS STRUCTURE This document is divided in six main chapters: 1. Introduction: This chapter focuses on the general context which the theory fits, the methodology used in research, the problems and objectives proposed for this thesis. 2. Related Work: The second chapter identifies the methodologies‟ context – Lean and ITIL – and their basic concepts, discusses two case studies developed in problem‟s context covered in this thesis and also analyzes the tool used for develop this work – EPF Composer – and the reason for their choice. The problem described in Introduction and analysis around the Related Work includes the Diagnosis stage of Action Research. 3. Proposal: Presents the initial proposal and how it relates to the modeling tool chosen. This chapter also presents the goals proposed for each stage of Action Research methodology. 4. Implementation: The fourth chapter explores all the decisions and activities undertaken during the implementation of proposal. These last two chapters – Proposal and Implementation - include the Action Planning stage of Action Research.
-4-
5. Action: The fifth chapter describes the experience and main activities in the analysis of the value stream in a private organization. This chapter includes the Action Taking stage of Action Research. 6. Evaluation and Learning: The sixth chapter provides an analysis of the results obtained in the case study. According to these results are described improvement proposals to be adopted in the organization. This chapter includes the Evaluation and Learning stages of Action Research. 7. Conclusion: The last chapter presents the final conclusions and some proposals for the future work.
-5-
2 RELATED WORK The organizations have already start implement Lean in order to improve their services or even to optimize their ITIL processes. However, when organizations decide to implement Lean, managers need to understand which practices satisfy the principles of this methodology, how to apply it, and how they should relate Lean‟s concepts to reduce waste. In this way and since this thesis is about improving ITIL process using a Lean, in this section is clearly described the concepts of ITIL, Lean and also the EPF tool. In this stage is also presented two case studies of organizations that developed initiatives that used Lean, Six Sigma and ITIL together.
2.1 ITIL IT Infrastructure Library is a framework of Best Practice guidance for IT Service Management. ITIL has grown to become the most widely accepted approach to IT Service Management in the world. Service Management is a set of specialized organizational capabilities for providing value to customers in the form of services. The ITIL v3 are available from five books which each one provides guidance for a Service. ITIL v3 are focused on five services that improve quality IT services:
Service Strategy: This service offers a number of guidelines that will help in setting customer and market oriented goals and expectations [9].
Service Design: This service deals with design and development of new or modified services for introduction into a production environment [10].
Service Transition: This service includes the management and co-ordination of the processes, systems and functions required for the building, testing and deployment of a „release into production, and establish the service specified in the customer and stakeholder requirements [11].
Service Operation: This service is responsible to co-ordinate and fulfills activities and processes required to provide and manage services for business users and customers with a specific agreed level. It is also responsible for management of the technology required to provide and support the services [12].
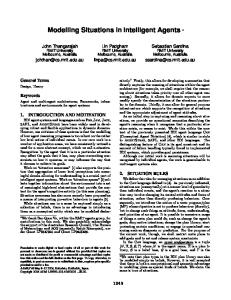
Continual Service Improvement: The goal of this service is assurance the continual improvement of the effectiveness and efficiency of IT services in order to meet the business requirements better [13].
-6-
The Business / Customers
requirements
Strategy
policies strategies
Including the Service Portfolio and Service Catalogue
Service Knowledge Management System (SKMS)
SLP’s from requirements
resource and constraints
Service
SDP’s
Service
standards
Design
architectures
solution designs
Service Transition
Service
operational plans
Operation
SKMS update
tested solutions
transition plans
operational services
improv.actions and plans
Figure 2 – ITIL [14]
The adoption of ITIL provides a several benefits that organizations are proposed to achieve:
Reduced costs;
Improved IT services through the use of proven best practice processes;
Improved user and customer satisfaction with IT Services;
Financial savings from reduced rework, lost time, improved resource management and usage;
Improved decision making and optimized risk;
Improved productivity;
Improved use of skills and experience.
All these benefits are pushing the organizations to enroll in ITIL implementation in order to optimize their IT services and align them with the business.
2.2 LEAN Lean is a process management philosophy adopted by Toyota after World War II. As a result of a limited number of human, financial and material resources, Toyota applied Lean to reduce all kinds of waste in order to improve overall customer value [13]. 1
Lean is based on five principles , such as:
1
Lean Enterprise Institute, Inc. (29 de Abril de 2009). What is Lean? Obtido em 15 de Março de 2009, de Lean Enterprise Institute: www.lean.org
-7-
Specify Value: Being a methodology focused on customer, it is necessary to realize what the customer really wants and is willing to pay for.
Map the Value Stream: The value stream is a simple diagram of every step involved in the material and information flows needed to bring a product or service from order to delivery. It is essential to identify wastes in process flow [15].
Enable
Continuous
Flow:
Identify
and
eliminate
all
kinds
of
non-value-adding
waste/activities.
Pull Strategies: Produce what the customers want in order to allow them to pull the products and also to define the rate which the products should be delivered.
Pursue Perfection: All the activities and processes should be perfect. There is always effort, time, space, cost and mistakes to reduce and ways to do things better.
All of this principles work to achieve a set of goals:
Standardized Work: Specific instructions that allow processes to be completed in a consistent, timely, and repeatable manner.
Continuous Improvement: Reduce costs, improve quality of products and services, increase productivity and stimulate the sharing of information on the organization’s culture [16].
Elimination of Waste: Eliminate all activities of the production flow that do not add value to product or service.
Total Quality Immediately: Identify all defects and quickly detect its origin.
‘Pull’ Processes: The products are produced only when a customer needs or asks for, according to its demand.
Flexibility: Quickly produce lots of different variety of products, without compromising the efficiency due to lower volumes of production.
Good Relationship with Suppliers: Build a relationship of trust over time with suppliers, and establish agreements that seek to share the risk, cost and information.
2.2.1
Types of Waste
Waste does not add value to the product or service and therefore can be described as an activity which the customer is not willing to pay more money [17]. There are eight kinds of waste that Lean plans to reduce:
Inventory: Parts on stock which are required to manufacture a product. When in excess, there is, for instance, workspace wasting.
Transportation: Unnecessary movement of information, products or items from one area to another.
-8-
Motion: Redundant motion relates to people moving around the workspace wasting time and effort.
Overproduction: Occurs when the company is producing more than the customer requires.
Defects: Any error or non-conformance of parts or product which adds cost without adding value.
Waiting Time: If people, equipment, information or materials delay the production process, time is wasted and the cost of production will be increased.
Over Processing: Involves taking extra steps in the manufacturing process.
Unused Creativity: Not using people to the best of their unique abilities. This type of waste involves loosing time, skills, ideas, improvements and learning opportunities.
2.2.2
Lean Practices
For several years, practices were developed to meet the principles of Lean methodology. This section presents an overview of each practice that aims to optimize the process for reducing waste. Value Stream Mapping The term value stream is used in Lean to describe the activities that line up and work together to produce a given product or service. Mapping the entire value stream is a good way to start ascertaining waste in the production flow activities [18]. The resultant diagram provides a vision of all steps involved in information flows needed to bring a product from order to delivery [19].
The Lean methodology has a set of metrics used to identify waste. Next are described the main
metrics used in the design of Value Stream Mapping:
Cycle Time: Metric that measures the time it takes to do one repetition of any particular task typically measured from "Start to Start".
Queue Time: Metric that measures the time between sub-processes that the product or service gets shuffled around or sits around waiting for someone/something to work on it.
Lead Time: Metric that measures the average time that elapses between receiving a request and shipping the product or service to the customer. These metric results by the sum of all the lead time sub-processes with all the queue time between sub-processes.
5 S’s Methodology The 5 S‟s is a mnemonic for a list of Japanese words starting with letter „S‟ – Seiri (Sorting), Seiton (Set in Place), Seiso (Sweeping), Seiketsu (Standardizing) and Shitsuke (Sustainig) – which are able to characterize the methodology. It aims to organize and manage the workspace and workflow with
-9-
the intent to improve efficiency by eliminating waste, improving flow and reducing process unevenness. The 5S‟s process make work areas clean and efficient through a process that seeks to organize the work, keeping it clean, tidy and ensuring conditions for self-discipline in order to achieve a quality work.
Work-Cell Work-cell is the term used to characterize small specialized teams of work in producing a limited scale of very similar products that have value to customer. The resources of each work-cell, whether human or material, are arranged in a compact form occupying a small area of the production zone. Determining the work-cell involves selecting a family of parts to produce, reviewing the material and tools required, and creating a single work area in which numerous value-adding activities take place in a small space as possible [20].
One-Piece Flow One-Piece Flow refers to the concept of moving one work-piece at a time between operations within a work-cell. Each step of the process produces only one part at a time and produces it only when the next process needs.
Kanban Kanban is a method that involves using visual cues to define the evolution of a process and identify what is required when needed. In a process oriented by demand, Kanban are instruction cards or signals which indicate that the inventory or production materials should be replenished.
Takt-Time Takt-Time is a concept that allows companies to calculate the amount of time which a unit of product should be manufactured. It is the amount of time that can be allocated to a worker or a machine to produce one unit or part. This time is calculated by dividing the amount of work time available in a day 2
by a number of units or parts that must be produced in a day, in order to meet demand . Kaizen Kaizen is a philosophy of improvement that encourages continuous and incremental changes in all processes of a business, struggling against stagnation and declining that are being felt in most organizations. The objectives of Kaizen are the continuous improvement and elimination of waste in production flow processes, so it requires involvement and willingness to change by all employees at all levels, and places emphasizing on communication, quality and effort [21]. Jidoka & Poka-Yoke
2
Oliver Wyman Group (12 de Maio de 2009). Keystone of Lean Six Sigma: Strong Middle Management, Seelinger, J. (2007). Obtido em 1 de Junho de 2009, de http://www.oliverwyman.com/ow/index.html
- 10 -
Jidoka aims to provide the machine or operator the autonomy to stop the production line when a fault is detected. This way, the defects never pass to the next stage in the process, and quality is built in the production source. Poka-Yoke means “the prevention of inadvertent errors”. It is a mistake-proof device that prevents the occurrence of defects in manufacturing processes or in the usage of products. Hoshin-Kanri Hoshin-kanri defines a system of planning, forms, rules and practices of Total Quality Management – TQM – that engages everyone in addressing business at both the strategic and tactical levels. This system reflects all visions, goals and direction of top management down the management hierarchy.
2.2.3
Lean Design
In a first stage, it was developed a diagram to design Lean Methodology (Figure 3). The realization of this diagram was provided by the need to organize and relate all the principles, practices and types of waste that characterize Lean. The information was arranged into three layers that are most common used to characterize this methodology: principles, practices and waste. It was considered four practices: Specify Value, Flow, Pull and Perfection, where the first principle already includes the identification of all steps in the value stream.
The nine practices are arranged in accordance with the principle they meet:
Value Stream Mapping meets the Specify Value and Flow principles;
Work Cells, 5S’s and One-Piece Flow meet the Flow principle;
Takt-Time and Kanban meet the Pull principle;
Kaizen, Jidoka & Poka-Yoke and Hoshin-Kanri meet the Perfection principle.
- 11 -
Figure 3 – Lean Design
In the diagram we can see that each of the practices do not reduce all waste (except the practice Value Stream Mapping); only the cooperation of all practices are able to achieve a reduction at all levels. Therefore, we highlighted the types of waste each practice reduces with its performance. There are still practices only related to two of the main Lean objectives – Standardized Work and Continuous Improvement – such as Kaizen, that join its efforts in continuous improvement of the organizational processes, and 5S´s methodology, that involves the management and organization of the workspace and workflow. These two practices are not directly related to the reduction of waste but represent two important pillars in consolidation of success provided by Lean: the 5S´s give workers the need to maintain a tidy environment where there is no place for waste; kaizen sensitizes them to the constant concern to improve what already has been done.
- 12 -
2.3 CASE STUDIES This section describes some initiatives that used Lean, Six Sigma and ITIL together.
2.3.1
Lean Six Sigma and ITIL by ISQ and SQS
The Instituto da Soldadura e Qualidade (ISQ) and Software Quality Systems (SQS) developed a Lean Six Sigma methodology to improve their ITIL framework [22]. The context of this initiative was the principle that ITIL and Six Sigma are complementary approaches and so that they can be used in an integrated way. To ISQ and SQS, ITIL is a methodology for “what?” and Lean Six Sigma for “how?”, and therefore they can work together in order to provide continuous optimization in IT processes.
According to ITIL v3, the continuous optimization cycle for a service has three phases: Service Design, Service Transition and Service Operation. The framework, proposed by these two organizations, suggests the integrated use of Define, Measure, Analyze, Improve and Control (DMAIC) and Identify, Characterize, Optimize and Verify (ICOV) Six Sigma cycles within the ITIL cycle:
Service Design phase used ICOV
Service Transition phase use ICOV
Service Operation phase use DMAIC
This methodology suggested a great number of Six Sigma practices and tools, so there is a great concern in elimination of defects, unlike Lean that is more focused on elimination of waste. The following table demonstrates the use or non-use of goals and practices of this new methodology:
Table 1: Critical Analysis – ITIL and Lean Six Sigma Methodology LEAN Principles
LEAN Goals
Value Specifying
Standardized Work
Value Stream Mapping
Continuous Improvement
Continuous Flow
Quickness
„Pull‟ Processing
Flexibility
Perfection Pursuing
In part, because this methodology was more related with Six Sigma, there were practices and goals that were not addressed by this improvement. There is no reference to any activities like the Value Stream Mapping or even the Continuous Flow (non-value added activities identification) and there were not an attempt to standardize work. Moreover and particularly in the case of software development, this study of adaptation of methodologies showed that Service V-Model proposed by ITIL v3 should be used to promote the effectiveness of functional requirements. This conclusion is
- 13 -
supported by the fact that Service V-Model provide baseline points along the path that are used checkpoints to ensure that was is being designed, built and delivered is actually what was required by client (Lean Principle – Specify Value). Finally, there is also no reference to the use if ITIL metrics which can represent an effective way to measure and control the current service quality.
2.3.2
Applying Lean to the ITIL v3 Event Management Process
Infosys Technologies is a multinational information technology and consulting. In 2008, Infosys decided bet in reduction of waste and manual efforts in ITIL v3 Event Management Process with Lean Methodology [23]. This improvement process was boosted by several problems. To resolve it, Infosys proposed analyze the alerts, reconfigure and cleanup them in order to achieve a set of goals (Figure 4):
Problems
Fear of missing critical alerts; Non value adding monitoring efforts; Crowded alert interface.
Goals
Reduce cost of monitoring activities; Optimize service desk monitoring; Ensure accurate priority classification; Automate manual activities; Improve team moral; Ability to detect address critical alerts; Cleaner alert interface.
Figure 4 – Goals and Problems in Infosys Event Management Process This improvement was developed through a process with three stages: Phase 1 – Analysis This phase was focused on identification and categorization of all alerts into types of waste. There was also redundancies detection through the value stream mapping. Phase 2 – Business Case & Drivers
- 14 -
The principal activities presents in this phase are development of business case and implementation plan according to requirements. Phase 3 – Implementation In this phase were implement changes, recalibrate baselines and realize benefits. The value stream mapping identified waste that was classified according the seven kinds of waste proposed by Lean:
32 % Inventory;
24% Over processing;
13% Waiting Time;
11% Defects;
10% Overproduction;
5% Transportation;
5% Motion.
Table 2: Critical Analysis – LEAN Principles Identified in Event Management Improvement LEAN Principles
LEAN Goals
Value Specifying
Standardized Work
Value Stream Mapping
Continuous Improvement
Continuous Flow
Quickness
„Pull‟ Processing
Flexibility
Perfection Pursuing
Looking at the Table 2, it is possible to realize that all Lean goals were achieved. However, there are two concepts that were no covered: the non identification of value stream and non adoption of a „pull’ processing. The value stream mapping represents a good way to start discover waste in all production flow activities and select what really represents value to the customer because it brings a visual of all steps involved in information flows [24]. This may mean that some waste could not be identified and removed. And in this way there is still room for more improvements; Infosys also could adopt a strategy for produce according with demand. In general, Infosys reached a reduction of manual efforts by 44% with application of waste reduction practices from Lean on Event Management while improving the quality of its services.
2.4 EPF COMPOSER The development teams are always facing a set of problems:
Lake of a common language or terminology between processes – redundancy and inconsistencies;
Knowledge cannot easily be customized for different projects or new best practices;
- 15 -
Nonexistence of central community or communication framework to facilitate convergence of best practices across domains.
In January 2006, the EPF was created in order to overcome these difficulties [25].EPF Composer is a process modelling tool platform and extensible conceptual framework based on Software Process Engineering Metamodel (SPEM) 2.0 [26] for authoring, tailoring, development method content and publishing processes [27]. Following SPEM 2.0, reusable method content is defined separately from its use in processes in EPF Composer. The SPEM Metamodel was developed to specify the concepts, rules and relationships used to define software development processes and their components using Unified Model Language (UML). This Metamodel was accepted by Object Management Group (OMG) that is an international organization 3
that approves patterns for object oriented applications since 1989 .The standards approved by this organization, including UML, enable powerful visual design, execution and maintenance of software and other processes, including IT Systems Modelling and Business Process Management. Generally, EPF implements SPEM 2.0, using its language, which represents the EPF Metamodel and is supported by OMG. EPF Composer also provides three sample process frameworks like Open Unified Process (OpenUP), Extreme Programming (XP) and (Scrum).
OMG (Object Management Group) SPEM 2.0 (Software Process Engineering Metamodel) Metamodel) ECLIPSE PROCESS FRAMEWORK
OpenUP Scrum XP
Figure 5 – EPF Context Overview
2.4.1
Method Content Versus Process
The most fundamental principle in the Eclipse Process Framework is the separation of reusable core method content from its application in processes. 3
Object Management Group (23 de Dezembro de 2009). The Object Management Group (OMG). Obtido em 3 de Janeiro de 2009, de Object Management Group: www.omg.org
- 16 -
Method Content describes what is to be produced, the necessary skills required, and the step-by-step explanation describing how specific development goals are achieved. It is comprised essential for:
Roles, tasks, category, work products;
Disciplines, domains;
Guidance.
After entering the relevant content is possible use it to define Processes. Processes describe the development lifecycle; they take the method content elements and relate them into semi-ordered sequences that are customized to specific types of projects. Processes can also use the information entered to publish it as a website. Processes are configurations of method content arranged by:
Phases, iterations, activities, delivery process;
Milestones, team profiles;
Guidance.
Generally, processes are expressed as workflows or breakdown structures in EPF Composer and Method Content as books or publications. Figure 6 shows two screens that represent the introduction of contents and definition of processes in EPF.
Process (Workflow, Breakdown, Iterations, Increments, Sprints, Waterfall)
Method Content (Best Practices, Books, Publications, Standards)
Figure 6 – Method Content and Process Examples in EPF
2.4.2
Why EPF?
The EPF Composer tool was chosen for the development of this thesis mainly because it provides an reusable Framework for software process engineering, with following characteristics:
- 17 -
Extensible Framework: o
Meta-model based on OMG SPEM 2.0;
o
Core extensible process tooling framework;
Exemplary and extensible tools: o
Method and process authoring;
o
Library management and content extensibility;
o
Configuring and publishing;
Exemplary and extensible process content – Users can choose and customise existing process frameworks or create new ones: o
Iterative, agile and incremental development;
o
Provide foundation for reusing, sharing, integrating and tailoring various process assets;
o
Applicable to a broad set of development platforms and applications;
Provide a forum for industry process investments to converge: o
Rational Unified Process (RUP), Agile, Dynamic Systems Development Method (DSDM), Model-driven Architecture(MDA), The Open Group Architecture Framework (TOGAF);
Figure 7 – EPF Conceptual Architecture Generally, EPF helps users or organizations to construct processes from the ground-up, customize an existing process framework and also integrate a family of processes. It aims at producing a customizable software process engineering framework, with process content and tools, supporting a broad variety of project types and development styles which provides an easy learn user-experienced.
For all these reasons and in order to overcome the problems mentioned in section 3.4 it was decided that the use of this tool would be most appropriate for modelling the processes.
- 18 -
3 PROPOSAL In order to solve the problem described in section 2, the proposal of this thesis is to realize and evaluate a framework, based on Lean principles, to guide an ITIL optimization. The following figure represents an overview of the proposal context:
LEAN
ITIL
EPF: Framework based on LEAN
EPF: Optimized ITIL Process
EPF: Framework based on ITIL
Figure 8 – Proposed Solution
After a careful and independent study on Lean and ITIL and as the figure shows, the final framework results of the following stages of development: 1. Lean methodology implementation in EPF; 2. ITIL processes implementation in EPF; 3. Application of Lean framework (1.) to ITIL processes framework (2.) in EPF.
In order to create two news content libraries, it is necessary start to insert contents of Lean and ITIL into the EPF tool. This first phase corresponds to the introduction of content that characterizes the Method Content of the EPF. The last phase will occur only after understand the relations between the two methodologies and after realize where Lean can be applied to ITIL framework and corresponds to the definition of Process in EPF.
Figure 9 – Architecture’s Solution
- 19 -
As mentioned earlier, the research methodology used for making this thesis is the Action Research that when seen in the context of this thesis results in different activities, for each stage of cycle, which are identified in the following table.
Table 3: Action Research’s Phase and objectives 1. DIAGNOSING
Problem identification
Understand the ITIL Framework
Understand the LEAN Methodology
2. ACTION PLANNING
Realize where LEAN can be applied to ITIL
Identification of relevant processes and metrics suggested by ITIL
Definition of the solution‟s proposal
Implementation of LEAN Framework in EPF
Implementation of ITIL Framework in EPF
Implementation of optimized ITIL processes in EPF - LITIL
3. ACTION TAKING
Develop case study in an private organization o
Identify the delivery value process adopted by organization
o
Analyze the process
o
Measure the metrics adopted in LITIL process
4. EVALUATING
Calculate the cycle and lead time of value process analyzed
Identify waste and possible points for improvement
5. LEARNING
According with LITIL, develop a proposal for improvement to apply in case study‟s organization
The proposal is thus based on development of a delivery process that really has value to the customer, with the following characteristics:
Final process formed only by ITIL processes that add value to the customer according with Lean methodology;
Minimum number of ITIL processes that can promote an efficient development and delivery of value;
Process without waste;
Process able to promote continual service improvement.
In the end, this cooperation process between Lean and ITIL must achieve the following objectives:
- 20 -
Provide an overview of the process flow required for the development of value;
Fast delivery of value;
Focus on the customer and their needs.
- 21 -
4 IMPLEMENTATION 4.1 LEAN LIBRARY After studying and analyzing the Lean methodology was necessary to define a logical way to model this methodology in EPF Composer. The Lean Library starts with a definition of What is Lean? and What are the types of waste that Lean wants to eliminate?. Alongside of these concepts and according to Lean Design chapter previously provided in this document, the information was structured in four content packages that represent the Lean Principles: Specify Value, Continuous Flow, Customer Pull and Pursue Perfection. Each one of these package describes the practice that meets the principle, the work products resulting from the execution of the practice and in some of the cases it was also introduced examples of the execution of the practice. Table 4: Association of Lean Principles and Practices modeled in EPF Composer
Lean Principles
Lean Practices
Specify Value
Value Stream Mapping
Continuous Flow
Customer Pull
Pursue Perfection
Value Stream Mapping 5 S‟s Methodology Work Cells One Piece Flow Kanban Takt-Time Kaizen Jidoka and Poka-Yoke Hoshin-Kanri
The Lean Library was supported by a different guidance kind supported by EPF Composer – Concept, Practice, Work Products, Examples and Roles – related to each other giving a structure of relations between principles, practices and types of waste. The final result of Lean Library can be viewed in the following figure which represents the website generated by the EPF tool.
- 22 -
Figure 10 – Lean Design in EPF Composer
4.2 ITIL LIBRARY For ITIL modeling in EPF Composer it was constructed five content packages that meet the five stages of the ITIL lifecycle – Service Strategy, Service Design, Service Transition, Service Operation and Service Continuous Improvement. As in Lean, the ITIL Library was supported by different types of guidance supported by EPF Composer (Concept, Practice, Work Products, Examples, Roles and Tasks) and also for Capability Patterns that with your tasks performs the ITIL v3 processes.
Figure 11 – Types of Guidance used in ITIL Library [27]
Again all processes modeled are linked and interrelated through their concepts, work products, roles and metrics. The next figure shows the final result of the ITIL Library modeled in EPF Composer.
- 23 -
Figure 12 – ITIL Design in EPF Composer
4.3 LITIL LIBRARY LITIL defines a process that aims develop and delivery as quickly as possible what represents value to the customers according with ITIL v3 and LEAN principles. The LITIL is the result of LEAN process modeling on ITIL framework and because of that this new framework was modeled through the Lean and ITIL libraries previously loaded in EPF Composer.
According to the definition of value added activities, it was selected ITIL processes necessary for the development and delivery of what represents value to the customer. LITIL includes ten of all ITIL lifecycle processes that directly contribute to a guiding value that is able to develop products or services that meet the customer's needs,
The processes selection focused on following issues:
What are the essential processes to deliver a product or service that add value to the customers?
What are the processes of ITIL v3 that meet the Lean Principles and Practices?
Selection of the minimum number of processes in order to make the delivery to the customer as quickly as possible.
In LITIL, it was considered only the processes that enable a quickly delivery of services, add value to the customer and meet the principles of Lean because this is preciously the aim of LITIL. In this way, it was necessary study the concepts of Value- Added and Non-Value-Added proposed by Lean.
- 24 -
A Value Added Activity is an activity that increases the worth of a product or service and for which the customer is willing to pay. The value-add assessment of the activity identifies an activity as one of the following:
Real-value-add (RVA) activity;
Business-value-add (BVA) activity;
Non-value-add (NVA) activity.
An activity is classified as RVA if it directly contributes to satisfying the customer´s expectations and needs. Any activity which improves the customer's perception of the product or service is a RVA activity (e.g. taking customer orders, shipping). BVA activities are those activities which satisfy business requirements, but add no value from the customer's viewpoint (e.g. preparing financial reports). NVA activities are activities which do not enhance the customer's image of the product or service and do not support the business process. If the activity could be removed from the process, with no effect on the end-product or service, it is an NVA activity (e.g. transportation, storage, inspections). According with LITIL selection factors, all the ITIL v3 processes were classified as RVA, BVA and NVA. All the processes classified as RVA were then chosen to form the LITIL flow. The next figure represents this classification.
Table 5: Classification of ITIL processes ITIL - Service Strategy
RVA BVA NVA
Demand Management
Financial Management
Service Portfolio Management
ITIL – Service Design
RVA BVA NVA
Service Catalogue Management
Service Level Management
Capacity Management
Availability Management
IT Service Continuity Management
Information Security Management
Supplier Management
ITIL – Service Transition
RVA BVA NVA
Transition Planning and Support
Change Management
Service Asset and Configuration Management Release and Deployment Management
- 25 -
Service Validation and Testing
Evaluation
Knowledge Management
ITIL – Service Operation
Event Management
Incident Management
Request Fulfillment
Problem Management
Access Management
RVA BVA NVA
ITIL – Continual Service Improvement
CSI Improvement Process
Service Reporting
RVA BVA NVA
Note that all the processes of ITIL v3 are equally important, but for the case of LITIL interest only the processes that add value to the customer with a view of immediate delivery of the hired service. All other procedures used for contingencies because they are not used immediately in a first stage of service delivery were not chosen for the LITIL processes flow. The following table shows the processes selected to perform LITIL and the phases of the ITIL v3 that each belong. Table 6: LITIL processes and its ITIL Lifecycle Stage
Selected Processes
ITIL Lifecycle Stage
Demand Management
Service Portfolio Management
Service Catalogue Management
Service Level Management
Capacity Management
Supplier Management
Service Validation and Testing
Release and Deployment
Service Strategy
Service Design
Service Transition
Management
Incident Management
Service Operation
Service Reporting
Continual Service Improvement
Next will be described all these processes and pointed the reasons, beyond those already mentioned, which made them essentials to LITIL value flow.
- 26 -
4.3.1
Demand Management
The Demand Management satisfies the Specify Value and Establish Pull principles of Lean. It is from the Demand Management that are identified the customer needs.
Services cannot be produced in advance of when they are consumed. Therefore it is essential that the service provider achieves a tight synchronization of supply capacity and service demand. Demand Management is used by service provider to achieve the most effective utilization of IT service assets by understanding and influencing how and when demand arrives from their customers. Demand Management is essential because it helps service provider to understand the needs of their customers. The satisfaction of these needs represent the value for the customers defended in Lean methodology. Demand Management must be also a pull-system where consumption cycles stimulate the production cycles.
4.3.2
Service Portfolio Management
The Service Portfolio Management prepares the services that respond to the customer‟s demand identified in Demand Management. This
is
the
life
the cycle
process of
its
whereby portfolio
the of
service services
provider in
(Service
order
to
Provider) drive
each
manages
all
service
to
production value. The goals of Service Portfolio Management are to realize and create maximum value, while at the same time keeping a lid on risks and costs. In general, Service Portfolio Management is a dynamic method to govern investments in Service Management across the enterprise, in terms of financial values.
4.3.3
Service Catalogue Management
The Service Catalogue Management is a direct consequence of Service Portfolio Management. It is through the services catalogue that customers can choose the service that best satisfies their needs. Service Catalogue Management represents an adoption of a catalog of a services generally specified through databases and structured documents with information about all services in development and all services that are ready to be sold to the customers. These documents contain all current details, the status, possible interactions, information about deliverables, prices, contact points, ordering and request processes and mutual dependencies of all services.
- 27 -
4.3.4
Service Level Management
The Service Level Management incorporates one of the most import interactions the customer. The customer satisfaction level is at the heart of the service level management. It is in this process that are defined, documented, agreed, monitored, reported and reviewed the quality levels of services provided to customers. The Service Level Management is focused on design, evaluation and review of the contracts between Service Provider and customer – Service Level Agreement– that describes the service provided and its requirements (Service Level Requirements), records the objectives for service level and specify the responsibilities of the parties involved.
4.3.5
Capacity Management
The Capacity Management Process aims to produce and maintain a level of IT capacity capable to meeting current and future customer‟s needs. In LITIL context, the Capacity Management is crucial to manage the work teams and resources required to meet the takt-time of the projects. The essential point behind the process of Capacity Management is the requirements asked by the customer and that are recorded in Service Level Agreement - SLA. After an analysis of the SLA, the resources used by each IT Service and the pattern of usage over time are collected, recorded and analyzed in order to establish a resource plan that meets the customers' requests. This process has always a special attention to maintain a balance between costs and resources and between capacity and demand while exploring the current and future opportunities offered by technological developments. Aligning Capacity Management, Service Portfolio Management and Service Level Management within the lifecycle of Service Design is essential for the IT Business success. This process in particular yields information on current and future resources and it allows the organization to decide which components it wants to replace, and when and how it plans to do that.
4.3.6
Supplier Management
The Lean methodology says that is very important to maintain good relationships with suppliers. According with this principle and because sometimes is more advantageous to outsource services the Supplier Management of ITIL v3 was selected to perform LITIL process. The Supplier Management Process ensures that the contracts entered into with external entities support the expectations of the business by aligning the external agreements with the organizational and customer´s needs. The proposed objective of this process is obtaining value in exchange for financial resources, made possible through a careful periodic review of contracts. This analysis
- 28 -
focuses primarily on verifying the performance of the agreements or see if the services offered are framed with the objectives of the proposed business. In general, the Supplier Management process ensures that all underpinning services supplied externally are appropriate to support the agreed targets and business needs laid out in the Service Level Agreement. Apart the importance of this process, the choice of it also resulted from an analysis 4
of the Maturity Level 2 Managed of Capability Maturity Model Integration (CMMI) for Services . In the IT industry, the process maturity improvement process is best known in the context of the CMMI. This process improvement method was developed by the Software Engineering Institute (SEI) of Carnegie Mellon University and provides both a staged and a continuous model. In CMMI for services, Supplier Agreement Management (SAM) of CMMI for services addresses too the acquisition of products and product components that are delivered to the project‟s customer.
4.3.7
Service Validation and Testing
When the Service Validation and Testing is performing the service providers can detect any errors that may result in nonconformance of requirements. In this way, testing of services ensures that new or changed services are 'fit for purpose' and 'fit for use' and this have an important contribution to the quality of IT. 'Fit for purpose' is a term related with utility and means that the service does what the customer expects of it, so that the service supports the business. 'Fit for use' addresses such aspects warranty, availability, continuity, capacity and security of the service. One of the most important objectives of Service Validation and Testing is also verify whether the service provider has sufficient capacity and resources in order to provide a service or service release successfully. Insufficient attention to testing may result in increase of incidents, issues and errors, extra service desk phone calls with questions regarding the functioning of the service. For all these reason it was also concluded that this process of testing and prevention meets the PokaYoke practice of Lean, which represents one more reason for use the Service Validation and Testing in LITIL.
4.3.8
Release and Deployment Management
Release Management is the process responsible for building, testing and supplying the services specified in the Service Design within the agreed deadlines and with minimal disruption of existing services. New services and support systems should provide services in accordance with the requirements 'fit for use' and 'fit for purpose' established (Service Validation and Testing). 4
Wibas CMMI Browser (2007). Supplier Agreement Management (SAM) (CMMI-SVC) (2009). Obtido em 9 de Abril de 2010, de http://www.cmmi.de/#el=CMMI-SVC/0/HEAD/Process Area/Process Area.00013
- 29 -
This process is very important for LITIL because is in this process that the service is finally delivered to the customer. By this time, although the service has already been delivered to the customer it was necessary to introduce two more processes of ITIL v3 – Incident Management and Service Reporting – in order to eliminate possible defects not detected and promote the continuous improvement of services.
4.3.9
Incident Management
The Incident Management satisfies the Jidoka practice of Lean that aims a quickly elimination of defects. An incident is an unplanned interruption to an IT service or reduction in the quality of an IT service. Failure of a Configuration Item that has not yet affected service is also an incident. The Incident Management Process is responsible to restore normal service operation as quickly as possible so that its contracts with customers (Service Level Agreement) are not harmed, working to minimize any adverse impact on business operations. 'Normal service operations' is defined here as service operation within SLA limits. The events that denounce incidents are reported directly users, either via the service desk or various tools and ways. Incidents can also be reported or logged by technical staff, which does not necessarily mean that every event is an incident.
4.3.10 Service Reporting
The Service Reporting aims the Continual Service Improvement also supported by Kaizen in Lean. A large volume of data relating to the service quality is collected as part of the service delivery and monitoring. The majority of this information is used internally by IT. Only a small portion is of relevance to the business. The business requires the service provider to produce a comparison with previous reporting periods and to rework incidents. In this way, the Service Reporting Process is the process which is responsible for the generation and supply of reports about the results achieved and the developments in service levels. These reports describe essential information about incidents that allow to answering the following questions:
What has happened?
What action was subsequently taken?
And what is being done to ensure that in future these incidents will no longer impact on the business?
The following table resumes the reasons to adopt these ITIL v3 processes in order to perform LITIL.
- 30 -
Table 7: LITIL processes and its adoption reasons
ITIL Lifecycle Stage
Selected Processes
Why?
1. Demand Management
Satisfies the Specify Value and Establish Pull of Lean.
2. Service Portfolio Management
Prepares the services that respond to the customer‟s demand identified in Demand Management.
3. Service Catalogue Management
It is through the services catalogue that customers can choose the service that best satisfies their needs.
4. Service Level Management
Promotes the establishment of a contract between service provider and customer which describes the requirements that add value to the customer.
Service Strategy
Service Design 5. Capacity Management
Manages the work teams and resources required to meet the takt-time of the projects.
6. Supplier Management
Satisfies the necessity to maintain a good relationship with suppliers proposed by Lean.
7. Service Validation and Testing
Satisfies the Poka-Yoke practice of Lean.
Service Transition 8. Release and Deployment Management
Service Operation
8. Incident Management
Continual Service Improvement
8. Service Reporting
Delivers value to the customer.
Satisfies the Jidoka practice of Lean.
Satisfies the Pursue Perfection principle and Kaizen practice of Lean.
All these processes when linked represent the cycle of delivery value to the customers.
In this moment, it was necessary model all this processes in a logical way and in accordance with Lean principles and practices. So, the creation value process was modeled according with LEAN practice - value stream mapping - that represents the value stream since the request arrives in IT department until it is delivered to the customer. All processes are also associated with LEAN and ITIL metrics to be used in performance evaluation of them and customer is referenced by SLA that describes the product or service requested. In order to finish the process it was necessary introduce an entity responsible for managing the flow of activities from the beginning to the end of the process value stream manager. In order to follow the rules of value stream mapping and also to add value to ITIL because it does not provide a specialized role for managing in a high-level the sub-processes of a process the value stream manager, derived from Lean, was considered.
The
final
result
of
LITIL
process
is
- 31 -
represented
in
the
following
figure.
Figure 13 – Value Stream Mapping for LITIL Process
- 32 -
5 ACTION 5.1 AS-IS VALUE FLOW After having defined and modeled the LITL process, became necessary to evaluate its potential. For this it was identified and analyzed the process of value development of a private organization. This case study arises from the need to understand how organizations execute internally its value creation process. The chosen organization develops its business on information technology, being the case study focused on infrastructure and support fields that are responsible for managing and integrating the infrastructure of Information Technology. During the case study were made several interviews in different areas of this activity vector:
Commercial Management Area: responsible for analyzing and managing the business opportunities. The main goal of this area is to award projects for the organization;
Services Management Area: responsible for developing the implementation of the project awarded and its delivery to the customer;
Support Management Area: responsible for providing support to the implemented services and previously delivered to the client (same as the Service Desk).
Commercial Management
Services Management
Principal Activities:
Principal Activities:
Opportunities Management and Analysis
Project Management
Support Management Principal Activities:
Requirement Analysis
Provide support to customers
Project Implementation
Make the Second SLA
Making proposals for tender
Make the First SLA
Application Support:
Application Support:
Salesforce
Navision and Fortis
Application Support: Application for Incident Management
Figure 14 – Principal Areas of Value Development in Organization
5.1.1
COMMERCIAL DEPARTMENT
The value development flow is started in the commercial area that is responsible for identifying business opportunities and in a second stage classifies them. The identification of opportunities can be done in two ways:
Proactive Action: It is the commercial manager who identifies the business opportunities. Proactive Action results in about 80% of awards;
- 33 -
Reactive Action: The customers look for a provider organization to undertake a particular project.
When opportunities are identified, skills are studied by the chosen organization. At this stage, the organization assesses their skills and the financial and operational risk associated with the project in order to see whether there could go ahead with a proposal. If there is, the proposal is put out to tender and meetings are made with the customer in order to discuss the conditions of the project. After that, if the proposal shows profitability for both parties, the project is granted. In this way, business opportunities are managed in the commercial area, beginning to be analyzed and when found appropriate, proposals are put out to tender with the aim of winning new contracts. All these market studies and make proposals are supported by the Salesforce application. The responsibility of this department goes up to the time when the projects are awarded, after this stage we enter the area of services.
5.1.2
SERVICES DEPARTMENT
When projects are awarded, is formalized one proposal to the client which is registered in Navision application. This proposal is regarded as the Service Level Agreement (SLA) of ITIL v3, however it only shows all the project details and responsibilities of both parties - supplier and customer – to the end of project implementation and subsequent delivery to the customer. All kind of support needed by the previous project requires a new SLA provided by the support area.
The final proposal and all documentation related to the implementation project are introduced in Fortis application, which are recorded in multiple levels of approvals that define the workflow for approval of the cover project. The workflow has on average 6 levels of approvals but this number depends on the size of the project, when it is more complex there are more levels involved. The 6 levels are normally represented for the following departments or persons:
Level 1: Commercial Department;
Level 2: Commercial Director;
Level 3: Service Director;
Level 4: Service Department;
Level 5: Logistics Department;
Level 6: Shopping Department.
Given the fact that at this stage the leaders of different levels define the resources for the project, this approval workflow process is treated as the Capacity Management process. However, within the organization this workflow is basically informational, since it is more used to give information to the main areas that the project was finally sold to the customer. At this stage, the various levels report again how many resources they need, information that had already been given when the proposal was
- 34 -
put out to tender. This gives us the indication that there is a duplication of activities already carried out and consequently non-value-add activities. After all approvals have been made, the project is allocated to a Project Manager who highlights a development team to begin the development phase. The project manager is thus responsible for making the follow-up of the implementation since its start until the signature of acceptance. After implementation, and if the solution is in accordance with the request, the customer signs the document related to the Acceptance Signing and is completed the first cycle of value to the customer.
5.1.3
SUPPORT DEPARTMENT
In this organization there is a division of between implementation and support areas responsibilities. Therefore, there are two SLAs that divide responsibility in the areas of implementation and support projects. When customers request a certain level of support/maintenance service of the acquired and previously accepted services, starts a second cycle of value. By this time the area of management support is responsible for defining a new SLA, to help and support the client.
This contract has:
One single identifier;
Procedure for opening of incidents. This procedure is intended to explain what priority a client should associate with an incident, having P1 a higher priority than P2 and P3 and so on. These priority categories are associated with estimated time of resolution of incidents.
Alongside the support contract agreement with the customers there is a procedure for incident management used to solve them. This procedure is used to handle incidents and takes into account the priority of the incidents that is the given by its nature and context. The incident management procedure has the following steps: 1. The customer reports the incident by telephone, email or fax; 2. The support area checks if there is an active SLA with the customer: a) If there is, the customer defines a priority category to the incident (P1, P2 or P3); b) If there is not, the support area realizes the support contract to be concluded with the client; 3. After the client has defined a priority to the incident, the support team combines it with an identifier; 4. After an initial diagnosis, the support team makes a calibration of the priority given by the client. In case of changes, the new priority is communicated to the client; 5. Depending on its category, the incident is forwarded to its resolution area; 6. The incident is solved;
- 35 -
7. The client is informed that the incident was solved and is automatically closed. 8. If the incident persists and even when closed, the incident identifier remains active for a few days so that the customer has time to make sure that the problem was really solved. 9. After this time and if the problem does not persist, the incident is closed.
5.2 ITIL METRICS IN CASE STUDY In this organization, the Support Area is the only department that measures some metrics proposed by ITIL v3:
Number of incidents by category;
Total number of incidents;
The percentage of incidents handled within the agreed timeframe;
Average number of “opened” incidents;
Percentage of incidents that respect the SLA;
Percentage of incidents that are solved by each collaborator of support team;
Total number of incidents solved in different times of day.
According with ITIL, this metrics are used for performance analysis and assessment of services support management. The as-is value flow previously described was then compared to the value stream mapping of LITIL. The result of this comparison is illustrated in the following figure.
- 36 -
L I T I L COMMERCIAL DEPARTMENT Demand Management
SALESFORCE
SERVICES DEPARTMENT
The organization does not have a Service Portfolio
The organization does not have a Service Catalogue
1. Th Th e e Approval Workflow represents: or or ga ga Waiting Time Waste Non-value-add ni ni za za ti ti o o n n d d oe oe s s n n ot ot ha ha ve ve
Service Level Management
Capacity Management
Incident Management No information about Supplier Management
NAVISION FORTIS
FIRST SLA
Queue Time
No information about Testing and Validation
No information about Release and Deploym. Management
When it is necessary additional equipment is needed new approvals. Approval Workflow represents: Waiting Time Waste Non-value-add activity
2.
activity
SUPPORT DEPARTMENT
Queue Time
Figure 15 – LITIL vs Case Study
- 37 -
SECOND SLA
The organization does not execute the S.R. Process
C A S E S T U D Y
6 EVALUATION AND LEARNING After identifying the developing the organization's value process, was necessary to examine some projects developed in order to find out the total duration of this cycle of value execution. It should be noted that the projects reviewed have different dimensions and contexts, but nevertheless are able to demonstrate the reality of the implementation process adopted for any project, regardless of size. The dates of the various phases of the project helped to identify points of waste that should be eliminated or minimized to the maximum so as to optimize the process of value creation. Next, the main phases will be presented as well the dates of three projects selected at random – P1, P2 e P3.
Project 1 Delivery Provision: 10-15 days after award Table 8: Workflow Phases of Project 1 and dates
Workflow
Dates
Opportunity
17-05-2009
Proposal
30-06-2009
Project Order and Award
03-09-2009
Business Department Approval
08-09-2009
Business Director Approval
10-09-2009
Services Director Approval
10-09-2009
Services Department Approval
15-09-2009
Logistics
16-09-2009
Orders Approval
16-09-2009
Project Conclusion
02-10-2009
- 38 -
27-Sep
20-Sep
13-Sep
6-Sep
30-Aug
23-Aug
16-Aug
9-Aug
2-Aug
26-Jul
19-Jul
12-Jul
5-Jul
Proposal
44
Project Order and Award
65
Business Department Approval
5
Business and Services Directors Approval
2
Services Department Approval
5
Project Workflow
28-Jun
21-Jun
14-Jun
7-Jun
31-May
24-May
17-May
Timeline
Logistics and Orders Approval
1 16
Project Conclusion
Figure 16 – Chart of Project 1 Timeline and its Phases
This project begins alerting to the fact that the approval workflow consumes an excessive amount of time that commit the agreed delivery terms with the client. In this project, it was necessary 13 days to obtain all internal approvals, which represents roughly the fixed time for the entire value development process agreed in the SLA. Looking at the graph above it is perceptible that there was a delay of 15 days in the delivery of service, which represents an increase of 50% of the estimated time for conclusion of the project. In this case, if the approval workflow had been eliminated from the development process there would be a slight delay (1 day) in the delivery of service, which would represent greater satisfaction levels to the customer.
According with this values it was possible determine the expended time in value-add-activities and in non-value-add-activities. In order to determine the waste level it was also determined the metrics proposed by Lean – Lead Time and Cycle Time. Table 9: Lead and Cycle Time for Project 1
Total (days) Lead Time Cycle Time
Value-Add-Activities Non-Value-Add Activities 44 days 65 days 16 days 12 days 60 days 77 days 137 days 60 days
- 39 -
Project 2 Delivery Provision: 25-30 days after award Table 10: Workflow Phases of Project 2 and dates
Workflow
Dates
Opportunity
01-05-2009
Proposal
02-06-2009
Project Order and Award
08-07-2009
Business Department Approval
14-07-2009
Business Director Approval
14-07-2009
Services Director Approval
15-07-2009
Services Department Approval
17-07-2009
Logistics
17-07-2009
Orders Approval
21-07-2009
Logistics (additional equipment needed)
02-09-2009
Project Conclusion
04-09-2009
- 40 -
4-Sep
28-Aug
21-Aug
14-Aug
7-Aug
31-Jul
24-Jul
17-Jul
10-Jul
3-Jul
26-Jun
19-Jun
Proposal
32
Project Order and Award
36
Business Department and Director Approval
6
Project Workflow
12-Jun
5-Jun
29-May
22-May
15-May
8-May
1-May
Timeline
Services Director Approval
1
Services Department and Logistics Approval
2
Orders Approval
4 43
Logistics (additional equipment needed)
2 Project Conclusion
Figure 17 - Chart of Project 2 Timeline and its Phases
In this second project, the SLA agreed with the client established a period of 25 to 30 days to complete and deliver the project. However, the project was eventually delivered 28 days late, which represents a delay of 93.3%. This delay results from the:
Poor capacity management, which was unable to timely provide the real number of equipment needed to deliver the project;
Need to obtain internal approvals, representing in this case a wait of 13 days.
This delay has committed the levels agreed for the project that actually only took 2 days to develop. According with this values it was possible determine the expended time in value-add-activities and in non-value-add-activities. In order to determine the waste level it was also determined the metrics proposed by Lean – Lead Time and Cycle Time.
Table 11: Lead and Cycle Time for Project 2
Total (days) Lead Time Cycle Time
Value-Add-Activities Non-Value-Add Activities 32 days 36 days 2 days 13 days 34 days 43 days 126 days 34 days
- 41 -
Project 3 Delivery Provision: 4 weeks after award Table 12: Workflow Phases of Project 3 and dates
Project 3 Workflow
Dates
Opportunity
29-01-2009
Proposal
23-08-2009
Project Order and Award
18-09-2009
Business Department Approval
21-09-2009
Business Director Approval
22-09-2009
Services Director Approval
23-09-2009
Services Department Approval
25-09-2009
Logistics
28-09-2009
Orders Approval
28-09-2009
At the case study date, no equipment was received
30-10-2009
28-Oct
21-Oct
14-Oct
7-Oct
30-Sep
23-Sep
16-Sep
9-Sep
2-Sep
Proposal
25
Project Order and Award
26
Business Department Approval
3
Project Workflow
26-Aug
19-Aug
12-Aug
5-Aug
29-Jul
Timeline
Business Director Approval
1
Services Director Approval
1
Services Department Approval
2 3
Logistics and Orders Approval (at the case study date, no equipment was received)
Figure 18 - Chart of Project 3 Timeline and its Phases
- 42 -
In addition to the cycle of approvals and their waiting times, the project 3 had a problem of acquisition of equipment. Although at the date of this case study, the outcome of this project was not known, it is possible to identify a difficulty in managing the logistics of the project that compromises their delivery to the customer. The wait for equipment, represents by itself more time than was established to the project and its delivery to customers. In all cases it is remarkably a period of time too long dedicated to the management of business opportunities and subsequent awards. Typically the service providers take a long period of time to formulate a proposal response to the Request For Proposal (RFP) and customers also take a long time to review them and award the projects, representing on average an expense 60% of the total time for the project management trade. According with this values it was possible determine the expended time in value-add-activities and in non-value-add-activities. It was not possible determines the Lead and Cycle Time because in the date of the case study the project was not completed.
Table 13: Results for Project 3
Value-Add-Activities 25 days
Total (days) Lead Time Cycle Time
Non-Value-Add Activities 26 days 10 days 33 days 25 days (at the case study date) 69 days (at the case study date) no information no information
- 43 -
6.1 IDENTIFIED PROBLEMS During the analysis of these projects and of the flow of development flow was identified several problems that contribute to the increase length of time needed to complete the value development process.
6.1.1
APPROVAL WORKFLOW
The approval workflow occurred after award of the project showed the greatest evidence of waste in the value development process. As described above, an early stage of the value stream each of the responsible for the main areas of development contributes to the achievement of the proposal with information about the capacity needed to develop the project. After the project award, each responsible must submit its approval in the system with information about the necessary resources for your area. Because all these players had previously given this information when carrying out the proposal, this approval workflow is unnecessary. The existence of this approval process causes waiting times leading to delays in delivery of the projects in most of the cases. The organization admits that this approval workflow only serves as a notification of award of the project without increase of value. In case of need to maintain the policy of award notification, the organization might choose to send a notification for each one of the responsible, which would have a maximum period (e.g. 24 or even 48 hours) to respond to this. Only in cases that the resource capacity is changed, the response to the notification must be attached with the new capacity to contract. Otherwise, the response to the notification would be only “Passed" or "Failed", since the information about the capacity is already in the initial proposal previously delivered to the customer.
6.1.2
TWO SLA AND POOR INFORMATION SHARING
The organization under study divides the process of providing services in two sub-processes, each associated with an SLA:
Development process and delivery of contracted services;
Support process and assistance to services previously delivered to customers.
Each of the contracts for these processes have different identifiers which prevents an immediate association between them. Allied to this, there is no knowledge sharing under the services sold between the development team and support. In a situation of request for support from the customers,
- 44 -
a quick intervention is compromised. In fact, when customers request support for the purchased service, the support team is not aware of the service in question. This arises because there is no information sharing about the contracts and therefore on services delivered to customers by the development team (service department). After the first contact of the customer, support team asks to the customer some time to establish contact with the development team. The request for intervention from the client stays on stand-by while the support team is informed of what service was provided and in which conditions. After understanding the customer context, the support team formalizes the second SLA for support services not covered by the first SLA.
SLA for Service Development
X
SLA for Service Support
Figure 19 – Problem Identified: Lack communication between areas
The existence of two contracts warns us to poor information sharing in a heterogeneous responsibility environment. This lack of knowledge sharing leads to more time-consuming interventions that affect the level of customer satisfaction that requires its service available as soon as possible. This point clearly expresses a point of easy improvement if one of the following proposed solutions is adopted:
Adopt a single SLA for the development, delivery and service support;
Keep both SLA but with a unique identifier.
For this last proposed solution, on delivery of service, the development team would be responsible for sharing with the team support the agreement previously reached with the client. At this point, the support team would have to register a new SLA, this time to support services and support, with the same identifier that the first SLA and with this attached. This identifier would be known by the client who through it the client would seek assistance. Thus, the services of support staff would be provided promptly without sacrificing the customer satisfaction level.
6.1.3
NO EXECUTION OF THE SERVICE REPORTING PROCESS
After completing the project, the organization does not perform a critical retrospection to the developed work. There is not a concern to assess whether the agreements in the SLA have been or
- 45 -
not attained either by the service provider or customer. In this case, by fact that the client does not require an assessment of the contract, the service provider does not need to carry out a careful analysis of what actually went right and what went wrong.
Service Providers
Customers
X
Figure 20 – Problem Identified - No validation of the SLA after the end of the project
This analysis would be crucial to identifying areas for improvement to enable a progression of services in future contracts and consequently improve the organization's image among its customers.
- 46 -
7 CONCLUSION The main problem addressed in this thesis is focused on how IT Departments would improve their IT Services with Lean principles. In order to overcome this problem, the main objectives of this thesis are focus on realize what Lean can offer to ITIL v3 for establishing a cooperation of optimization services between these two methodologies. The LITIL is the result of this cooperation and executes a set of ITIL processes designed according to the value stream mapping practice. In a conceptual level, the LITIL allows to conclude that Lean adds value to the ITIL v3. This value is materialized essential through the adoption of a Lean vision and its focus on customer, Lean metrics and a Lean role entitled value stream manger. These contributions will help IT departments realize how long it takes to provide a service and how much time is spent in activities without added value. The introduction of the value stream manager is justified by the absence of a specialized role for managing in a high-level the sub-processes of a process. All the work realized combined with the benefits of using EPF Composer - possibility of reuse, sharing, integration and tailoring various processes, open source … - give value to this thesis and all the work around this. The LITIL addresses all the Lean principles and goals as it was proposed.
7.1 FUTURE WORK In order to enjoy one of the benefits of the EPF Composer – extensible process contents – it would be interesting to share the realized work with the EPF community. Thus, the users can customize Lean, ITIL or LITIL libraries and create news frameworks.
In this way, it is the interest of the organization where this thesis was realized to take the contents of Lean library and evolved it into new libraries:
Lean and Six Sigma Framework – A integration of two methodologies that have been used together in the manufacturing environment and with a high potential to improve IT processes;
Lean for Software Development - Applying Lean principles to software development in order to make it more agile and without waste.
- 47 -
5
For the case of the ITIL library, there are already requests for this library . In order to find ITIL or other ITSM process library for the Eclipse Process Framework, a user put a post in a discussion forum of this tool. In this post it is stated the following information: “Where can I find an ITIL or other ITSM process library for the Eclipse Process Framework Composer? I am interested in using EPF Composer to map out ITSM process for my organization and wondered whether there were any libraries of methods and processes available to jump-start the endeavor”. This post confirms the need and demand for a library by the ITIL community EPF Composer and also confirms how would be interesting to share the work of this thesis in order to facilitate organizations to adopt these frameworks.
Figure 21 – Post placed on the discussion forum of EPF Composer
Finally, according with all problems and waste founded in the case study, it would be interest to implement LITIL in the organization where was realized the case study.
Overall, with this thesis the community EPF may use its final result for mapping processes in organizations, both based on Lean, ITIL or LITIL. The ability to load a library ITIL may overcome the difficulty felt today by all the organizations which decide to adopt this good practice‟s framework.
5
Newsgroups for Eclipse Technology EPF. ITSM process library for Eclipse Process Framework Composer? (12
de Agosto de 2009). Obtido em 9 de Abril de 2010, de http://dev.eclipse.org/mhonarc/newsLists/news.eclipse.technology.epf/msg01314.html
- 48 -
8 REFERENCES 1. SkillSoft, “Lean Concepts”, Business Collection: Course Number oper_01_a01_bs_enus, (2009) 2. Bon, J., Jong, A., Kolthof, A., Pieper, M., Tjassing, R., Veen, A., Verheijen, T., “Foundations of IT Service Management Based on ITIL V3”, ITSM Library, (2007) 3. itSMF, “An introductory Overview of ITIL V3”, itSMF, (2008) 4. Office of Government Commerce, “ITIL - Continual Service Improvement”, The Stationery Office, (2007) (ISBN: 978-0-11-331049-4) 5. Peters, A., “Applying Lean Thinking to IT – CIOs Must Change IT‟s Workaround Culture to Stimulate Innovation”, Forester, (2008) 6. Baskerville, R., Wood-Harper, A.T., “A Critical Perspective on Action Research as Method for Information Systems Research”, Journal of Information Technology, (1996) 7. Baskerville, R., “Investigation Information Systems with Action Research”, Computer Information Systems Department of Georgia State University, (1999) 8. Baskerville, R., “Distinguishing Action Research from Participative Case Studies”, Journal of Systems and Information Technology, (1997) 9. Office of Government Commerce, “ITIL –Service Strategy”, The Stationery Office, (2007) (ISBN: 978-0-11-331045-5) 10. Office of Government Commerce, “ITIL –Service Design”, The Stationery Office, (2007) (ISBN: 978-0-11-331047-0) 11. Office of Government Commerce, “ITIL –Service Transition”, The Stationery Office, (2007) (ISBN: 978-0-11-331048-7) 12. Office of Government Commerce, “ITIL –Service Operation”, The Stationery Office, (2007) 13. Sayer, J., Williams, B., “Lean for Dummies”, Wiley Publishing, (2008) 14. Nissen, C.F., “Passing your ITIL Foundation Exam – The Official Study Aid”, Office of Government Commerce, (2007) 15. Drickhamer, D., “Using Lean Thinking to Reinvent City Government”, Lean Enterprise Institute Articles, (2008) 16. Machado, V., Pereira, A., “Modelling Lean Performance”, University Nova of Lisboa, Portugal, (2008) 17. Larman, C., Vodde, B., “Scaling Lean & Agile Development”, Addison Wesley, (2008) 18. Poppendieck, M., Poppendieck, T., “Lean Software Development – An Agile Toolkit”, Addison Wesley, (2006) 19. Ramesh, N., “Some Issues to Consider in Lean Production”, Indiana University-Purdue University Fort Wayne, (2008) 20. Schonberger, R., “Best Practices in Lean Six Sigma Process Improvement – A Deeper Look”, John Wiley and Sons Publishing, (2007)
- 49 -
21. Seelinger, J., Awalegaonkar, K., Lampiris, C., “So You Want to Get Lean Kaizen or Kaikaku?” Mercer Management Journal, (2006) 22. Marques, P., Ferrão, F., “How to use ITIL and Lean Six Sigma together in order to improve IT Services”, SAS Forum Portugal, (2008) 23. Nand, R., Chaganty, S., “Applying LEAN to the ITIL V3 Event Management Process”, itSMF UK Driving Real Value Conference, (2008) 24. Drickhamer, D., “Using Lean Thinking to Reinvent City Government”, Lean Enterprise Institute Articles, (2008) 25. Armstrong Process Group, Inc., “The Eclipse Process Framework: Open Architecture Process”, IT Architecture Practitioners Conference – Miami, FL (2006) 26. Chiam, Y., Staples, M., Zhu, L., “Representation of Quality Attribute Techniques Using SPEM and EPF Composer”, European Software Process Improvement (EuroSPI) (2009) 27. Haumer, P., “Eclipse Process Framework Composer: Part 1 and Part 2”, IBM Rational Software (2007)
- 50 -


![[PDF]Download Lean In New E-Book](https://p.pdfkul.com/img/300x300/pdfdownload-lean-in-new-e-book_59f126031723dd46d3c01b3e.jpg)