SPINE Volume 36, Number 2, pp 137–145 ©2011, Lippincott Williams & Wilkins
CLINICAL CASE SERIES
Muscle Atrophy and Changes in Spinal Morphology Is the Lumbar Spine Vulnerable After Prolonged Bed-Rest? Daniel L. Belavy´, PhD,* Gabriele Armbrecht, PhD,* Carolyn A. Richardson, PhD,† Dieter Felsenberg, MD, PhD,* and Julie A. Hides, PhD†‡
Study Design. Prospective longitudinal study. Objective. To evaluate the effect of bed-rest on the lumbar musculature and soft-tissues. Summary of Background Data. Earlier work has suggested that the risk of low back injury is higher after overnight bed-rest or spaceflight. Changes in spinal morphology and atrophy in musculature important in stabilizing the spine could be responsible for this, but there are limited data on how the lumbar musculature and vertebral structures are affected during bed-rest. Methods. Nine male subjects underwent 60-days head-down tilt bed-rest as part of the second Berlin Bed-Rest Study. Disc volume, intervertebral spinal length, intervertebral lordosis angle, and disc height were measured on sagittal plane magnetic resonance images. Axial magnetic resonance images were used to measure cross-sectional areas (CSAs) of the multifidus (MF), erector spinae, quadratus lumborum, and psoas from L1 to L5. Subjects completed low back pain (LBP) questionnaires for the first 7-days after bed-rest. Results. Increases in disc volume, spinal length (greatest at lower lumbar spine), loss of the lower lumbar lordosis, and move to a From the *Centre for Muscle & Bone Research, Charite Campus Benjamin Franklin, Free University & Humboldt University, Berlin, Germany; †School of Health and Rehabilitation Sciences, The University of Queensland, Brisbane, Australia; and ‡Mater/UQ Back Stability Clinic, Mater Health Services Brisbane Limited, Queensland, Australia. Acknowledgment date: September 1, 2009. Revision date: November 10, 2009. Acceptance date: November 11, 2009. The manuscript submitted does not contain information about medical device(s)/drug(s). Institutional funds were received in support of this work. No benefits in any form have been or will be received from a commercial party related directly or indirectly to the subject of this manuscript. Supported by the German Research Foundation (DFG) (grant FE 468/5-1) and a postdoctoral fellowship from the Alexander von Humboldt Foundation (to D.L.B.). The second Berlin Bed-Rest Study was supported by grant 14431/02/ NL/SH2 from the European Space Agency and grant 50WB0720 from the German Aerospace Center (DLR). The second Berlin Bed-Rest Study was also sponsored by Novotec Medical, Charite Universitätsmedizin Berlin, Siemens, Osteomedical Group, Wyeth Pharma, Servier Deutschland, P&G, Kubivent, Seca, Astra-Zeneka, and General Electric. IRB approval/Research Ethics Committee: The ethical committee of the Charité Universitätsmedizin Berlin granted ethical approval for this study. Address correspondence and reprint requests to Daniel L. Belavy´, BPhty, PhD, Zentrum für Muskel- und Knochenforschung, Charité Campus Benjamin Franklin, Hindenburgdamm 30, D-12200 Berlin, Germany; E-mail: belavy@ gmail.com DOI: 10.1097/BRS.0b013e3181cc93e8 Spine
more lordotic position at the upper lumbar spine (P � 0.0097) were seen. The CSAs of all muscles changed (P � 0.002), with the rate of atrophy greatest at L4 and L5 in MF (P � 0.002) and at L1 and L2 in the erector spinae (P � 0.0006). Atrophy of the quadratus lumborum was consistent throughout the muscle (P � 0.15), but CSA of psoas muscle increased (P � 0.0001). Subjects who reported LBP after bed-rest showed, before reambulation, greater increases in posterior disc height, and greater losses of MF CSA at L4 and L5 than subjects who did not report pain (all P � 0.085). Conclusion. These results provide evidence that changes in the lumbar discs during bed-rest and selective atrophy of the MF muscle may be important factors in the occurrence of LBP after prolonged bed-rest. Key words: magnetic resonance imaging, microgravity, inactivity, low back pain, spaceflight. Spine 2011;36:137–145
I
t has been suggested that bed-rest, as short as overnight, can result in an increased risk of low back injury on rising.1 After spaceflight, where the typical loading patterns of the spine seen on Earth are removed, astronauts show a much higher incidence of intervertebraldisc her-niation than the general population or an Army aviation population.2 Overnight bed-rest3 and spaceflight4 increase the size of the lumbar discs, which in turn has been linked to an increase in disc hydration.3 In prolonged (�4 weeks) bed-rest, which is commonly used for spaceflight simulation,5 lengthening of the spine, loss of the lumbar lordosis, increases in disc size, and increases in disc height have been observed.4,6,7 These changes may increase the biomechanical vulnerability of the lumbar discs to failure8 as well as stresses on other lumbar structures.9,10 Furthermore, changes in spinal length and shape of the lumbar lordosis during bed-rest can alter the action of the musculature at the lumbar spine.11 The neuromuscular system has a critical role in preventing injury of the lumbar spine.12,13 For example, the multifidus (MF) muscle is important in stabilizing the lumbar segments,14,15 controlling the lumbar lordosis,16–18 and withstanding compressive loading on the spine.17 Studies in long-duration bed-rest have shown that while greater atrophy of the spinal extensors occurs during prolonged bed-rest than of the spinal flexors (e.g., psoas [PS]),7,19 www.spinejournal.com
137
Copyright © 2011 Lippincott Williams & Wilkins. Unauthorized reproduction of this article is prohibited. BRS203517.indd 137
12/20/10 7:49 PM
BIOMECHANICS this atrophy appears to be greater in the lumbar MF muscle than in the erector spinae (ES) muscle.6,20 The motor control of the lumbopelvic musculature is also altered after long-duration bed-rest.21–23 These changes could compromise the ability of the neuromuscular system to control the movements of lumbar joints and structures and to prevent injury to spinal structures. In understanding the effect of (prolonged) bed-rest on the lumbar spine, a number of questions remain unanswered. No work has yet considered whether atrophy of the lumbar musculature is consistent across each of the different lumbar levels. This is an important consideration as, clinically, low back pain (LBP) is more frequent at the lower lumbar spine.24 A greater amount of muscle atrophy at a given vertebral segment, could compromise the ability of the neuromuscular system to stabilize that particular intervertebral segment. Also, little work has been performed to date considering in detail changes in disc shape and volume. These variables have been linked by biomechanical studies to increased stresses in the anular disc fibers,9 risk of tissue failure,8,9 and should be considered in greater detail to understand the potential effect of bed-rest to increase the vulnerability of the lumbar spine. In the current work, we aimed to examine morphologic changes in the lumbar spine using magnetic resonance imaging, including changes in disc volume and shape, during prolonged bed-rest. We also aimed to examine differential atrophy of the musculature of the lumbar spine during bedrest by measuring changes of cross-sectional area (CSA) in the MF, ES, PS, and quadratus lumborum (QL) muscles at each lumbar vertebral level. The occurrence of LBP after bed-rest was also considered.
MATERIALS AND METHODS Bed-Rest Protocol Nine medically and psychologically healthy males (age, 33.1 [7.8] years; weight, 80.6 [5.2] kg; height, 181.3 [6.0] cm) participated in the second Berlin BedRest Study and underwent 60-days of 6° head-down tilt (HDT) bed-rest. Exclusion criteria specifically relevant to the current study were a history of chronic LBP, a current episode of LBP, or any history of spinal operation. The study was approved by the ethical committee of the Charite Universitatsmedizin Berlin. All subjects gave their informed written consent before participation in the study. Between September 2007 and September 2008, the study was conducted at the Charite Campus Benjamin Franklin in Berlin, Germany, by the Centre for Muscle and Bone Research. Subjects attended the facility for the baseline data collection (BDC) from 9 days before a subsequent 60-day 6° HDT25 bed-rest period and remained in the facility for a 7-day post-bed-rest observation period. Subjects were monitored with 24-hour nursing care. Video surveillance also permitted monitoring of subjects’ activities at day and night and to ensure adherence to the study protocol. During the HDTphase, subjects performed all hygiene in the HDT position 138
www.spinejournal.com
Muscle Atrophy and Changes in Spinal Morphology • Belavy´ et al
and were discouraged from moving excessively or unnecessarily.
LBP Questionnaires At baseline magnetic resonance (MR)-scanning (BDC-8/-9), 2 days before bed-rest (BDC-2), every day during the first 2 weeks of bed-rest (HDT1 to HDT14), at weekly intervals (HDT18, HDT25, HDT32, HDT39, HDT46, HDT53, HDT57), and in the 7-days of ambulant post-bed-rest recovery (R � 1 to R � 7), subjects were asked to fill out a LBP questionnaire. Subjects were asked to report whether LBP was present, mark its location on a body chart and its intensity on a Visual Analogue Scale (VAS).26 Incidence of LBP was defined as any report of pain or discomfort between the first lumbar vertebrae and the coccyx.
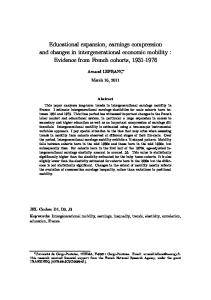
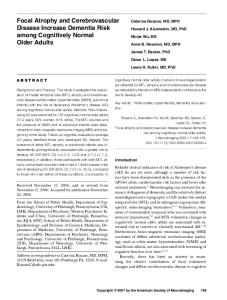
Magnetic Resonance Imaging Protocol Imaging was performed before bed-rest during the BDC period (BDC; either 9 or 8 days before bed-rest), then again on either day 27 or day 28 (HDT27/28) of bed-rest and at the end of bed-rest on day 55 or day 56 (HDT55/56), using a 1.5-T Siemens Avanto scanner (Erlangen, Germany). Subjects were required to remain in the horizontal supine position for 2 hours before the start of the imaging procedure, and other body regions were imaged for an additional hour before the sequences for the current study being performed. For measurements of spinal morphology, 29 sagittal images (thickness, 3 mm; inter- slice distance, 3.3 mm; repetition time, 5240 milliseconds; echo time, 101 milliseconds; field of view, 380 � 380 mm interpolated to 320 � 320 pixels) were taken to encompass the entire vertebral body and include the transverse processes of the lumbar spine in a field of view from the lower thoracic spine (typically T10) to the sacrum (Figure 1). The operator was in- F1 structed to then position 5 groups of 3 slices each (slice thickness, 4 mm; interslice distance, 4 mm; repetition time, 7560 milliseconds; echo time, 97 milliseconds; field of view, 260 � 234 mm interpolated to 320 � 288 pixels) over the transverse process of each vertebral body from L1 to L5 and to then angulate each group of slices to be parallel to the superior F2 vertebral endplate of its vertebra (Figure 2).
Image Measurements To ensure measurer blinding to study time-point, each dataset was assigned a random number (available at: www.random. org). ImageJ 1.38� (available at: http://rsb.info.nih.gov/ij/) was used for MR image analyses, which were conducted manually by the same operator (D.L.B.). The following measures of spinal morphology were conducted in every image where the required anatomic landmarks could be delineated (Figure 1): 1. Intervertebral length is the length of a line drawn between the dorsorostral corners of S1 and the T12, L1, L2, L3, L4, and L5 vertebral bodies and its angle were measured. The vertical distance between the dorsorostral corner of S1 and the other vertebral bodies was then calculated via simple trigonometry. The intervertebral length was then calculated (e.g., January 2011
Copyright © 2011 Lippincott Williams & Wilkins. Unauthorized reproduction of this article is prohibited. BRS203517.indd 138
12/20/10 7:49 PM
BIOMECHANICS
Muscle Atrophy and Changes in Spinal Morphology • Belavy´ et al
Figure 1. Measurements of spinal morphology. Left: before bedrest; right: at end of bed-rest in same subject. Disc volume was interpolated from sagittal plane disc area measurements of each lumbar intervertebral disc (shown at L3/4 on left side of image). Anterior and posterior disc height was also measured (shown between L2/3 at left). Intervertebral angle was calculated between lines drawn at the superior endplate of each vertebra (left at L5 and S1). Spinal length (right) was measured between each vertebra from the vertical distances between the dor- sorostral corner of S1 and the dorsorostral corners T12, L1, L2, L3, L4, and L5. Note the lengthening of the spine at the end of bed- rest, increase in disc size and flattening of the spinal curvature.
between T12 and L1 by subtracting the distance between S1 and L1 from the vertical distance between S1 and T12). 2. Disc volume of each disc from T12–L1 to L5–S1 was interpolated from all sagittal plane CSA measures of each disc. 3. Anterior and posterior disc height were measured from the ventral caudal and ventrorostral corners (anterior disc height) to the dorsocaudal and dorsorostral corners (posterior disc height) of the vertebral bodies between T12–L1 and L5–S1. 4. Intervertebral angles were measured as the angle between lines drawn parallel to the superior endplates of each vertebra from T12 to S1. Positive values denoted a “lordosis” between vertebrae and negative values indicating a “kyphosis” between vertebrae. Bilateral CSA measurements of the lumbar MF, ES, QL, and PS muscles were conducted (Figure 2), and the average CSA from each of the 3 images at each vertebral level was calculated. CSA measures were then averaged between left and right sides for each muscle at each vertebral level. To accurately delineate MF and the more laterally placed lon- gis-
simus muscle, the fascial border27 separating these 2 muscles was used as an anatomic landmark.
Further Data Processing To assess for potential biomechanical implications of the changes in spinal morphology during bed-rest, the ratio of the transverse-plane disc area/sagittal plane disc height were calculated.9 Sagittal plane disc height was determined as the average of posterior and anterior disc height for a given disc. Transverse-plane area was determined as (disc volume)/(sagittal plane disc height).
Statistical Analyses Linear mixed-effects models28 in the “R” statistical environment (version 2.6.1, available at: www.r-project.org) were used to fit models to each of the spinal morphology variables (intervertebral length, disc volume, disc height [anterior and posterior], intervertebral angles, and the ratio transverseplane-disc-area/sagittal-plane-disc-height) with factors of study-date (BDC, HDT27/28, HDT55/56), vertebral-level (T12–L1, L1/2, L2/3, L3/4, L4/5, L5-S1), and a vertebrallevel � study-date interaction as well as linear covariates of baseline BDC subject age, height, and weight. Random effects
Figure 2. Muscle cross sectional area measurements. Left of image: CSA measurements of the PS, ES, and MF muscles were made from L1 to L5. QL was measured from L1 to L4 as it was typically absent at L5. Arrows indicate the fascial border between MF and ES, which aided delineation of these 2 muscles. Right of image, positioning of images at each vertebral level; 3 images were obtained at each vertebral level and the CSA for each muscle was averaged between these 3 images. Spine
www.spinejournal.com
139
Copyright © 2011 Lippincott Williams & Wilkins. Unauthorized reproduction of this article is prohibited. BRS203517.indd 139
12/20/10 7:49 PM
BIOMECHANICS for subject and vertebral-level within subject were permitted and where necessary allowances for heterogeneity of variance (such as due to vertebral-level and/or study-date). For the variable of disc height, an additional factor of disc-region (posterior disc, anterior disc), relevant interactions, random effects, and allowances for heterogeneity of variance were added. Subsequent analysis of variance assessed the significance of each of the factors and interactions. An � of 0.05 was taken for statistical significance. Where a significant factor (such as study- date) was found, post hoc contrasts examined the differences at each level of the factor. To assess differential atrophy between and within muscles, the percentage change in muscle CSA at for each subject, muscle and vertebral-level was calculated at HDT27/28 and HDT55/56. For each muscle (ES, PS, MF, QL), separate nonlinear mixed effects models28 were then fitted with fixed effects for vertebral level. As modeling “time” (weeks of bed-rest) as both exponential decay and linear models yielded similar results for ES, MF and QL, the results from the linear model are presented here for ease of interpretation (an exponential decay model was inappropriate for PS due to increases in CSA observed). Random effects for subject and muscle (or vertebral- level) within subjects were included. Allowances were made for heterogeneity of variance between vertebral-level and study- date. Where analysis of variance suggested differences between vertebral-levels within a given muscle, post hoc contrasts between evaluated the significance of the differences in the rate of CSA change between individual vertebral-levels. To assess the relationship between the occurrence of LBP during bed-rest and in the week after bed-rest and changes during bed-rest, the percentage change in each of the morphologic and muscle CSA variables at HDT55/56 compared to baseline was calculated. Then, linear mixed-effects models were fitted in similar fashion to above except that factors of occurrence of LBP during or after bed-rest (“yes” or “no”), vertebral-level and their interaction were used as main effects. Where appropriate, post hoc comparisons then evaluated the association of LBP occurrence with a particular spinal morphology or muscle CSA variable.
RESULTS Before bed-rest, on the days when baseline MR-scanning was performed, no subjects reported LBP. One subject reported central LBP (VAS � 12) when questioned 2 days before bedrest. During bed-rest, 4 subjects reported central LBP. In 3 of these subjects, pain was reported on 1 day only (1 each on HDT1 [VAS � 14], HDT2 [VAS � 33], and HDT5 [VAS � 26]), and the fourth subject reported pain on HDT2 (VAS � 19) and HDT3 (VAS � 12). For the rest of the bed-rest phase beyond HDT5, none of the subjects reported LBP. In the first week after bed-rest, 5 of the 9 subjects reported LBP. Of these, 3 subjects reported LBP on the same day as reambulation (lasting 1 day in 2 subjects and 4 days in another). One subject reported LBP starting only on day-2 after bed-rest (lasting 3 days) and the fifth subject reported LBP on day-7 after bedrest. Four subjects reported central LBP and a fifth reported 140
www.spinejournal.com
Muscle Atrophy and Changes in Spinal Morphology • Belavy´ et al
left-sided LBP. The median VAS score reported was 14 (of 100; range, 6-42). Of the 5 subjects who reported LBP after bedrest, only 2 had reported LBP during the bed-rest phase. In no case were there reports of pain radiation into the lower limbs.
Changes in Spinal Morphology During Bed-Rest
Disc volume differed between the vertebral levels (F � 29.3, P � 0.0001) and increased during bed-rest (study- date, F � 28.1, P � 0.0001) (Table 1). While the volume of the T12–L1 vertebral disc did not change during bedrest (both P � 0.54), there were strong increases in volume in the lumbar discs (all P � 0.038 except L2/3 disc at HDT55/56). Overall, however, there was no statistical evidence for a different response in each of the discs (study-date � intervertebral-level: F � 1.2, P � 0.30), indicating a homogenous increase (in cm3) across all discs. Analysis of the percentage change in disc volume yielded similar results. On average, the lumbar discs were increased by mean (SEM) 1.8 (0.3) cm3 (t � 6.7, P � 0.00001) in volume, or 6.5%, at the end of bed-rest. The height of the lumbar discs differed both between vertebral levels (F � 36.6, P � 0.0001) as well as between the anterior and posterior aspects of the discs (region: F � 677.4, P � 0.0001; intervertebral-level � region: F � 21.1, P �0.0001; Table 1). Over the course of the bed-rest phase, the response of the posterior and anterior aspects of the disc differed between vertebral levels (study-date: F � 72.0, P � 0.0001; study-date � intervertebral-level: F � 2.1, P � 0.028; study-date � region: F � 0.5, P � 0.60; study-date � intervertebral-level � region: F � 2.4, P � 0.0097). This effect is depicted in Figure 3; at the lower lumbar discs, the increase in disc height occurs posteriorly, with no significant changes in anterior disc height in the L3/4, L4/5, and L5-S1 vertebral discs. At L2/3 and above, the increases in disc height become more pronounced anteriorly, and the increases in the posterior aspect of the disc are lower compared to the lower lumbar vertebrae. These results are in line with the observed changes in the intervertebral angles: the lower lumbar discs (predominately L4/5) move in kyphotic direction, whereas from L2/3 and above, the vertebrae are seen to move into either a more lordotic position (L2/3, L1/2) or show a nonsignificant flattening from an initially kyphotic position (T12–L1) (Table 1). These differences between the vertebrae on changes in intervertebral angle were significant (study-date � intervertebral-level: F � 3.8, P � 0.0002; study-date: F � 0.9, P � 0.39; intervertebrallevel: F � 149.5, P � 0.0001). The changes in intervertebral length during bed-rest also varied across the vertebral levels (study-date � in- tervertebrallevel: F � 3.5, P � 0.0005; study-date: F � 67.1, P � 0.0001; intervertebral-level: F � 25.6, P � 0.0001). Although no significant change was seen between the T12 and L1 vertebral levels (Table 1), the increases in intervertebral length were much greater at the lower lumbar vertebrae (Table 1, Figure 4). Overall, the length of the lumbar spine (vertical height between the dorsorostral corner of L1 and S1) increased from 178.7 mm at baseline by 4.2 (0.6) mm at HDT27/28 (t � 7.7, P � 0.00001) and by 4.9 (0.5) mm, or 2.8%, by the end of bed-rest (t � 10.3, P � 0.00001). January 2011
Copyright © 2011 Lippincott Williams & Wilkins. Unauthorized reproduction of this article is prohibited. BRS203517.indd 140
12/20/10 7:49 PM
BIOMECHANICS
Muscle Atrophy and Changes in Spinal Morphology • Belavy´ et al
TABLE 1. Spinal Morphology Before and During Bed-Rest Vertebral Level Study Date
T12–L1
L12
L2/3
L3/4
L4/5
L5-S1
Disc volume (cm3) BDC
18.4 (2.8)
22.6 (2.7)
29.6 (2.7)
32.5 (2.7)
31.7 (3.0)
23.9 (3.5)
HDT27/28
17.8 (2.2)
24.1 (2.2)*
31.8 (2.2)*
34.0 (2.5)t
34.4 (2.6)t
26.0 (3.0)*
HDT55/56
18.1 (2.7)
24.0 (2.6)*
30.8 (2.5)
34.1 (2.8)t
34.2 (3.1)t
26.3 (3.4)*
BDC
7.2 (0.5)
9.1 (0.6)
10.8 (0.6)
12.1 (0.6)
13.1 (0.8)
13.6 (0.8)
HDT27/28
7.8 (0.6)†
9.9 (0.6)†
11.6 (0.6)†
12.4 (0.7)
13.2 (0.8)
13.8 (0.9)
HDT55/56
7.8 (0.7)†
9.9 (0.7)†
11.5 (0.7)†
12.5 (0.8)
13.3 (0.8)
13.8 (0.9)
BDC
4.8 (0.4)
6.2 (0.4)
7.2 (0.4)
7.3 (0.5)
6.9 (0.4)
5.3 (0.4)
HDT27/28
5.1 (0.4)t
6.5 (0.4)
7.9 (0.4)*
8.3 (0.4)†
7.7 (0.4)†
6.0 (0.4)†
HDT55/56
4.9 (0.4)
6.6 (0.4)*
8.1 (0.4)t
8.1 (0.4)†
7.5 (0.4)†
6.0 (0.4)†
BDC
–0.6 (0.7)
–0.2 (0.5)
1.7(1.0)
6.3(0.5)
13.8(1.0)
24.9(1.2)
HDT27/28
–0.7 (0.7)
0.3 (0.4)*
2.5(0.8)
5.6 (0.6)
12.4(1.0)*
24.8(1.3)
HDT55/56
–0.4 (0.6)
0.2 (0.5)
2.5 (0.8)†
5.7 (0.5)†
12.5 (1.0)t
24.4(1.1)
BDC
33.3 (0.6)
36.1 (0.6)
36.9 (0.5)
37.6(0.5)
36.6 (0.6)
31.5(1.0)
HDT27/28
33.5 (0.5)
36.5 (0.6)*
37.9 (0.4)†
38.8 (0.4)t
37.7 (0.5)t
32.1 (1.1)*
HDT55/56
33.5 (0.4)
36.9 (0.5)†
38.1 (0.4)†
38.7 (0.5)t
37.6 (0.6)t
32.4 (1.0)t
Anterior disc height (mm)
Posterior disc height (mm)
Intervertebral angle (°)
Intervertebral length (mm)
Values are mean (SEM). P � 0.01.
*
†P � 0.05. ‡P � 0.001 and indicate significance of difference to baseline value. For disc volume and height measures, T12–L1 indicates the T12–L1 vertebral disc, for intervertebral length it indicates the vertical distance between the dorsorostral corners of T12 and L1 and for the intervertebral angle it indicates the angle between the superior endplates of T12 and L1 (with positive angles indicating a lordosis between the 2 vertebrae. BDC indicates baseline data collection; HDT, head-down tilt.
Figure 3. Percentage change in disc height at each vertebral level during bed-rest. Values are SEM percentage change compared to baseline in either the anterior or posterior aspect of the disc at each vertebral level. HDT27/28: scanning performed on 27th and 28th days of bedrest; HDT55/56: scanning performed on the 55th and 56th days of bed-rest. Note that the lower lumbar discs show increases in height predominately anteriorly, whereas increase in posterior disc height becomes progressively greater at the upper lumbar levels and changes in anterior disc height relatively less. For significance of changes at each vertebral level and study date (Table 1). Spine
www.spinejournal.com
141
Copyright © 2011 Lippincott Williams & Wilkins. Unauthorized reproduction of this article is prohibited. BRS203517.indd 141
12/20/10 7:49 PM
BIOMECHANICS
Muscle Atrophy and Changes in Spinal Morphology • Belavy´ et al
Figure 4. Percentage change in intervertebral length during bed- rest. Values are SEM percentage change compared to baseline in intervertebral length (vertical distance between the dorsorostral corners of 2 adjacent vertebrae). HDT27/28: scanning performed on 27th and 28th days of bed-rest; HDT55/56: scanning performed on the 55th and 56th days of bedrest. The length increases between T12 and L1 are marginal (P � 0.08), whereas strong increases between all the vertebrae of the lumbar spine (all P � 0.005) were observed (Table 1).
To consider the effect of spinal morphology changes on intervertebral biomechanics, the disc transverse plane area/ sagittal plane disc height ratio was also evaluated. Significant changes in this ratio were seen over the course of the study (study-date: F � 5.3, P � 0.0063). While the area-height ratio varied between vertebral levels (inter- vertebral-level: F � 14.1, P � 0.0001), the changes over the course of the study did not (study-date � interverte- bral-level: F � 1.3, P � 0.22). At baseline, the mean (SEM) area/height ratio was 36.0 (3.1). At HDT27/28, the ratio was decreased by –1.7 (0.6) (–4.8%; t � -3.0, P � 0.0038) and by –1.9 (0.6) (–5.2%; t � –3.0, P � 0.0037), indicating that the increase in height of the discs during bed-rest was relatively greater than the increase in transverse plane area.
Percentage Changes in CSA per Week Within and Between Muscles T2 Table 2 gives the CSA values for each muscle at each vertebral level on each study-date. To enable ease of comparison be-
tween muscles at a given vertebral level and also within muscles between vertebral levels, the percentage change in muscle CSA per week was examined. At every vertebral level (L1, L2, L3, L4, and L5), the rates of CSA change varied between the muscles (all F � 7.7, all P � 0.0002). When the MF muscle was examined alone and each vertebral level compared, significant differences were apparent in the rates of CSA change at each vertebral level (F � 4.1, P � 0.0041; Figure 5). The CSA F5 change per week was significantly greater at L4 and L5 than at L1 and L2 (P � 0.004). The rate of CSA decrease at L4 and L5 was also marginally faster than at L3 (P � 0.051). In the ES muscle, the rate of CSA decrease also differed between vertebral levels (F � 5.5, P � 0.0006; Figure 5) and was fastest at L1 (P � 0.005 compared to L3, L4, and L5), with the rate of atrophy at L2 being marginally faster than at L4 and L5 (P � 0.0227). In QL, the rate of CSA change did not differ significantly between vertebral levels (F � 1.8, P � 0.15; Figure 5), though on average, significant decreases of –1.0 (0.2)% in CSA per week did occur (intercept-term:
Figure 5. Percentage change in lumbar muscle CSA per week during bed-rest. Values are SEM percentage change in CSA per week of bed-rest at each lumbar vertebral level (L1–L5) in the muscles PS, ES, MF, and QL. *P � 0.05, †P � 0.01, ‡P � 0.001, positioned either above or below the error bars for a given mean indicate significance of difference of the mean to zero.
142
www.spinejournal.com
January 2011
Copyright © 2011 Lippincott Williams & Wilkins. Unauthorized reproduction of this article is prohibited. BRS203517.indd 142
12/20/10 7:49 PM
BIOMECHANICS
Muscle Atrophy and Changes in Spinal Morphology • Belavy´ et al
TABLE 2. Lumbar Muscle Cross-Sectional Area Before and During Bed-Rest Vertebral Level Study Date
L1
L2
L3
L4
L5
BDC
245.5 (13.3)
330.2 (21.7)
472.2 (26.0)
753.1 (34.1)
952.1 (32.3)
HDT27/28
236.2 (13.1)
316.4(21.0)
461.2(25.2)
678.9 (31.7)*
850.7 (26.2)*
HDT55/56
230.7 (13.0)*
317.2 (20.3)
439.0 (24.8)†
651.6 (32.5)†
835.8 (26.6)†
BDC
1908.2 (63.8)
2166.5 (57.2)
2090.5 (63.1)
1731.9 (90.6)
1280.4 (87.5)
HDT27/28
1731.2 (60.0)†
1985.0 (52.8)†
1941.8 (57.4)†
1604.3 (85.3)†
1155.4 (82.4)*
HDT55/56
1655.7 (60.2)†
1920.9 (54.7)†
1890.1 (59.8)†
1579.5 (86.4)†
1173.1 (79.6)*
BDC
162.3 (20.4)
394.3 (19.9)
601.1 (50.9)
769.4 (36.0)
—
HDT27/28
156.0 (23.4)
386.5 (19.2)
543.7 (50.1)†
716.8 (28.7)‡
—
HDT55/56
154.2 (19.3)
369.6 (19.2)*
530.8 (49.4)†
700.9 (29.8)*
—
BDC
182.3 (21.7)
665.5 (54.2)
1267.0 (90.6)
1815.4 (118.1)
1999.4 (101.0)
HDT27/28
184.7 (21.1)
712.8 (53.5)†
1330.7 (89.5)†
1867.4 (115.2)
2016.8 (98.2)
HDT55/56
205.9 (21.7)
715.6 (54.0)†
1330.4 (90.3)*
1870.6 (115.9)
2023.4 (99.1)
Multifidus
Erector spinae
Quadratus lumborum
Psoas
Values are mean (SEM) in mm . *P � 0.01. †P � 0.001 and indicate significance of difference to baseline value. ‡P � 0.05. Quadratus lumborum not present at L5. Values have been adjusted for subject anthropometric characteristics (age, height, weight). BDC indicates baseline data collection; HDT, head-down tilt. 2
F � 16.7, P � 0.0001). The rate of increase in PS muscle CSA also varied between vertebral levels (F � 9.9, P � 0.0001; Figure 5) with the effect being most pronounced at the upper lumbar levels. At the L4 and L5 vertebral levels, no significant rate of CSA change was apparent (P � 0.16), and the rates of CSA increase were significantly higher at L1, L2, and L3 than at these lower lumbar levels (P � 0.0149).
Relationship Between LBP Occurrence During and After Bed-Rest and Changes in Spinal Morphology and Muscle CSA LBP occurrence during bed-rest (which was localized to the first week; mentioned earlier in the text) bore no relation to changes in spinal morphology at the end of bed-rest (all P � 0.099). Similarly, there was no relationship to changes in muscle CSA (all P � 0.112) with the exception of MF CSA at L5 where the subjects who experienced LBP during bed-rest showed a trend (P � 0.057) to less loss of CSA (7.3 [3.8]% less) than those subjects who did not experience LBP. In contrast, subjects who reported LBP in the week after bed-rest showed greater percentage reductions in MF muscle CSA during bed-rest at L4 (9.5 [2.5]% greater reduction, t � -3.85, P � 0.00027) and L5 (6.2 [3.5]% greater reduction, Spine
t � -1.74, P � 0.085), but with no difference at the upper lumbar levels (all P � 0.57). There was no relationship between the percentage change in ES, PS, and QL muscle CSA during bed-rest and the occurrence of LBP in the first week after bed-rest (all P � 0.41). Also, these subjects showed a greater increase in posterior disc height at L5-S1 (14.0 [6.9]% more, t � 2.03, P � 0.04) and L4/5 (8.9 [5.0]% more, t � 1.78, P � 0.08) than subjects who did not experience LBP after bed-rest. At L3/4 and above, there was no difference between the subjects with or without LBP after bed-rest for posterior disc height (all P � 0.40). These same subjects also showed a greater increase in interver-tebrallength (1.0 [0.4]% more, t � 2.7, P � 0.029), anterior disc height (4.6 [2.7]% more; t � 1.66, P � 0.14), and disc volume (2.2 [3.6]% more; t � 0.61, P � 0.56) at the end of bed-rest than subjects who did not experience LBP, though these effects were either marginal statistically or nonsignificant. Correspondingly, the subjects who experienced LBP after bed-rest also showed greater reductions in the ratio of transverse disc area to sagittal disc height, but this effect was marginal statistically. LBP occurrence after bed-rest was unrelated to changes in the curvature of the lumbar spine during bed-rest (P � 0.09). www.spinejournal.com
143
Copyright © 2011 Lippincott Williams & Wilkins. Unauthorized reproduction of this article is prohibited. BRS203517.indd 143
12/20/10 7:49 PM
BIOMECHANICS DISCUSSION This study had a number of novel and interesting findings. First, we observed that differential atrophy occurred in the paraspinal musculature during bed-rest. The lumbar MF muscle atrophied to a greater extent and faster at the lower lumbar levels (L4, L5) than higher in the lumbar spine. In contrast, the ES muscle demonstrated greatest losses of CSA at L1. These decreases in CSA were not just due to the muscles being larger at these levels at the start of bed-rest as the percentage change in CSA was also significantly greater at these vertebral- levels. The QL muscle also atrophied and while this was statistically strongest at L3, the results suggested that the atrophy was evenly distributed through the muscle. The PS muscle showed increases in muscle CSA, which were most pronounced at the upper lumbar levels. Another important finding was that subjects who experienced LBP after bed-rest were those who showed greater increases in posterior disc height at L4 and L5, greater increases in intervertebral length, and greater losses of MF muscle CSA at L4 and L5 during bed-rest. The occurrence of LBP after bed-rest was unrelated to changes in the ES, PS, or QL muscles during bed-rest. In this study, the pattern of change seen in spinal morphology was a generalized increase in disc volume (i.e., no disc affected more than the others), lengthening of the spine (which was greater at lower lumbar vertebral levels), loss of the lordosis from L3 to S1, but a relative increase in lordosis at the upper lumbar spine and a flattening at the thoracolumbar junction. The changes in disc height corresponded to the changes in curvature at the lower lumbar spine, given that the posterior aspect of the disc increased in height much more than anterior part. At upper lumbar/lower thoracic levels, anterior disc height increased, and the changes in posterior disc height were less pronounced than at lower lumbar levels. While these patterns of change may seem intuitive, this is the first time they have been reported in such detail. The consistency of disc volume changes through the lumbar spine is surprising, given that greater compressive loads are likely exerted on the lower lumbar spine than the upper lumbar spine during daily activities, but is similar to prior work.6 The observed changes in spinal morphology and muscle size changes could contribute to an increased risk of injury to the lumbar spine after bed-rest. Biomechanical modeling studies9 have suggested that the increases in disc height observed during bed-rest would lead to an increase zygapophysial joint load on reambulation and also increase overall motion of the intervertebral segments. The ratio of transverse-plane disc area to sagittal plane disc height decreased during bed-rest, which implies that anular fiber stress would be higher and also that disc stiffness would be decreased (increased flexibility) after bed-rest.9 This suggests that greater demands would be placed on the muscular system to provide active stiffness to the intervertebral segments after bed- rest.29 In contrast to being able to meet these increased demands, critical components of the muscular system are deconditioned in this situation. The MF muscle in particular shows the fastest rates of atrophy at the lower lumbar spine. This muscle typically provides 60% to 80% of the active stiffness to the lumbar segments,14,15 and is important in controlling intervertebral motion at the lumbar spine.16–18 Deconditioning 144
www.spinejournal.com
Muscle Atrophy and Changes in Spinal Morphology • Belavy´ et al
of this, and other, muscles could impair their ability to support the lumbar spine, particularly at the lower lumbar segments. Localized muscle atrophy at a particular lumbar segment is considered to increase the risk of injury to that vertebral segment.30,31 Also, postural muscles, such as the ES, are atrophied and with the observed increases in size of the PS muscle, it is possible that an imbalance of muscle loading on the spine could occur. Importantly, despite the low number of subjects in the current study, there was a relationship between the occurrence of LBP after bed-rest and the changes observed in the lumbar spine during bed-rest. Greater increases in disc height and loss of MF muscle CSA (both at L4 and L5) during bed-rest, as well as lengthening of the spine were associated with the incidence of LBP after bed-rest. While other factors, such as greater increases in disc volume and increases in anterior disc height were also related to LBP incidence after bed-rest, these effects were not significant, statistically. The findings on the relationship of MF muscle atrophy with LBP incidence are consistent with findings on the long-term recurrence of LBP.31 Critically, the occurrence of LBP during bed-rest was unrelated to changes in muscle CSA or spinal morphology. Of the 9 subjects, 5 reported LBP in the first week after bed-rest. While it is difficult to compare this incidence rate to known epidemiological injury rates, it is nonetheless high for such a short period of time and also consistent with another recent report from bed-rest.32 Overall, the findings suggest that the changes in the lumbar spine, particularly in atrophy of the MF muscle and increase in posterior disc height at the lower lumbar spine, could increase the risk of LBP after prolonged bed-rest. The results of the current study help to give a better understanding as to why higher rates of LBP onset may be seen after rising in the morning,1 and why astronauts may have a higher incidence of disc herniation than the general population or an Army aviation population.2 The current study also provides further evidence against the use of bed-rest in the management of LBP.
➢ Key Points This work helps to explain prior findings of an increased risk of lumbar injury after an overnight bed-rest and in astronauts. During prolonged bed-rest a generalized increase in lumbar disc volume occurs, with greater lengthening of spine occurring at the lower lumbar segments. Measured in the supine position, there is a reduction in the lower lumbar lordosis and at the upper lumbar spine, a change from a flat to more lordotic position. Differential muscle atrophy occurs at the lumbar spine during bed-rest, with the fastest rates of atrophy occurring in the lumbar MF at the lower lumbar spine and the ES at the upper lumbar spine. The incidence of LBP after bed-rest was related to greater increases in posterior disc height, greater increases in intervertebral length, and greater MF muscle atrophy at the lower lumbar spine during bed-rest. January 2011
Copyright © 2011 Lippincott Williams & Wilkins. Unauthorized reproduction of this article is prohibited. BRS203517.indd 144
12/20/10 7:49 PM
BIOMECHANICS Acknowledgments The authors thank the subjects who participated in the study, the staff of the Pflegedirektion, the nurses who cared for the subjects and the many colleagues at the Charite, who all helped make the second Berlin Bed-Rest Study a success.
References
1. Varma KM, Porter RW. Sudden onset of back pain. Eur Spine J 1995;4:145–7. 2. Johnston SL, Wear ML, Hamm PB. Increased incidence of herniated nucleus pulposus among astronauts and other selected populations [abstract]. Aviat Space Environ Med 1998;69:220. 3. Boos N, Wallin A, Gbedegbegnon T, et al. Quantitative MR imaging of lumbar intervertebral disks and vertebral bodies: influence of diurnal water content variations. Radiology 1993;188:351–4. 4. Le Blanc AD, Evans HJ, Schneider VS, et al. Changes in intervertebral disc cross-sectional area with bed rest and space flight. Spine 1994;19:812–7. 5. Pavy-Le Traon A, Heer M, Narici MV, et al. From space to Earth: advances in human physiology from 20 years of bed rest studies (1986–2006). Eur J Appl Physiol 2007;101:143–94. 6. Belavy DL, Hides JA, Wilson SJ, et al. Resistive simulated weightbearing exercise with whole body vibration reduces lumbar spine deconditioning in bed-rest. Spine 2008;33:E121–31. 7. Cao P, Kimura S, Macias BR, et al. Exercise within lower body negative pressure partially counteracts lumbar spine deconditioning associated with 28-day bed rest. J Appl Physiol 2005;99: 39–44. 8. Lu YM, Hutton WC, Gharpuray VM. Do bending, twisting, and diurnal fluid changes in the disc affect the propensity to prolapse? A viscoelastic finite element model. Spine 1996;21:2570–9. 9. Natarajan RN, Andersson GB. The influence of lumbar disc height and cross-sectional area on the mechanical response of the disc to physiologic loading. Spine 1999;24:1873–81. 10. Adams MA, Dolan P, Hutton WC, et al. Diurnal changes in spinal mechanics and their clinical significance. J Bone Joint Surg Br 1990;72:266–70. 11. McGill SM. Kinetic potential of the lumbar trunk musculature about three orthogonal orthopaedic axes in extreme postures. Spine 1991;16: 809–15. 12. Panjabi M, Abumi K, Duranceau J, et al. Spinal stability and intersegmental muscle forces. A biomechanical model. Spine 1989;14:194–200. 13. Lucas DB, Bresler B. Stability of the Ligamentous Spine, Technical Report No. 40. San Fransisco, CA: Biomechanics Laboratory, University of California; 1961. 14. Kiefer A, Shirazi–Adl A, Parnianpour M. Synergy of the human spine in neutral postures. Eur Spine J 1998;7:471–9.
Spine
Muscle Atrophy and Changes in Spinal Morphology • Belavy´ et al
15. Wilke HJ, Wolf S, Claes LE, et al. Stability increase of the lumbar spine with different muscle groups-a biomechanical in-vitro study. Spine 1995;20: 192–8. 16. Macintosh JE, Bogduk N. The biomechanics of the lumbar multifidus. Clin Biomech 1986;1:205–31. 17. Kiefer A, Shirazi-Adl A, Parnianpour M. Stability of the human spine in neutral postures. Eur Spine J 1997;6:45–53. 18. Claus AP, Hides JA, Moseley GL, et al. Different ways to balance the spine: subtle changes in sagittal spinal curves affect regional muscle activity. Spine 2009;34:E208–14. 19. Le Blanc AD, Schneider VS, Evans HJ, et al. Regional changes in muscle mass following 17 weeks of bed rest. J Appl Physiol 1992;73:2172–8. 20. Hides JA, Belavy’ DL, Stanton W, et al. MRI assessment of trunk muscles during prolonged bed rest. Spine 2007;32:1687–92. 21. Belavy’ DL, Ng JK, Wilson SJ, et al. Influence of prolonged bed-rest on spectral and temporal electromyographic motor control characteristics of the superficial lumbo-pelvic musculature. J Electromyogr Kinesiol 2010;20: 170–9. 22. Belavy DL, Richardson CA, Wilson SJ, et al. Superficial lumbopelvic muscle overactivity and decreased co-contraction after 8-weeks of bed-rest. Spine 2007;32:E23–9. 23. Belavy DL, Richardson CA, Wilson SJ, et al. Tonic to phasic shift of lumbo-pelvic muscle activity during 8-weeks of bed-rest and 6-months follow-up. J Appl Physiol 2007;103:48–54. 24. Hides J, Gilmore C, Stanton W, et al. Multifidus size and symmetry among chronic LBP and healthy asymptomatic subjects. Man Ther 2008; 13:43–9. 25. Nicogossian AE, Dietlein LF. Microgravity simulation and analogues. In: Nicogossian AE, ed. Space Physiology and Medicine. Philadelphia, PA: Lea & Febiger; 1982:240–8. 26. Downie WW, Leatham PA, Rhind VM, et al. Studies with pain rating scales. Ann Rheum Dis 1978;37:378–81. 27. Bogduk N. Clinical Anatomy of the Lumbar Spine and Sacrum. 3rd ed. London, United Kingdom: Churchill Livingstone; 1997. 28. Pinheiro JC, Bates DM. Mixed-Effects Models in S and S-PLUS. 1st ed. New York, NY: Springer; 2000. 29. Panjabi MM. The stabilizing system of the spine. Part II. Neutral zone and instability hypothesis. J Spinal Disord 1992;5:390–6; discussion 397. 30. Hides JA, Richardson CA, Jull GA. Multifidus muscle recovery is not automatic after resolution of acute, first-episode low back pain. Spine 1996;21:2763–9. 31. Hides JA, Jull GA, Richardson CA. Long-term effects of specific stabilizing exercises for first-episode low back pain. Spine 2001;26:E243–8. 32. Holguin N, Muir J, Rubin C, et al. Short applications of very lowmagnitude vibrations attenuate expansion of the intervertebral disc during extended bed rest. Spine J 2009;9:470–7.
www.spinejournal.com
145
Copyright © 2011 Lippincott Williams & Wilkins. Unauthorized reproduction of this article is prohibited. BRS203517.indd 145
12/20/10 7:49 PM