NBER WORKING PAPER SERIES
THE FEDERAL RESERVE AS AN INFORMED FOREIGN EXCHANGE TRADER: 1973 – 1995 Michael D. Bordo Owen F. Humpage Anna J. Schwartz Working Paper 17425 http://www.nber.org/papers/w17425
NATIONAL BUREAU OF ECONOMIC RESEARCH 1050 Massachusetts Avenue Cambridge, MA 02138 September 2011
The authors thank Maggie Jacobson for her research assistance and Christopher J. Neely and an anonymous referee for comments on an earlier draft. Research on this paper was funded by the Federal Reserve Bank of Cleveland where Michael Bordo is a frequent Visiting Scholar. The views expressed herein are those of the authors and do not necessarily reflect the views of the Board of Governors of the Federal Reserve System, the Federal Reserve Bank of Cleveland, or the National Bureau of Economic Research. NBER working papers are circulated for discussion and comment purposes. They have not been peerreviewed or been subject to the review by the NBER Board of Directors that accompanies official NBER publications. © 2011 by Michael D. Bordo, Owen F. Humpage, and Anna J. Schwartz. All rights reserved. Short sections of text, not to exceed two paragraphs, may be quoted without explicit permission provided that full credit, including © notice, is given to the source.
The Federal Reserve as an Informed Foreign Exchange Trader: 1973 – 1995 Michael D. Bordo, Owen F. Humpage, and Anna J. Schwartz NBER Working Paper No. 17425 September 2011 JEL No. E52,E58,F31,N22 ABSTRACT If official interventions convey private information useful for price discovery in foreign-exchange markets, then they should have value as a forecast of near-term exchange-rate movements. Using a set of standard criteria, we show that approximately 60 percent of all U.S. foreign-exchange interventions between 1973 and 1995 were successful in this sense. This percentage, however, is no better than random. U.S. intervention sales and purchases of foreign exchange were incapable of forecasting dollar appreciations or depreciations. U.S. interventions, however, were associated with more moderate dollar movements in a manner consistent with leaning against the wind, but only about 22 percent of all U.S. interventions conformed to this pattern. We also found that the larger the size of an intervention, the greater was its probability of success, although some interventions were inefficiently large. Other potential characteristics of intervention, notably coordination and secrecy, did not seem to influence our success rates.
Michael D. Bordo Department of Economics Rutgers University New Jersey Hall 75 Hamilton Street New Brunswick, NJ 08901 and NBER
[email protected] Owen F. Humpage Federal Reserve Bank of Cleveland P.O. Box 6387 Cleveland, OH 44101-1387
[email protected]
Anna J. Schwartz NBER 365 Fifth Ave, 5th Floor New York, NY 10016
[email protected]
3 The Federal Reserve as an Informed Foreign-Exchange Trader: 1973 - 1995 There is no evidence, nor does anybody here [in the FOMC] believe that there is any evidence, to confirm that sterilized intervention does anything. Alan Greenspan, FOMC Transcripts, 3 October 2000, p. 14
1. Introduction In mid-1973, shortly after the onset of generalized floating, the United States started intervening in the foreign-exchange market, buying or selling foreign currencies in an effort to influence dollar exchange rates. By 1995, however, the United States had all but abandoned these operations. The evidence over the intervening years suggested that intervention was more of a hindrance to good policy than a contribution. Starting in the late 1980s, Federal Open Market Committee (FOMC) participants increasingly questioned the effectiveness of intervention. They believed that if intervention were to have anything other than a fleeting, hitor-miss effect on exchange rates, monetary policy had to support it. This stricture, however, implied that intervention did not afford the Federal Reserve an instrument with which to systematically affect exchange rates independent of monetary policy. Intervention could interfere with the FOMC’s domestic policy objectives. Moreover the impetus for U.S. intervention after 1985 came largely from the U.S. Treasury, which is primarily responsible for intervention in the United States. Despite having separate legal authority for intervention, the Federal Reserve System found that it could not easily avoid participating in Treasury initiated operations. Under these circumstances, the FOMC feared, intervention must weaken confidence in the System’s commitment to price stability, which at the time the committee was avidly attempting to strengthen (Broaddus and Goodfriend 1996, Goodfriend 2010, Bordo, Humpage, and Schwartz 2010b). While many other advanced countries followed suite, intervention operations never entirely ended. The Japanese Ministry of Finance, for example, undertook frequent—and at times massive—operations between 1991 and 2004 with an eye toward limiting the yen’s appreciation against the dollar (Ito 2003, 2005, 2007). The United States, for its own part, has participated in two operations against Japanese yen and one against euros since the summer of 1995. The recent global financial turmoil has encouraged a limited resurgence of intervention. Japan has again intervened, once with U.S. cooperation. The Swiss National Bank has also intervened heavily in an effort to limit the franc’s appreciation against the euro and the dollar. Emerging markets, including Brazil, Chile, and Israel, have also intervened. The often heightened volatility of exchange rates since 2007 has prompted some economists to recommend the limited use of intervention (Neely 2011). This paper reviews the U.S. experience from 1973 through 1995 in search of lessons pertinent to any modern re-evaluation of intervention policy. Following Humpage (1999, 2000), we construct reasonable success criteria based on the correspondence between interventions and daily exchange-rate movements. We count the number of observed successes under each criterion and assess whether that count exceeds the number that might occur randomly given the near-martingale nature of daily exchange-rate changes. A high success count indicates that intervention has value as a forecast of near-term exchange-rate patterns and implies that intervention conveys information useful for price discovery. We also investigate whether
4 various characteristics of an intervention, such as its size, frequency, or coordination, can increase its probability of success. We find that 60 percent of all U.S. interventions between 1973 and 1995 were successful under our criteria—a percentage that is no better than random. This result occurs because U.S. purchases and sales of foreign exchange show no systematic correspondence with dollar depreciations or appreciations, respectively. U.S. interventions, however, often did accompany same-day moderations of dollar exchange-rate movements in a manner broadly consistent with leaning against the wind. While these successes were generally greater than random, they accounted for less than one-fourth of all U.S. interventions, and were not universally robust across time periods and currencies. We also found that the larger the size of an intervention, the greater is its probability of success, although an intervention can be inefficiently large. Other characteristics of interventions, notably coordination, seem to have had no apparent influence on our success rates. This paper proceeds as follows: The next section draws a key distinction between sterilized and nonsterilized interventions and discusses the theoretical channels through which sterilized intervention might operate. Section 3 explains our three success criteria, our data, and our counting methods. Section 4 evaluates our success counts under the assumption that successes are hypergeometric random variables. Section 5 checks the robustness of our results across various subperiods. Section 6 uses probit regressions to see if various characteristics of an intervention alter the probability of success. Section 7 concludes with some discussion of our results and a few comparisons to earlier work. 2. Background Except for the instruments involved, the mechanics of an intervention are similar to those of an open-market operation, and like an open-market operation, foreign-exchange interventions have the potential to alter bank reserves. The Federal Reserve—like most large central banks— routinely sterilizes the impact of all U.S. foreign-exchange operations on the monetary base (Neely 2001, Lecourt and Raymond 2006). Sterilization prevents foreign-exchange transactions from interfering with the domestic objectives of monetary policy. In contrast to the sterilized variety, nonsterilized intervention, which alters the monetary base, is essentially equivalent to introducing an exchange-rate target into a central bank’s reaction function. While presenting the central bank with an additional policy target, nonsterilized intervention fails to offer an additional independent instrument with which to attain that target. If an undesirable movement in the exchange rate should stem from a domestic monetary shock, then counteracting it through purchases of foreign exchange is wholly redundant to doing so through traditional open-market operations (see Bonser-Neal et al. 1998, Humpage 1999).1 On the other hand, if the initial, underlying shock to the exchange rate is something other than domestic and monetary in nature, then attempting to achieve an exchangerate objective through either nonsterilized intervention or traditional open-market operations can interfere with the attainment of a central bank’s domestic policy goals. If, for example, the dollar depreciates vis à vis a foreign currency because the foreign central bank tightens its monetary policy, then conducting nonsterilized intervention to stabilize the dollar lowers inflation below the Federal Reserve’s desired level. Sterilized intervention is useful to policy makers only to the extent that it provides a mechanism for systematically affecting exchange rates independent of their domestic monetary
5 policy objectives. Theoretically, sterilized intervention might influence exchange rates through a portfolio-balance channel, an inventory-adjustment channel, an expectations channel or a coordination mechanism.2 A portfolio-balance channel should offer central banks a way to routinely affect exchange rates without interfering with their domestic monetary-policy objectives. Sterilized intervention has no effect on the monetary base, but it alters the currency composition of publically held government securities. Specifically, the act of sterilizing an intervention increases outstanding debt denominated in the currency that central banks are selling relative to debt denominated in the currency that central banks are buying. If risk-averse asset holders view securities in different currency denominations as imperfect substitutes, they will hold the relatively more abundant asset in their portfolio only if the expected rate of return on this asset compensates them for the perceived risks of doing so.3 Their initial reluctance to hold the relatively more abundant security forces a spot depreciation of the currency that central banks are selling relative to the currency that they are buying. The spot depreciation relative to the exchange rate’s longer-term expected value then raises the anticipated rate of return on the now more-abundant securities and compensates asset holders for the perceived increase in risk.4 Unfortunately, most empirical studies do not find that intervention affects exchange rates through a portfolio-balance mechanism (Edison 1993). Typically, the relevant coefficients in these studies are either statistically or quantitatively insignificant, or unstable across time periods and currencies. A notable exception is Dominguez and Frankel (1993a) who find support for a portfolio-balance channel. In general, central banks put little stock in this mechanism (Neely 2007). A variation of the standard portfolio-balance channel, the inventory-adjustment mechanism, describes how intervention might affect exchange rates in the very short run (Evan and Lyons 2001, 2005, Lyons 2001). These models focus on the role of foreign-exchange dealers, who, as market makers, stand ready to buy and sell foreign exchange. These same dealers typically do not hold sizable open positions in a foreign currency, especially overnight (Cheung and Chinn 2001). They will try to distribute their unwanted currency holdings among other dealers and eventually among their commercial customers. Since different currencies are not perfect substitutes in the dealers’ portfolios, this inventory-adjustment process resembles a portfolio-balance-like mechanism at the micro level. Evans and Lyons (2001, 2005) claim evidence of both temporary—dealer-to-dealer inventory reshuffling—and permanent—dealer-tocustomer—portfolio-balance effects. The permanent component of this model, however, is at odds with the macro literature. Alternatively, sterilized intervention might exert some influence over foreign-exchange rates by affecting market expectations about future exchange-rate changes. Unlike the portfoliobalance mechanism, an expectations channel does not alter the fundamental determinants of exchange rates, but changes perceptions of those fundamentals. This may quickly shift exchange rates to an alternative path, but one that is still consistent with those unchanged fundamentals. For the expectations channel to work, information must be costly and asymmetrically distributed, and monetary authorities must have private information about exchange rates that they can convey to the market through their interventions (Baillie, Humpage, and Osterberg 2000). Survey evidence does suggest that information is asymmetrically distributed (Cheung and Chinn 2001). Large foreign-exchange traders have better information than smaller traders and transfer that information through their trades. Any traders—including monetary
6 authorities—that others suspect of having superior information could affect prices, if market participants observed their trades. Should we expect central banks to routinely possess a significant informational advantage over private-market participants? Mussa (1981) initially suggested that a central bank might signal unanticipated changes in monetary policy through its interventions. This signal would have credence because the monetary authority will incur a capital loss on its foreign-exchange position if it fails to carry through with its policy signal. Because of this condition, the signaling channel does not offer monetary authorities a mechanism through which they can routinely affect exchange rates independent of their monetary policies. Monetary authorities, however, often claim to intervene when they view current exchange rates as being inconsistent with market fundamentals, implying that they have an information advantage beyond prospective changes in monetary policy. Central banks have large staffs that gather and analyze data, and they maintain ongoing informational relationships with major banks. Through their frequent contacts with market participants, central banks can aggregate the private information of individual traders and disseminate this information through intervention (Popper and Montgomery 2001). If monetary authorities routinely have better broad-based information than other market participants, then their interventions should accurately predict near-term exchange-rate movements. In extreme cases of information imperfections, when a substantial portion of market participants base their trades on extrapolations of past exchange-rate movements, exchange rates might remain misaligned, even if more-informed traders feel that current exchange rates are inappropriate. In the presence of strong bandwagon effects or collective-action problems, informed traders may have recently lost money and withdrawn temporarily from the market, causing the misalignment to persist. In such cases, sterilized intervention might offer a coordinating signal to those traders that react to fundamentals (Sarno and Taylor, 2001 and Reitz and Taylor, 2008). This coordination channel does not require that a central bank necessarily have better information than the market. The signal bolsters traders’ confidence about their own expectations and encourages them to take positions. It does seem to require, however, that monetary authorities lack credibility. A credible central bank could simply announce that the exchange rate is misaligned (Reitz and Taylor 2008). In the next section, we test whether U.S. interventions had value as a forecast of subsequent exchange-rate movements. As such, our tests seem consistent with an expectations channel or, possibly, a coordination mechanism. 3. Success Counts We evaluate the success of U.S. foreign-exchange operations using two specific criteria and a general criterion that incorporates the first two. In all of the definitions that follow, It designates U.S. intervention on day t, with positive (negative) values being sales (purchases) of foreign exchange. St is the opening (9:00 a.m.) spot bid for foreign exchange in the New York market on day t measured in foreign-currency units per U.S. dollar, and ΔSt = St+1 – St. The change in the exchange rate from the opening on day t to the opening on day t+1 brackets U.S. interventions on day t.5 The target exchange rate is either German marks per dollar or Japanese yen per dollar, and It consists only of the corresponding intervention, that is, dollars against German marks or dollars against Japanese yen.
7 Our first binomial success criterion (SC1) counts an official U.S. sale or purchase of foreign exchange on a particular day as a success (SC1=1) if the dollar appreciates or depreciates, as the case may be, over that same day: 1)
1 SC1 0
if I t 0, and St 0, or if I t 0, and St 0; otherwise.
Our second success criterion (SC2) scores an intervention as a success (SC2=1) if the United States sells foreign exchange and the dollar continues to depreciate, but does so by less than over the previous day. Likewise, this criterion counts intervention as a success if the United States buys foreign exchange and the dollar continues to appreciate, but does so by less than over the previous day. (For completeness, we include ΔSt = 0 in this criterion.) 2)
1 SC 2 0
if I t 0, and St -1 0, and St 0, and St St , or if I t 0, and St -1 0, and St 0, and St St 1 ; otherwise.
Our general success criterion (SC3) incorporates SC1 and SC2. Accordingly, an intervention sale of foreign exchange on a particular day is successful (SC3=1) if the dollar appreciates or if it depreciates by less than on the previous day. A corresponding rule holds for dollar purchases of foreign exchange. 3)
if I t 0, and St 0, or St St 1 or 1 SC3 if I t 0, and St 0, or St St 1; 0 otherwise.
We measure success over a single day, which some may find unduly restrictive (Goodhart and Hesse 1993, Fatum and Hutchison 2002). Despite the narrow window, the chance that we might fail to count an intervention as successful because the appropriate exchange-rate movement occurred beyond the opening on day t+1 seems remote. Chang and Taylor (1998), Chueng and Chinn (2001), and Dominguez (2003), among others, suggest that exchange markets begin to respond to intervention within minutes or hours, not days. Likewise, a majority of central bank officials in Neely’s (2001) survey contended that exchange rates reflect the full effects of intervention within hours. Alternatively, by keeping the window narrow, we may count an intervention as a success even though the exchange-rate change that led us to that conclusion subsequently disappears. Opening the event window beyond a single day to limit this problem, however, quickly causes overlap among interventions, making inferences about the likelihood of an intervention’s success impossible. We assume, as in Dominguez (2003, p. 34), that U.S. monetary authorities base a decision to intervene on day t only on past information about exchange rates. We believe this to be an accurate characterization of how U.S. policy makers generally reach their decision to intervene, although the Desk may sometimes adjust the amount of an intervention in response to market reactions (Neely 2001, Baillie and Osteberg 1997). If exchange-rate changes and interventions are jointly determined on day t, our counts could contain a bias (Neely 2005).
8 Although we do not model a specific transmission mechanism for intervention, we assume that intervention operates through an expectations channel. We are testing to see if U.S. monetary authorities have an informational advantage that they impart to the market through their interventions (ala Popper and Montgomery 2001). If central-bank intervention does indeed impart new information to the market, private traders will immediately incorporate it into their exchange-rate quotes. This information may be positive; that is, the market may interpret the intervention in the manner that the central bank intends. Alternatively, this information may be negative; that is, the market may react to an intervention in the opposite manner than the central bank desires. Our tests look to uncover this. 4. Evaluation Following Henriksson and Merton (1981) and Merton (1981), we evaluate our success count under the assumption that the number of successes is a hypergeometric random variable. The hypergeometric distribution seems appropriate because it does not require individual interventions to be independent events and does not depend on a presumed probability of an individual success. To apply the Henriksson and Merton methodology, we must consider intervention sales and purchases of foreign exchange separately. Our null hypothesis compares the actual and the expected success counts. We reject the null and conclude that intervention has positive forecast value if the success count exceeds the expected number by two standard deviations. We reject the null and conclude that intervention has negative forecast value if the actual number of successes lies below the expected number by more than two standard deviations. If we cannot reject the null hypothesis, we conclude that the number of successes is not different than a number that could randomly occur given the near martingale nature of daily exchange-rate changes. This approach also assumes that intervention does not change fundamental macroeconomic determinants of exchange rates. This supposition seems appropriate given that the Federal Reserve routinely sterilizes all U.S. interventions and given the lack of evidence that sterilized intervention works through a portfolio-balance mechanism. The failure of this assumption to hold would bias our results toward finding a high number of successes in any sample. Table 1 presents our results for the entire sample period, 2 March 1973 through 19 March 1997.6 During these 6,274 business days, the United States intervened on 971 days against German marks and on 243 days against Japanese yen.7 The first intervention against German marks took place on 10 July 1973, and the first intervention against Japanese yen followed on 24 January 1974. The United States intervened against German marks roughly four times as often as it did against Japanese yen. Roughly 60 percent of U.S. interventions against Japanese yen involved purchases of yen, suggesting that the United States often thought that the market overpriced the dollar. Interventions against the German mark were more evenly distributed between purchases and sales of marks, with only a slight bias toward mark purchases. (See, however, the discussion of pre-1980 interventions in section 5.) The first column in table 1 lists the success criteria for the German marks (top section) and Japanese yen (bottom section). The second column shows official U.S. intervention purchases and sales. Between 2 March 1973 and 19 March 1997, for example, the United States sold German marks on 469 days and bought German marks on 502 days. The next two columns of data show intervention successes. Of the 469 U.S. sales of German marks, 136, or 29.0
9 percent, were successful under criterion SC1; that is, each of these 136 interventions was associated with a same-day dollar appreciation. The next two columns show virtual successes. Virtual successes follow the respective success criteria outlined in equations 1 through 3, absent any consideration of intervention. The dollar, for example, appreciated against the German mark—whether or not the United States intervened against marks—on 2,951, or 47.0 percent, of the 6,274 business days in our sample. The final two columns in table 1 refer to the hypergeometric distribution. If successes are hypergeometric random variables, then in a sample of 6,274 observations with a virtual success rate of 47.0 percent, we would expect to observe 221 successes in 469 interventions, purely by chance. The observed number of successes, 136, falls more than two standard deviations below the expected value, implying that the United States had negative forecast value. This value is so low that market participants, who knew when the United States intervened, could have bet against the United States—bought German marks on day t—and made money on average. From an expectations-channel perspective, a U.S. sale of German marks signaled that the dollar would depreciate over the same day as the intervention. Similar results hold for purchases of German marks, implying that the United States had negative forecast value in this case too. The corresponding success counts for U.S. official interventions against Japanese yen, however, were no different than random. In contrast to the results under success criterion SC1, the success counts under SC2, for both U.S. interventions against German marks and Japanese yen, are more than two standard deviations above their expected values, indicating that U.S. interventions had positive forecast value with respect to criterion SC2. When the dollar is depreciating and the United States sells foreign exchange, it is a good bet that the dollar will continue to depreciate, but will do so by less than on the day prior to the intervention. Likewise, when the dollar is appreciating and the United States buys foreign exchange, it is a good bet that the dollar will continue to appreciate, but will do so by less than on the day prior to the intervention. While the successes under criterion SC2 clearly exceed the expected number, the overall frequency of this type of success is fairly low. Only 23 percent of all U.S. interventions against German marks and 19 percent of all U.S. interventions against Japanese yen were successful under the SC2 criterion. The final, general success criterion, SC3, combines SC1 and SC2. Generally, we expect that approximately 60 percent of all interventions will be successful under at least one of our success criteria purely by chance. (See the virtual counts under SC3 in table 1.) The total number of actual successes under SC3 is—in all but one case—no better than random. The exception is the total for U.S. sales of German marks, which falls more than two standard deviations below the expected number. 5. Robustness We repeated our counting analysis for various subperiods as a robustness check. We start by dividing the sample into two parts: The first broad subperiod runs from 2 March 1973, when generalized floating was just beginning, through 17 April 1981, when the Reagan administration announced its minimalist intervention strategy. The second broad subperiod extends from 20 April 1981, the start of the minimalist period, through 19 March 1997, the end of our sample period. Next, we divided each of these two subperiods further.
10 Table 2 summarizes our results for the various subperiods, with N and P indicating that the number of actual successes for a specific criterion was, respectively, two standard deviations below or above the expected number and suggesting, respectively, that intervention had negative or positive forecast value for a designated criterion.8 An R in table 2 indicates that the observed number of successes was no different than the number that we expect purely by chance. The table cautions that overall conclusions about intervention are not necessarily robust across time periods or across currencies within any time period. Nevertheless, some relatively persistent patterns stand out: First, U.S. intervention in German marks prior to 17 April 1981 universally had negative forecast value (N) with respect to criterion SC1 and universally had positive forecast value (P) with respect to criterion SC2. Often during this time period—certainly before 15 September 1977—the United States feared that private traders might interpret an intervention as a sign that the dollar was fundamentally weak and that market participants might bet against the System’s interventions.9 Our results validate this concern. To avoid such an adverse response, the United States typically transacted in small amounts through the agency of a commercial bank in the broker’s market. Operating in this manner kept the System anonymous. In addition, Green (1984, #127), who once managed U.S. foreign-exchange operations, suggests that over this time period, U.S. policy makers usually only hoped to smooth exchange-rate movements; that is, the United States usually cared more about results under SC2 than under SC1. Moreover, despite what the numbers of purchases and sales might suggest, the United States typically sought only to moderate dollar depreciations—not appreciations. The United States, however, often financed its foreign-exchange sales through swap drawings and had to repurchase the dollars to repay the swaps fairly quickly. These repurchases may have had no exchange-rate objective, other than to avoid creating market disorder in the process. Second, U.S. interventions against Japanese yen prior to the Plaza Accord—with few exceptions—seem unsuccessful under each of our three criteria. Prior to the Plaza Accord, however, the United States rarely intervened against Japanese yen. With so few observations, drawing firm conclusions about the success of U.S. interventions against Japanese yen may be risky. (A similar caveat applies to the interventions against German marks over the 20 April 1981 through 29 March 1985 minimalist period.) Nevertheless, the counts do not seem supportive of an active intervention strategy Third, the large U.S. interventions associated with the Plaza and Louvre Accords (1 April 1985 through 29 April 1988) and with the U.S. Treasury led interventions of the very late 1980s and early 1990s, had overall success counts that were not obviously different than previous episodes. Economists have often regarded the interventions following the Plaza and Louvre accords as highly successful. The failure to find positive forecast value under SC1 suggests that U.S. interventions could not have maintained a target-zone arrangement once the dollar reached a band. We do, however, find evidence of positive forecast value under SC2 for U.S. purchases and sales of German marks during the Plaza and Louvre period, for U.S. sales of Japanese yen during both of the final two subperiods, and for U.S. purchases of yen in the last period. Fourth, U.S. interventions lack positive forecast value under success criterion, SC3, during every subperiods portrayed in table 2. Our overall finding that fewer than 60 percent of U.S. interventions had positive forecast value seems consistent across time periods and currencies.
11 6. Conditional Probability Tables 1 and 2 describe the unconditional probabilities of success under our three criteria. U.S. monetary authorities, however, conceivably could have increased their odds of success by altering the way in which they undertook an intervention. Tables 3 through 6 present a series of probit regressions that attempt to describe how various conditioning variables affected the outcome. Tables 3 and 5 show estimates for only U.S. interventions against German marks and Japanese yen, respectively, over our entire sample period—2 March 1973 through 19 March 1997. Tables 4 and 6 consider shorter sample periods, which allow us to include, respectively, published data on German and Japanese intervention in our probit regressions. Data on German intervention against U.S. dollars are publicly available between 1 January 1976 and 29 December 1995, and data on Japanese intervention against U.S. dollars are publicly available between 1 January 1991 and 19 March 1997. The dependent variable in all cases is our general success criterion, SC3, since we do not know whether the United States was pursuing criterion SC1 or SC2, at any particular time. The independent variables in the various probit regressions appear in first columns of tables 3 through 6. We drop nonintervention days from the sample and run the regression only over observations containing intervention. Although a few variables appear to be statistically significant in specific cases, the only variable that consistently explains the likelihood of success across all of the estimates in tables 3 through 6 is the dollar amount of a U.S. intervention. The results for those other variables that sometimes appear significant are either not robust to changes in the sample size (necessary to include foreign intervention) or across currencies, or they prove collinear with the amount of U.S. intervention. The United States, for example, often undertook intervention in concert with the Bundesbank or the Bank of Japan. A coordination dummy is significant for the German mark at time t, but lowers the likelihood of success (table 4). German intervention at t, however, appears collinear with the amount of U.S. intervention. The United States spends more on average when Germany has intervened ($113.4 million) than when Germany has not entered the market ($89.1 million). At time t+1, however, U.S.-Bundesbank coordination is not significant. When we add the amount of German intervention at either time t or at time t+1 to U.S. intervention at time t to construct a new amount variable consisting of the total amount of intervention (U.S. and/or German), the amount is not significant. Given the time difference between Frankfurt and New York and given the timing convention in this paper, German intervention at t and t+1 overlaps a U.S. intervention on day t, so we should consider both measures of intervention. Similarly, the coordination dummy for Japanese intervention on day t is significant and suggests that coordinated intervention increases the likelihood of success. All but one U.S. intervention over this period, however, are coordinated with Japan on day t, so the variable adds virtually no additional information. Given the time difference between Tokyo and New York and given our timing conventions, comparing Japanese intervention at t+1 with SC3 at time t seems appropriate, but when we do so, the coefficient suggests that coordinated intervention lowers the likelihood of success. When we instead add the amount of Japanese intervention at either time t or time t+1 to U.S. intervention again creating a new series of total U.S. and/or Japanese intervention, the amount is not statistically significant. The dummy variables that consider the sign on the previous day’s intervention—lagged same-type intervention and lagged different-type intervention—are both significant in the
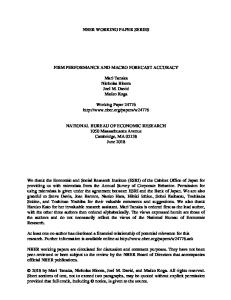
12 German mark case (tables 3 and 4), but not in the Japanese yen case (tables 5 and 6). For the German mark case, these variables seem collinear with the amount of U.S. intervention. Figure 1 uses the coefficient estimates for the amount of U.S. intervention (exclusive of foreign-intervention variables) from tables 3 and 5 to estimate how the probability of success responds to the size of intervention. Over the entire sample, the unconditional probability of a successful intervention against German marks using the SC3 criterion is 57 percent, while the probability of a virtual success is slightly higher, around 60 percent. Based on our estimates, a U.S. intervention of $110 million against German marks has a 60 percent probability of being successful. Over the entire sample period, 2 March 1973 through 19 March 1997, fewer than 25 percent of U.S. interventions against German marks were greater than $100 million. The mean intervention in our sample was $80 million, while the median intervention was only $31 million. The largest intervention against German marks amounted to $950 million. This amount is more than twice as large as was necessary to virtually guarantee success, about $400 million, and seems inefficiently large. Similarly, large interventions against Japanese yen increased the probability of success. Over the entire sample, the unconditional probability of success (SC3) for interventions against Japanese yen was 65 percent, somewhat higher than the probability of a virtual success at roughly 60 percent. We find that a U.S. intervention against Japanese yen of $187 million had a 65 percent probability of success. Over the entire sample, the average U.S. intervention against Japanese yen was $131 million, and the median intervention against Japanese yen equaled only $90 million. The largest intervention against Japanese yen amounted to $800 million. As is the case with U.S. intervention against German marks, this amount seems inefficiently large. We estimate that a U.S. intervention of roughly $510 million is sufficient to virtually guarantee success against Japanese yen. 7. Conclusion and Discussion Between the inception of generalized floating in 1973 and the FOMC’s abandonment of its active intervention policy in 1995, approximately 60 percent of all official U.S. transactions in the foreign-exchange market were associated with a same-day exchange-rate movement that U.S. authorities could have easily deemed a success. Given the near-martingale nature of exchangerate changes, this percentage is no different than what we expect to find purely by chance. Overall, U.S. intervention lacked value as a forecast of near-term exchange-rate movements. This general result, however, combines two very different outcomes: U.S. intervention sales and purchases of foreign exchange were generally incapable of forecasting dollar appreciations or depreciations, respectively. This negative result is robust across all time periods and both of the currencies that we considered, and prior to 1981, private-market participants could have profitably bet against U.S. interventions in German marks. In sharp contrast, we do find that U.S. intervention was associated with more moderate movements in the dollar in a manner consistent with leaning against the wind. A private trader observing U.S. intervention usually could have predicted this outcome. Neely and Weller (1997) and LeBaron (1999) cite leaning-against-the-wind intervention strategies as a reason for their finding that intervention improves the profitability of technical trading rules. That said, only about 22 percent of all U.S. interventions conformed to this pattern, and the result—while strong—is not universal across every time period and currency.
13 Our findings do not seem to reflect a purely U.S. phenomenon. Using like techniques, Chaboud and Humpage (2005) and Humpage and Ragnartz (2005) found similar results for Japanese interventions between 1991 and 2004 and Swedish interventions between 1993 and 2002, respectively. While our criteria are consistent with the notion of a successful intervention, they are not the only conceivable criteria. Greene (1984 #129) suggests some other criteria—for example wide bid-ask spreads—that U.S. monetary authorities have viewed as consistent with market disorder. Moreover, intervention, or even the threat of intervention, can affect market expectations and actions in ways that such criteria cannot easily capture. Galati, Melick, and Micu (2005), for example, investigate how the higher moments of market expectations, which they derive from the distribution of option prices, respond to intervention. We also found some evidence that the likelihood of success—measured broadly (SC3)— increased with the amount of intervention. Large U.S. interventions may convey private information better than small transactions. Our analysis suggests, however, that an intervention above approximately $400 million against German marks or $500 million against Japanese yen virtually guaranteed success. The three percent of all U.S. interventions that exceeded this amount were inefficiently large. We did not find evidence that coordinated intervention increased the likelihood of success. The empirical evidence on coordination seems mixed. Humpage (1999) found that coordination increased the probability of success by roughly 20 percent during the Louvre period (1987-1990). Dominquez and Frankel (1993a 1993b) also found in favor of coordination. Humpage and Osterberg (1992), however, found that unilateral U.S. interventions were more effective than coordinated interventions between 1983 and 1990. Chaboud and Humpage (2005) found only weak evidence that coordination increased the probability of success for Japanese interventions against dollars between 1991 and 2004. The importance of coordination may be situational. Also controversial is the relative importance of secrecy to an intervention’s effectiveness. Given that intervention often operates through an expectations channel, secrecy may seem counterproductive, but Bhattacharya and Weller (1997) and Vitale (1999) present theoretical models in which secrecy contributes to an intervention’s success. Dominguez and Frankel (1993a), Hung (1997), Chiu (2003), and Beine and Bernal (2007) also discuss various reasons for maintaining secrecy. Prior to the late 1970s, the System usually operated covertly. Thereafter, the System usually operated openly. In comparing our results across time periods consisting of various degrees of secrecy, we find no reason to believe that secrecy is important for success. Overall our analysis of the U.S. experience with sterilized foreign-exchange intervention between 1973 and 1997 cautions against a return to an active intervention policy. Our results suggest that U.S. policymakers did not routinely have private information useful for price discovery in the foreign-exchange market. Sterilized intervention seemed more of a hit-or-miss phenomenon than a sure bet. Chairman Greenspan’s observation, cited at the head of this paper, may have been a bit strong, but not by much.
TABLE 1: SUCCESS COUNTS FOR U.S. INTERVENTION: 2 March 1973 to 19 March 1997 OPENING BID QUOTES
German Marks Observations: Criterion SC1 sell marks buy marks total Criterion SC2 sell marks buy marks total Criterion SC3 sell marks buy marks total Japanese Yen Observations: Criterion SC1 sell yen buy yen total Criterion SC2 sell yen buy yen total Criterion SC3 sell yen buy yen total
TOTAL # 6274
INTERVENTION SUCCESSES # percent
VIRTUAL SUCCESSES # percent
EXPECTED SUCCESSES #
STANDARD DEVIATION #
469 502 971
136 192 328
29.0 38.2 33.8
2951 3007
47.0 47.9
220.6 240.6
8 9
469 502 971
117 110 227
24.9 21.9 23.4
820 807
13.1 12.9
61.30 64.57
4 4
469 502 971
253 302 555
53.9 60.2 57.2
3771 3814
60.1 60.8
282 305
12 13
94 149 243
47 63 110
50.0 42.3 45.3
3000 2836
47.8 45.2
45 67
5 5
94 149 243
19 28 47
20.2 18.8 19.3
740 829
11.8 13.2
11 20
1 2
94 149 243
66 92 158
70.2 61.7 65.0
3740 3665
59.6 58.4
56 87
6 7
6274
15 TABLE 2: A SUMMARY OF THE SUCCESS COUNTS ACROSS TIME PERIODS U.S. INTERVENTION AGAINST GERMAN MARKS SUCCESS CRITERION: SC1 SC1 SC2 SC2 SC3 SC3 sell/buy foreign exchange: sell buy sell buy sell buy sell buy
U.S. INTERVENTION AGAINST JAPANESE YEN SC1 SC1 SC2 SC2 SC3 SC3 sell buy sell buy sell buy sell buy
2 March 73 ‐ 19 March 97:
469
502
N
N
P
P
N
R
94
149
R
R
P
P
R
R
2 March 73 ‐ 17 April 81:
391
348
0
2
(none)
58
10
19
8 October 79 ‐ 17 April 81:
55
114
R R N R
1
10
R R
R R N R
P R P R
R
175
N N R R
R
15 September 77 ‐ 5 October 79:
P P P P
R
176
P P P P
31
161
N N N N
11
2 March 73 ‐ 14 September 77:
N N N N
R R R R
20 April 81 ‐ 19 March 97:
78
154
(none)
19
52
20
2 May 88 ‐ 19 March 97:
44
111
R R R R
11
33
R N R R
0
1 April 85 ‐ 29 April 88:
P P P R
R
24
P R P R
118
1
R N R R
83
20 April 81 ‐ 29 March 85:
R N R R
31
87
R R
R R R R
(none)
R R P (none)
P P
P P R P
(none)
R R R (none)
R R
R R R R
KEY: N = Negative forecast value. Observed number of successes falls below the expected number of successes by more than two standard deviations. P = Positive forecast value. Observed number of successes exceeds the expected number of successes by more than tow standard deviations. R = Random. Observed number of success falls within two standard deviations of the expected number of successes.
16 TABLE 3: DETERMINANTS OF THE LIKELIHOOD OF SUCCESS: U.S. INTERVENTION AGAINST GERMAN MARKS
INDEPENDENT VARIABLES estimation period: 2 March 1973 ‐ 19 March 1997 constant only amount of U.S. intervention (abs. value) buy foreign exchange (dummy) lagged same‐type intervention (dummy) lagged different‐type intervention (dummy) consecutive interventions (days) elapse since last intervention (days) compatible change in fed funds or discount rate (dummy)
Critical Chi‐Square value 1 d.f.
Constant t‐statistic:
Coefficient t‐statistic:
0.180 4.46 0.107 2.18 0.099 1.71 0.018 0.32 0.204 4.90 0.116 2.05 0.165 3.94 0.183 4.50
0.001 2.60 0.158 1.96 0.329 4.05 ‐0.47 ‐2.49 0.02 1.62 0.003 1.43 ‐0.436 ‐0.77
5 percent p-value
10 percent p-value
3.84
2.71
Log Likelihood Likelihood: Ratio test: ‐663.1 ‐659.6
6.99
‐661.2
3.83
‐654.8
16.44
‐659.92
6.29
‐661.74
2.65
‐661.86
2.41
‐662.8
0.60
17 TABLE 4: DETERMINANTS OF THE LIKELIHOOD OF SUCCESS: U.S. & GERMAN INTERVENTION AGAINST MARKS
INDEPENDENT VARIABLES estimation period: 1 January 1976 ‐ 29 December 1995 constant only amount of U.S. intervention (abs. value) buy foreign exchange (dummy) coordinated intervention; German on t (dummy) coordinated intervention; German on t+1 (dummy) total intervention; U.S. + German at t (abs. value) total intervention; U.S. + German at t+1 (abs. value) lagged same‐type intervention (dummy) lagged different‐type intervention (dummy) consecutive interventions (days) elapse since last intervention (days) compatible change in fed funds or discount rate (dummy)
Constant Coefficient Log Likelihood t‐statistic: t‐statistic: Likelihood: Ratio test: 0.160 3.42 0.046 0.77 0.10 1.48 0.336 5.04 0.216 3.48 0.176 2.95 0.167 2.80 0.017 0.26 0.177 3.71 0.12 1.90 0.14 2.91 0.163 3.47
‐494.6 0.001 3.01 0.12 1.32 ‐0.353 ‐3.75 ‐0.130 ‐1.37 ‐0.0001 ‐0.431 0.00 ‐0.17 0.289 3.08 ‐0.50 ‐1.87 0.01 0.87 0.003 1.47 ‐0.417 ‐0.73
‐489.9
9.43
‐493.7
1.75
‐487.5
14.12
‐493.6
1.89
‐494.48
0.19
‐494.56
0.03
‐489.8
9.49
‐492.8
3.57
‐494.2
0.75
‐493.28
2.58
‐494.3
0.543
18 TABLE 5: DETERMINANTS OF THE LIKELIHOOD OF A SUCCESS: U.S. INTERVENTION AGAINST JAPANESE YEN
INDEPENDENT VARIABLES estimation period: 2 March 1973 ‐ 19 March 1997 constant only amount of U.S. intervention (abs. value) buy foreign exchange (dummy) lagged same‐type intervention (dummy) lagged different‐type intervention (dummy) consecutive interventions (days) elapse since last intervention (days) compatible change in fed funds or discount rate (dummy)
Critical Chi‐Square value 1 d.f.
Constant t‐statistic:
Coefficient t‐statistic:
Log Likelihood Likelihood: Ratio test:
0.375 4.54 0.232 0.001 2.04 1.79 0.531 ‐0.249 3.90 ‐1.45 0.303 0.151 2.67 0.92 not applicable
‐157.9
0.391 3.27 0.347 4.03 0.371 4.489
‐0.01 ‐0.19 0.001 1.05 5.771 0.001
5 percent p-value
10 percent p-value
3.84
2.71
‐156.2
3.40
‐156.8
2.13
‐157.5
0.84
‐157.9
0.04
‐157.2
1.48
‐157.5
‐157.5
19 TABLE 6: DETERMINANTS OF THE LIKELIHOOD OF A SUCCESS: U.S. & JAPANESE INTERVENTION AGAINST YEN
INDEPENDENT VARIABLES estimation period: 1 January 1991‐ 19 March 1997 constant only amount of U.S. intervention (abs. value) coordinated intervention; Japanes on t (dummy) coordinated intervention; Japanese on t+1 (dummy) total intervention with Japanese at t (abs. value) total intervention with Japanese at t+1 (abs. value) buy foreign exchange (dummy) lagged same‐type intervention (dummy) lagged different‐type intervention (dummy) consecutive interventions (days) elapse since last intervention (days) compatible change in fed funds or discount rate (dummy)
Constant t‐statistic:
Coefficient t‐statistic:
Log Likelihood Likelihood: Ratio test:
0.605 2.12 ‐0.706 0.005 ‐1.11 2.09 ‐5.703 6.416 0.00 0.00 1.335 ‐1.221 2.52 ‐1.87 ‐0.333 0.001 ‐0.54 1.63 0.794 ‐0.0003 1.63 ‐0.48 0.97 ‐1.642 2.75 ‐2.14 0.634 ‐0.203 2.05 ‐0.25 not applicable
‐12.9
0.837 ‐0.203 0.86 ‐0.25 0.85 ‐0.003 2.30 ‐1.12 not applicable
‐9.6
6.58
‐11.5
2.73
‐10.9
3.92
‐11.0
3.81
‐12.8
0.24
‐10.4
5.06
‐12.9
0.06
‐12.9
0.06
‐12.3
1.24
20
Figure 1: The Probability of Success Probability 1.0 Against German Mark 0.8
0.6 Against Japanese Yen
0.4
0.2
0.0 10
30
50
80
90
100
150
200
300
400
Millions of Dollars
500
Appendix: Supplemental Tables This Appendix presents the eight tables summarized in table 2 of the text. Each of these tables corresponds exactly to the methodology use to construct table 1, which we explained in section 4 of this paper, except that we estimated each table for a separate subperiod. Table A1 covers all U.S. interventions from the inception of generalized floating until the United States first abandoned its active intervention policy in 1981. Table A1.1 considers intervention during the early dollar float, 1973-1977. Interventions were generally small, conducted primarily by the Federal Reserve through the brokers market to maintain anonymity, and generally financed through swap drawings. Table A1.2 covers the dollar crisis of 1977 through 1979. Intervention became larger, more frequent, less covert, and with more Treasury involvement. Swap lines remained a predominant source of funds. Table A1.3 focuses on the period 1979 to 1981when the dollar was beginning to strengthen, and the United States was attempting to acquire a portfolio of foreign exchange to avoid using the swap lines. Table A2 covers all U.S. interventions from the first minimalist intervention period in 1981 until the end of our sample in 1997. The active intervention policy ended in 1995. These interventions were generally larger, more frequent, and more overt. The United States generally financed them from its own portfolio of foreign exchange and split the transactions 50/50 between the Treasury and the Federal Reserve. Table A2.1 considers the minimalist intervention policy of the Regan administration, 1981 – 1985. The interventions were very infrequent. Table A2.2 covers the heavy interventions associated with the Plaza and Louvre accords, 1985 – 1988. These were often coordinated with foreign central banks and widely announced. Table A2.3 covers the heavy intervention in the late 1980s and early 1990s that prompted the FOMC’s concerns about its monetary credibility and the winding down of U.S. intervention policy.
TABLE A1: SUCCESS COUNTS FOR U.S. INTERVENTION: 2 March 1973 to 17 April 1981 OPENING BID QUOTES
German Marks Observations: Criterion SC1 sell marks buy marks total Criterion SC2 sell marks buy marks total Criterion SC3 sell marks buy marks total Japanese Yen Observations: Criterion SC1 sell yen buy yen total Criterion SC2 sell yen buy yen total Criterion SC3 sell yen buy yen total
TOTAL # 2121
INTERVENTION SUCCESSES # percent
VIRTUAL EXPECTED STANDARD SUCCESSES SUCCESSES DEVIATION # percent # #
391 348 739
103 124 227
26.3 35.6 30.7
964 1021
45.5 48.1
178 168
7 7
391 348 739
100 82 182
25.6 23.6 24.6
296 276
14.0 13.0
55 45
4 3
391 348 739
203 206 409
51.9 59.2 55.3
1260 1297
59.4 61.2
232 213
10 10
11 31 42
7 11 18
63.6 35.5 42.9
976 910
46.0 42.9
5 13
2 2
11 31 42
1 7 8
9.1 22.6 19.0
255 298
12.0 14.0
1 4
0 1
11 31 42
8 18 26
72.7 58.1 61.9
1231 1208
58.0 57.0
6 18
2 3
2121
23
TABLE A1.1: SUCCESS COUNTS FOR U.S. INTERVENTION: 2 March 1973 to 14 September 1977 OPENING BID QUOTES
German Marks Observations: Criterion SC1 sell marks buy marks total Criterion SC2 sell marks buy marks total Criterion SC3 sell marks buy marks total
TOTAL # 1184
INTERVENTION SUCCESSES percent #
VIRTUAL SUCCESSES percent #
EXPECTED SUCCESSES #
STANDARD DEVIATION #
161 176 337
45 67 112
28.0 38.1 33.2
541 560
45.7 47.3
74 83
4 5
161 176 337
34 45 79
21.1 25.6 23.4
151 163
12.8 13.8
21 24
2 2
161 176 337
79 112 191
49.1 63.6 56.7
692 723
58.4 61.1
94 107
6 7
0 2 2
0 2 2
na 100.0 100.0
524 478
44.3 40.4
0 1
0 1
0 2 2
0 0 0
na na na
139 181
11.7 15.3
0 0
0 0
0 2 2
0 2 2
na 100.0 100.0
663 659
56.0 55.7
0 1
0 1
Japanese Yen Observations: Criterion SC1 sell yen buy yen total Criterion SC2 sell yen buy yen total Criterion SC3 sell yen buy yen total
1184
24
TABLE A1.2: SUCCESS COUNTS FOR U.S. INTERVENTION: 15 September 1977 to 5 October 1979 OPENING BID QUOTES
German Marks Observations: Criterion SC1 sell marks buy marks total Criterion SC2 sell marks buy marks total Criterion SC3 sell marks buy marks total Japanese Yen Observations: Criterion SC1 sell yen buy yen total Criterion SC2 sell yen buy yen total Criterion SC3 sell yen buy yen total
TOTAL # 537
INTERVENTION SUCCESSES percent #
VIRTUAL SUCCESSES percent #
EXPECTED SUCCESSES #
STANDARD DEVIATION #
175 58 233
43 16 59
24.6 27.6 25.3
222 284
41.3 52.9
72 31
4 3
175 58 233
49 12 61
28.0 20.7 26.2
95 53
17.7 9.9
31 6
3 1
175 58 233
92 28 120
52.6 48.3 51.5
317 337
59.0 62.8
103 36
6 4
10 19 29
6 5 11
60.0 26.3 37.9
248 255
46.2 47.5
5 9
2 2
10 19 29
1 6 7
10.0 31.6 24.1
72 68
13.4 12.7
1 2
0 1
10 19 29
7 11 18
70.0 57.9 62.1
320 323
59.6 60.1
6 11
2 3
537
25 TABLE A1.3: SUCCESS COUNTS FOR U.S. INTERVENTION: 8 October 1979 to 17 April 1981 OPENING BID QUOTES
German Marks Observations: Criterion SC1 sell marks buy marks total Criterion SC2 sell marks buy marks total Criterion SC3 sell marks buy marks total Japanese Yen Observations: Criterion SC1 sell yen buy yen total Criterion SC2 sell yen buy yen total Criterion SC3 sell yen buy yen total
TOTAL # 400
INTERVENTION SUCCESSES percent #
VIRTUAL SUCCESSES percent #
EXPECTED SUCCESSES #
STANDARD DEVIATION #
55 114 169
15 41 56
27.3 36.0 33.1
201 177
50.3 44.3
28 50
3 4
55 114 169
17 25 42
30.9 21.9 24.9
50 60
12.5 15.0
7 17
1 2
55 114 169
32 66 98
58.2 57.9 58.0
251 237
62.8 59.3
35 68
4 5
1 10 11
1 4 5
100.0 40.0 45.5
204 177
51.0 44.3
1 4
1 1
1 10 11
0 1 1
0.0 10.0 9.1
44 49
11.0 12.3
0 1
0 0
1 10 11
1 5 6
100.0 50.0 54.5
248 226
62.0 56.5
1 6
0 2
400
26 TABLE A2: SUCCESS COUNTS FOR U.S. INTERVENTION: 20 April 1981 to March 19, 1997 OPENING BID QUOTES INTERVENTION VIRTUAL EXPECTED STANDARD TOTAL SUCCESSES SUCCESSES SUCCESSES DEVIATION percent percent # # # # # German Marks 4153 Observations: Criterion SC1 sell marks 78 33 42.3 1987 47.8 37 4 buy marks 154 68 44.2 1986 47.8 74 6 232 101 43.5 total Criterion SC2 sell marks 78 17 21.8 524 12.6 10 1 buy marks 154 28 18.2 531 12.8 20 2 232 45 19.4 total Criterion SC3 sell marks 78 50 64.1 2511 60.5 47 5 buy marks 154 96 62.3 2517 60.6 93 7 232 146 62.9 total Japanese Yen Observations: Criterion SC1 sell yen buy yen total Criterion SC2 sell yen buy yen total Criterion SC3 sell yen buy yen total
4153 83 118 201
40 52 92
48.2 44.1 45.8
2024 1926
48.7 46.4
40 55
4 5
83 118 201
18 21 39
21.7 17.8 19.4
485 531
11.7 12.8
10 15
1 2
83 118 201
58 73 131
69.9 61.9 65.2
2509 2457
60.4 59.2
50 70
6 6
27
TABLE A2.1: SUCCESS COUNTS FOR U.S. INTERVENTION: 20 April 1981 to 29 March 1985 OPENING BID QUOTES INTERVENTION VIRTUAL TOTAL SUCCESSES SUCCESSES percent percent # # # German Marks 1030 Observations: Criterion SC1 sell marks 1 0 0.0 517 50.2 buy marks 24 6 25.0 464 45.0 25 6 24.0 total Criterion SC2 sell marks 1 0 0.0 118 11.5 buy marks 24 7 29.2 146 14.2 25 7 28.0 total Criterion SC3 sell marks 1 0 0.0 635 61.7 buy marks 24 13 54.2 610 59.2 25 13 52.0 total Japanese Yen Observations: Criterion SC1 sell yen buy yen total Criterion SC2 sell yen buy yen total Criterion SC3 sell yen buy yen total
EXPECTED STANDARD SUCCESSES DEVIATION # #
1 11
0 2
0 3
0 1
1 14
0 3
1030 0 11 11
0 4 4
na 36.4 36.4
519 449
50.4 43.6
0 5
0 1
0 11 11
0 5 5
na 45.5 45.5
102 142
9.9 13.8
0 2
0 1
0 11 11
0 9 9
na 81.8 81.8
621 591
60.3 57.4
0 6
0 2
28 TABLE A2.2: SUCCESS COUNTS FOR U.S. INTERVENTION: 1 April 1985 to 29 April 1988 OPENING BID QUOTES
German Marks Observations: Criterion SC1 sell marks buy marks total Criterion SC2 sell marks buy marks total Criterion SC3 sell marks buy marks total Japanese Yen Observations: Criterion SC1 sell yen buy yen total Criterion SC2 sell yen buy yen total Criterion SC3 sell yen buy yen total
TOTAL # 805
INTERVENTION SUCCESSES percent #
VIRTUAL SUCCESSES percent #
EXPECTED STANDARD SUCCESSES DEVIATION # #
33 19 52
11 8 19
33.3 42.1 36.5
349 421
43.4 52.3
14 10
2 2
33 19 52
11 4 15
33.3 21.1 28.8
132 80
16.4 9.9
5 2
1 1
33 19 52
22 12 34
66.7 63.2 65.4
481 501
59.8 62.2
20 12
4 3
52 20 72
25 10 35
48.1 50.0 48.6
349 412
43.4 51.2
23 10
3 2
52 20 72
10 2 12
19.2 10.0 16.7
111 84
13.8 10.4
7 2
1 0
52 20 72
35 12 47
67.3 60.0 65.3
460 496
57.1 61.6
30 12
4 3
805
29
TABLE A2.3: SUCCESS COUNTS FOR U.S. INTERVENTION: 2 May 1988 to 19 March 1997 OPENING BID QUOTES INTERVENTION VIRTUAL TOTAL SUCCESSES SUCCESSES percent percent # # # German Marks 2318 Observations: Criterion SC1 sell marks 44 22 50.0 1121 48.4 buy marks 111 54 48.6 1100 47.5 155 76 49.0 total Criterion SC2 sell marks 44 6 13.6 274 11.8 buy marks 111 17 15.3 305 13.2 155 23 14.8 total Criterion SC3 sell marks 44 28 63.6 1395 60.2 buy marks 111 71 64.0 1405 60.6 155 99 63.9 total Japanese Yen Observations: Criterion SC1 sell yen buy yen total Criterion SC2 sell yen buy yen total Criterion SC3 sell yen buy yen total
EXPECTED STANDARD SUCCESSES DEVIATION # #
21 53
3 5
5 15
1 1
26 67
4 6
2317 31 87 118
15 38 53
48.4 43.7 44.9
1156 1064
49.9 45.9
15 40
3 4
31 87 118
8 14 22
25.8 16.1 18.6
272 305
11.7 13.2
4 11
1 1
31 87 118
23 52 75
74.2 59.8 63.6
1428 1369
61.6 59.1
19 51
4 5
8. References Alkeminders, G. J. 1995. Foreign-Exchange Intervention, Theory and Evidence, Hants, United Kingdom: Edward Elgar Publishing. Baillie, R., O. Humpage, and W. Osterberg. 2000. “Intervention from an Information Perspective.” Journal of International Financial Markets, Institutions and Money 10(3-4): 407421. Baillie, R., and W. Osterberg. 1997. “Why Do Central Banks Intervene?” Journal of International Money and Finance 16(6): 909-919. Beine, M., and O. Bernal. 2007. “Why Do Central Banks Intervene Secretly? Preliminary Evidence from the Bank of Japan.” Journal of International Financial Markets, Institutions, and Money 17(3): 291-306. Bhattacharya, U., and P. Weller. 1997. “The Advantage to Hiding One’s Hand: Speculation and Central Bank Intervention in the Foreign Exchange Market.” Journal of Monetary Economics 39(2): 251-277. Bonser-Neal, C., V. V. Roley, and G. H. Sellon, Jr. 1998. “Monetary Policy Actions, Intervention, and Exchange Rates: A Reexamination of the Empirical Relationships Using Federal Funds Rate Target Data.” Journal of Business 71(2): 147-177. Bordo, M. D., O. F. Humpage, and A. J. Schwartz. 2010a. “U.S. Foreign Exchange Market Intervention and the Early Dollar Float, 1973 – 1981.” NBER Working Paper No. w16647. Bordo, M. D., O. F. Humpage, and A. J. Schwartz. 2010b. “U.S. Foreign-ExchangeMarket Intervention during the Volcker-Greenspan Era.” NBER Working Paper No. w16345. Broaddus, J. A., and M. Goodfriend. 1996. “Foreign Exchange Operations and the Federal Reserve.” Federal Reserve Bank of Richmond Economic Quarterly 82 (1): 1-20. Chaboud, A. P., and O. F. Humpage. 2005. “An Assessment of the Impact of Japanese Foreign-Exchange Intervention: 1991 – 2004.” Board of Governors of the Federal Reserve System, International Finance Discussion Papers No. 824 . Chang, Y., and S. Taylor. 1998. “Intraday Effects of Foreign-Exchange Intervention by the Bank of Japan.” Journal of International Money and Finance 17 (1): 191-210. Cheung, Y., and M. D. Chinn. 2001. “Currency Traders and Exchange Rate Dynamics: A Survey of the U.S. Market.” Journal of International Money and Finance 20 (4): 439-471. Chiu, P. 2003. “Transparency Versus Constructive Ambiguity in Foreign Exchange Intervention.” BIS Working Papers No. 144. Dominguez, K. M., and J. A. Frankel. 1993a. “Does Foreign-Exchange Intervention Matter? The Portfolio Effect.” American Economic Review 83 (5): 1356-1369. Dominguez, K. M, and J. A. Frankel. 1993b. Does Foreign-Exchange Intervention Work? Washington, D.C: Institute for International Economics.
31 Dominguez, K. M. E. 2003. “The Market Microstructure of Central Bank Intervention.” Journal of International Economics 59: 25-45. Edison, H. 1993. The Effectiveness of Central Bank Intervention: A Survey of the Literature after 1982. Princeton University, Special Papers in International Economics No. 18. Evans, M. D., and R. K. Lyons. 2001. “Portfolio Balance, Price Impact and Secret Intervention.” NBER Working Paper No. 8356. Evans, M. D., and R. K. Lyons. 2005. “Are Different-Currency Assets Imperfect Substitutes,” in Paul DeGrauwe (ed.) Exchange Rate Economics: Where Do We Stand?” Cambridge: MIT Press. Fatum, R., and M. Hutchison. 2002. “ECB Foreign-Exchange Intervention and the EURO: Institutional Framework, News and Intervention.” Open Economies Review, 13: 413425. Galati, G., W. Melick, and M. Micu. 2005. “Foreign Exchange Market Intervention and Expectations: The Dollar/Yen Exchange Rate.” Journal of International Money and Finance. 24(6): 982-1011. Goodfriend, M. 2010. “Policy Debates at the FOMC: 1993 – 2002,” Federal Reserve Bank of Atlanta Conference, A Return to Jekyll Island: The Origins, History, and Future of the Federal Reserve System, November 5-6. Goodhart, C. A. E., and T. Hesse. 1993.” Central Bank Forex Intervention Assessed in Continuous Time.” Journal of International Money and Finance 12 (4): 368-89. Greene, M. L. 1984b. “U.S. Experience with Exchange Market Intervention: October 1980 – September 1981. Board of Governors of the Federal Reserve System, Staff Studies #129. Henriksson, R. D., and R. C. Merton. 1981. “On Market Timing and Investment Performance. II. Statistical Procedures for Evaluating Forecasting Skills.” Journal of Business 54: 513-533. Humpage, O. F. 1999. “U.S. Intervention: Assessing the Probability of Success.” Journal of Money Credit and Banking 31 (4):731-747. Humpage, O. F. 2000. “The United States as an Informed Foreign-Exchange Speculator.” Journal of International Financial Markets, Institutions, and Money 10: 287-302. Humpage, O.F., and W. P. Osterberg. 1992. “Intervention and the Foreign Exchange Risk Premium: An Empirical Investigation of Daily Effects.” Global Finance Journal 3: 23-50. Humpage, O., and J. Ragnartz. 2005. “Swedish Intervention and the Krona Float, 1993 – 2002.” Federal Reserve Bank of Cleveland Working Paper 05-14. Hung, J. H. 1997. “Intervention Strategies and Exchange Rate Volatility: A Noise Trading Perspective.” Journal of International Money and Finance 16 (5): 779-793. Ito, T. 2003. “Is Foreign Exchange Intervention Effective?: The Japanese Experiences in the 1990s.” in Paul Mizen (ed.) Monetary History, Exchange Rates, and Financial Markets, Essays in Honour of Charles Goodhart, (2) Cheltenhan, U.K.: Edward Elgar.
32 Ito, T. 2005. “Interventions and Japanese Economic Recovery.” International Economics and Economic Policy 2(2-3): 219-239. Ito, T. 2007. “Myths and Reality of Foreign Exchange Interventions: An Application to Japan.” International Journal of Finance and Economics 12 (2): 133-154. LeBaron, B. 1999. “Technical Trading Rule Profitability and Foreign Exchange Intervention.” Journal of International Economics 49: 125-143. LeCourt, C., and H. Raymond. 2006. “Central Bank Interventions in Industrialized Countries: A Characterization Based on Survey Results.” International Journal of Finance and Economics 11(2): 123-138. Lyons, R. K. 2001. The Microstructure Approach to Exchange Rates. Cambridge, Mass.: MIT Press. McCallum, B. T. 2003. “Japanese Monetary Policy, 1991-2001.” Federal Reserve Bank of Richmond Economic Quarterly 89 (1): 1-31. Merton, R. C. 1981. “On Market Timing and Investment Performance. I. An Equilibrium Theory of Value For Market Forecasts.” Journal of Business 54: 363-406. Mussa, M. 1981. “The Role of Official Intervention.” Occasional Paper No. 6, New York: Group of Thirty. Neely, C. J. 2001. “The Practice of Central Bank Intervention: Looking Under the Hood.” Central Banking 11 (2): 24-37. Neely, C. J. 2005. “An Analysis of Recent Studies of the Effectiveness of Foreign Exchange Intervention.” Federal Reserve Bank of St. Louis Review 87 (6): 685-717. Neely, C. J. 2007. “Central Bank Authorities Beliefs about Foreign Exchange Intervention.” Journal of International Money and Finance 27 (1): 1-25. Neely, C. J. 2011.”A Foreign Exchange Intervention in an Era of Restraint.” Federal Reserve Bank of St. Louis, Review (September/October): 303-324. Neely, C. J., and Weller, P. 1997. “Technical Analysis and Central Bank Intervention.” Journal of International Money and Finance 20 (7): 949-970. Popper H., and J. Montgomery. 2001. “Information Sharing and Central Bank Intervention in the Foreign-Exchange Market.” Journal of International Economics 55: 295-316. Reitz, S., and M. P. Taylor. 2008. “The Coordination Channel of Foreign Exchange Intervention: A nonlinear Microstructural Analysis.” European Economic Review 52: 55-76. Sarno, L. and M. P. Taylor. 2001. “The Official Intervention in the Foreign-Exchange Market: Is It Effective and, If So, How Does It Work?” Journal of Economic Literature 39: 839868. Vitale, P. 1999. “Sterilized Central Bank Intervention in the Foreign Exchange Market.” Journal of International Economics, 49: 689-712.
33 Endnotes
1
If a country is in a liquidity trap and long-term domestic government securities—the traditional vehicles of quantitative easing —are perfect substitutes for base or in short supply, then conducting open-market operations through foreign exchange (and other types of assets) may be advisable (see McCallum 2003). 2
Edison (1993), Alkeminders (1995), Baillie, Humpage and Osterberg (2000), and Sarno and Taylor (2001) provide excellent surveys of intervention. Nealy (2005) also touches on some econometric issues. 3
The portfolio balance mechanism also assumes that no restrictions exist on cross-border financial flows and that Ricardian equivalence does not hold. 4
Most models assume that relative changes in the stock of securities leave interest rates unaffected because monetary policy determines interest rates. This need not be the case. 5
The United States conducts most U.S. interventions, by far, in the New York market, but has on occasion placed orders through correspondents in both the European and Far Eastern markets. We cannot isolate these transactions. 6
The United States did not abruptly end its intervention on 19 March 1997. U.S. interventions began to taper off in the early 1990s. After August 1995, the United States intervened against Japanese yen on 17 June 1998, against euros on 22 September 2000, and again against Japanese yen on 18 March 2011. These last three interventions are the only instances of U.S. intervention during the floating exchange rate era not included in our analysis. Our exchange-rate data determined our sample, which ends on 19 March 1997. 7
The United States intervened against some other European currencies during the 1970s and early 1980s, but data on these currencies are not available. 8
An appendix in the working paper version of this paper contains the detailed data that we used to construct table 2. 9
1981.
Bordo, Humpage and Schwartz (2010a) provide a detailed discussion of intervention during prior to