Performance Evaluation of Rapid-Setting Repair Materials for Concrete Pavements/Bridge Decks: A Laboratory and a Field Perspective Prashant V. Ram & Jan Olek Purdue University, West Lafayette, Indiana, USA
ABSTRACT: Maintenance and repair of concrete structures has been the focus of the construction industry activities for nearly half a century. The ability to rapidly repair and rehabilitate deteriorated bridge decks and highway pavements minimizes interference with traffic in heavily traveled areas and reduces travel delays. In many cases, the needed repairs have been accomplished using rapid-setting materials. Extensive review of literature has indicated that repair materials which meet the required performance criteria in the laboratory do not necessarily perform well in the field. This paper presents results and analyses of the laboratory investigations of rapid-setting repair materials as well as issues related to their field installation. It was seen that while, in most cases, the controlled laboratory conditions yielded consistent mixes and acceptable performance, the properties of mixes produced on site were more variable. This variability was the result of changes in the amount of aggregate extension used, moisture content of the aggregates, amount water added and ambient temperature conditions. Suggestions regarding the possible improvements in quality control procedures of field mixes to ensure adequate performance of the repair-patches are also presented. 1 INTRODUCTION 1.1 Background Concrete repair is a complex process, presenting unique challenges that are different from those associated with new concrete construction. The repair system must successfully integrate new materials with the existing concrete to form a durable composite system which is capable of enduring exposure to service loads, environment and time (Vaysburd 2006, Vaysburd et al. 2004, and McDonald et al. 2001). Rapidsetting materials have been in great demand for repair applications as they considerably reduce the construction downtime.
due to structural failures, most of the problems are durability related. 1.2 Research Objectives The primary objectives of the present study were to identify the critical properties based on the laboratory tests that could be correlated to the field-performance of the repair materials. The laboratory test results, together with the field performance data could be used in the future to develop performance-based specifications for the selection and use of rapid setting materials for the Indiana Department of Transportation (INDOT). 2 LABORATORY TESTING
Repairs performed under high traffic volumes and aggressive environmental conditions require materials that will cure rapidly while providing adequate strength and durability. The main factors which cause premature failure of repairs include exposure to freezing and thawing cycles, aggressive chemical exposure, mechanical abrasion, loss of bond between existing concrete and repair material, and dimensional stability of the repair material. While some of the problems associated with premature deterioration of repairs are
2.1 Materials Six commercial rapid-setting repair materials (CRSMs) were chosen for this study based upon the extensive laboratory investigation carried out earlier at Purdue University and on the review of other literature in the topic (Barde et al. 2006, Deshpande and Olek 2006). The first four repair materials (RM1-RM4) were pre-packaged mortars. Repair Material 5 was supplied in two formulations – regular (RM5-R) and
air-entrained (RM5-AE). Each of these formulations was supplied in the form of powder, without any premixed aggregate. RM1 through RM3 were Portland cement based materials and RM4 was an aluminacement based repair material. RM5-R and RM5-AE were gypsum cement based binders. Table 1 provides information on and mixture composition of all repair materials. Table 1. Mixture-Proportions of the Repair Materials (RM) ____________________________________________________ Repair Aggregate Extension Mix Water Material __ (dry, % wt. of RM) (l, per bag of material) _________________ ________________________ Pea Gravel Sand Actual* Recommended %Extra ____________________________________________________ RM1 60 NA 3.22 3.22 0 RM2 60 NA 2.70 2.60 3.8 RM3 60 NA 3.00 3.00 0 RM4 60 NA 3.07 2.60 18.1 RM5-R 100 100 6.62 5.68 16.5 RM5-R 100 100 6.62 5.68 16.5 ____________________________________________________ * Extra water was added for improved workability ** The repair materials were available as 22.7 kg bags
The fine aggregate used was natural sand with absorption of 1.85% and a specific gravity of 2.63 while the coarse aggregate used was locally available pea gravel with max diameter of 9.5 mm with absorption of 2.36% and a specific gravity of 2.64. 2.2 Mixing Sequence A small capacity (28 L) portable mortar mixer was used to carry out the mixing operations in the laboratory. The following mixing sequence was adopted: Pea Gravel (+ Sand for RM5 R/AE) � Mix for 20 seconds � RM + ¾ Water � Mix for 120-150 seconds. The remaining water was added during mixing. 2.3 Test Procedures All laboratory concretes were prepared, cured and tested at constant temperature of 23±2°C. The fresh and hardened properties evaluated are listed in Table 2, which also provides information on the performance requirements adopted for this project. The temperature signature data (for laboratory mixes only) were collected using thermocouples placed in 76x152 mm cylinders. The compressive strength was tested using 76x152 mm cylinders at the ages of 2, 4, 24 hours and 28 days. The specimens tested at the age of 2 hours were demolded right before testing. The other specimens were de-molded 2 hours after addition of water and were moist-cured at 23ºC and 100% relative humidity (RH) until tested. The compressive strength specimens cast
in the field were de-molded and tested after 12 hours (this was the only strength data collected). Table 2. Testing Procedures and Performance Requirements ____________________________________________________ Property Test Method/ Project Requirements ____________________________________________________ Setting Time Initial Setting Time Final Setting Time Temperature Signature Slump/Flow*** Slump Flow Compressive Strength* 2Hr 4 Hr 24 Hr 28 Days Slant Shear Bond Strength* 1 Day 7 Day Iowa Shear Bond Strength*** Drying Shrinkage** 28 Days Restrained Shrinkage
ASTM C266 10-20 min 20-40 min ASTM C1431 200-250 mm 400-700 mm ASTM C39 14 MPa 21 MPa 28 MPa 35 MPa ASTM C8822 7 MPa 10 MPa IOWA 406-C-2000 ASTM C1572,3 800 µɛ AASHTO PP34 No Cracking upto 28 days Freeze-Thaw Resistance* ASTM C6664 300 cycles 60% Scaling Resistance ASTM C672 25 Cycles Rating – 0 Rapid Chloride Permeability AASHTO T277 28-Day <3000 Coulombs ___________________________________________________ 1
Slump or flow was measured, depending on material consistency Modified by ASTM C 928 3 Initial measurement performed after 1.75 hours of addition of water 4 Procedure A was adopted; specimens de-molded after 2 hours *Minimum requirements ** Maximum requirements *** Non-standard 2
The bond strength was evaluated at the age of 1 and 7-days. The effect of the environmental exposure on the bond-strength was also evaluated. The bond strength was tested after the specimens were moist cured for 7 days and then exposed to the natural environment for 60 days (Dec 6 2007 – Feb 5 2008). In addition to the ASTM C 882 method, the bond strength was also evaluated using a non-standard Iowa shear test (Iowa DOT Test Method 406-C-2000) which is typically used to test the shear bond strength between asphalt and Portland cement concrete. The freeze-thaw specimens cast in the field were de-molded 12 hours after addition of water and were exposed to the natural environment (stored at the repair site) for 12-days. The specimens were immersed in lime water 48 hours before the test. The rapid chloride permeability specimens were moist cured at 23°C and 100% RH for 28 days after which the test was performed.
3 FIELD INSTALLATION 3.1 Introduction In order to verify the performance of the repair materials in the field, they were used to repair deteriorated sections on the bridge deck over Wash River. The bridge deck is located on Interstate 65 near the town of Lafayette, Indiana, USA. The installation took place in October 2007. Due to traffic control and scheduling problems, the field installation of RM5 R could not be carried out. A representative from the material manufacturer was present on site to ensure proper mixing and placing of the materials.
The surface of the newly placed patches was finished with concrete trowels and textured a broom. Except for RM4, no specific curing regime was recommended by the representatives of the material manufacturers present on site. As a result, those patches were not cured after placement. For RM4, the placed material was covered with a plastic sheet. Figure 2 shows a sample patch after finishing.
3.2 Installation Procedure 3.2.1 Preparation of Repair Areas In preparation for the repairs, the surface of the bridge deck was sounded with a hammer to identify the boundaries of deteriorated areas. The removal of concrete from these areas was accomplished using concrete saws and pneumatic jack hammers. If rebars were present, the concrete was removed to the depth of 25mm below the rebars. The repair area was then cleared using a blast of high pressure air. The cleared surface was then wetted to avoid removal of mixture water from the repair material. An example of repair area prepared for patching is shown in Figure 1.
Fig 2. Finished patch
3.3 General Comments •
•
•
• Fig 1. Repair Area Prepared for Patching
• 3.2.2 Repair Material Installation After the preparation of the patch area has been completed, the repair material was mixed on-site, typically in a drum mixer and placed in one or more batches, depending on the size of the patch. Consolidation was carried out by tamping the repair concrete using the shovels.
Due to time constraints (the bridge-deck had to be open to traffic in 8 hours), none of the materials used to prepare repair mixtures were actually weighed. Instead, a volume-based approximation to the mass was used to proportion the mixtures. The water was added using 3.78L (1 Gallon) containers. Depending on the results of visual observation of the consistency of the mix inside the mixer, extra water was added upon the recommendation of the material manufacturer representative. The amount of mix water varied from batch to batch. The consistency of mixes sometimes varied significantly from batch to batch due to the variations in the amount of aggregate extension and mix water used. The moisture content of the aggregates used was not taken into account when batching the materials. The ambient temperature at the time of placement was around 13°C and as a result, the setting time of the materials was extended compared to the laboratory mixtures.
4 RESULTS AND ANALYSIS This section presents a comparison of the mechanical and durability properties of the CRSMs.
4.1 Setting Time, Workability and Heat Signature Table 3 shows a comparison of the initial and final setting times for all the materials. The initial setting time for all the materials was between 10 and 20 minutes, except RM4 which had an initial setting time of 34 minutes. RM4 and RM5-AE are the only materials with the final setting site of over 45 minutes, the rest of the materials had a final setting time of at most 35 minutes. Table 3. Setting Time and Workability _____________________________________________ Material Intial Set Final Set Slump(S, mm)/ Time (min) Time (Min) Flow(F, mm) _____________________________________________ RM1 15 22 550 (F) RM2 15 27 230 (S) RM3 13 31 230 (S) RM4 34 47 410 (F) RM5-R 16 35 760 (F) RM5-AE 18 48 720 (F) _____________________________________________
RM2
RM3
RM4
RM5-R
RM5-AE
Requirement
RM2 RM3 RM4
50 RM1
40 RM5-R RM5-AE
Compressive Strength (MPa)
60
70
Temperature (°C)
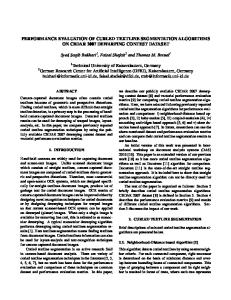
The rate of compressive strength gain for laboratory mixes used in this study is shown in Figure 4.
70
The temperature signature curves for the RMs are shown in Figure 3.
30
4.2 Compressive Strength
RM1
Depending upon the “wetness” of the mixtures, their workability was measured either in terms of slump or slump flow. Table 3 shows that RM1, RM4, RM5-R and RM5-AE displayed good flow characteristics and may be considered self-leveling products. However, RM2 and RM3 experienced rapid slump loss. These materials should be placed within 4-8 min. after mixing to avoid consolidation problems.
60
plained by the fact that RM5-AE has admixed airentraining agent which may retard the rate of hydration. High dosages of air entraining agent may reduce rate of cement hydration (Ramachandran et al. 2003) After 6 hours, all materials returned to the level of ambient laboratory temperature.
50
40
30
20
10
0 1
10
100
1000
Specimen Age (Hours)
Figure 4. Rate of Compressive Strength Gain (Laboratory Mixes)
At the ages of 2, 4 and 24 hours, RM5-R and RM5AE were the only two materials with strengths well below the project specified requirements. At the age of 28 days, only RM5-AE had strength less than the required value of 35 MPa. The other repair materials have excellent rates of strength gain under laboratory conditions of 23±2°C. The lower rate of strength gains (at least at early ages) observed for RM5-R and RM5AE materials can be attributed to longer set times. This fact is also corroborated by the temperature signature curves (Figure 3) which show a significantly delayed response.
20
10 0
1
2
3
4
5
6
Time (Hours)
Figure 3. Temperature Signature Curves (Laboratory Mixes)
There is a steep surge in the temperature for RM1, RM2 and RM3, which occurs within 20 minutes after addition of mix water. RM4 shows a slightly delayed response. The rate of temperature evolution in RM5R/AE was considerably slower than that in other materials. When compared to RM5-R, the curve for RM5AE is slightly shifted to the right which may be ex-
Table 4 shows a comparison between the 12-hour compressive strength of the field specimens and the predicted 12-hour compressive strength of the laboratory mixes. Table 4. 12 Hr. Compressive Strength: Lab vs. Field ___________________________________________ Material Lab (MPa) Field (MPa) % Difference ___________________________________________ RM1 27.4 15.1 + 81.6 RM2 36.1 10.5 +244.1 RM3 37.5 36.1 +3.9 RM4 42.9 41.2 +4.1 RM5-R 20.1 No Data RM5-AE 15.4 10.6 +44.7 ___________________________________________
4.3 Bond Strength The slant-shear bond strength results are presented in Figure 5. 1-Day MC
7-Day MC
7 Day MC & 60 Day Environmental Exposure
Hence, one would expect significantly lower bondstrengths in the case of the Iowa-shear test. 1-Day MC
7-Day MC
7-Day MC & 60 Day Environmental Exposure
4.5 4 3.5 Bond Strength (MPa)
The 12 Hr. compressive strengths of RM1, RM2 and RM5-AE have the 12-Hr. compressive strengths which were, respectively, around 80%, 240% and 45% higher than those of the field mixes. For RM3 and RM4, the strengths from the laboratory and the field mixes are very comparable. This indicates that some of the RMs are more sensitive to temperature variations during early hydration than the others.
3 2.5 2 1.5
24
1
ASTM C 928 7 Day Requirement 20
0.5
ASTM C 928 1 Day Requirement
RM1
RM2
RM3
RM4
RM5-R
RM5-AE
Figure 6. Iowa Shear Bond Strength (Laboratory Mixes) 12
8
4
0 RM1
RM2
RM3
RM4
RM5-R
RM5-AE
Figure 5. Slant-Shear Bond Strength (Laboratory Mixes)
All materials tested achieved the project-required bond-strength. The increase in bond strength from 1day to 7-day is negligible for RM1 and RM2. In order to study the effect of the natural freeze-thaw exposure, another set of specimens were moist-cured (MC) for 7 days and then exposed to the natural environment from Dec 6, 2007 – Feb 5, 2008. The temperature history for the environmental exposure is shown in Figure 7. Although the temperature during the exposure period varied from -20C to over +20C, these variations did not seem to have any negative effect on the slant-shear bond strength values. In fact, there was an increase in bond strength for all the repair materials. The Iowa-shear bond strength results are presented in Figure 6. The same curing/exposure regime was adopted as in the case of the slant-shear test. It must be noted that, in the slant-shear test, the repair concrete is installed on substrate mortar, where there is no coarse aggregate exposure along the bonding plane. However in the Iowa shear test, significant number of coarse aggregate grains are present along the bonding plane (smooth saw-cut surface). Also, in the slant-shear test, the stress configuration at the interface is a state of combined shear and compression, whereas, in the Iowa-shear test, the interface is in a state of pure shear.
For RM1 though RM4, the increase in the Iowa shear bond strength from 1-Day to 7-day is not very significant. However, for RM5-R and RM5-AE there is an evident increase in the 1-Day and 7-Day bond strengths (around 75%). Another interesting observation was that, the 60-Day environmental exposure resulted in a very conspicuous decrease in the Iowashear bond strength for RM5-R and RM5-AE. However, the same was not observed in the case of the slant-shear test. This could probably be because of poor aggregate-material compatibility under severe freeze-thaw exposure. However, extensive field investigations must be carried out to verify these results. Maximum Temperature
Minimum Temperature
25
20
15
10
Temperature (°C)
Bond Strength (MPa)
0 16
5
0
-5
-10
-15
-20
-25 24-Nov-07
4-Dec-07
14-Dec-07
24-Dec-07
3-Jan-08
13-Jan-08
23-Jan-08
2-Feb-08
12-Feb-08
Figure 7. Ambient Temperature History for the for the bond durability specimens (Meteorological Data, Source: http://www.wunderground.com)
4.4 Shrinkage The free-shrinkage of the repair materials is presented in Figure 8. RM1
RM2
RM3
RM4
RM5-R
RM5-AE
0 0
5
10
15
20
25
30
Shrinkage (Microstrains)
-100 -200 -300
Table 5. Freeze-Thaw Resistance __________________________________________________ Repair RDM RDM RDM Material (100 Cycles, %) (200 Cycles, %) (300 Cycles, %) _____________ ____________ _____________ Lab Field Lab Field Lab Field __________________________________________________ RM1 93 98 91 99 90 99 RM2 99 90 99 * 98 * RM3 95 98 91 96 80 92 RM4 * 97 * 98 * 99 RM5-R * NDA * NDA * NDA RM5-AE 75 93 60** 85 * 74 __________________________________________________ * Specimens Failed NDA: No-Data Available ** Experiment Stopped as specimens reached a RDM of 60%
-400 -500 -600 -700 -800 Specimen Age (Days)
Figure 8. Free Shrinkage
From Figure 8, it is observed that the majority of the shrinkage occurred within the first two days. After the initial reading, subsequent measurements were performed at the ages of 1, 2, 4, 7, 14 and 28 days. RM2 and RM3 displayed the maximum shrinkage after 28 days, with the values being around 600 and 700 microstrains respectively. RM1 had the minimum shrinkage of around 300 micro-strains after 28 days. It must be noted that the initial measurement of the shrinkage beams was performed 1 hr. 45 mins. after the addition of mix-water. Hence, the dimensional changes of the material from time zero till 1 hr. 45 mins. has not been captured. Since these materials undergo a significant increase in temperature at very early ages, they will undergo considerable expansion which in-turn may result in lower values of net shrinkage. Alternate test methods for dimensional changes at very early ages like the corrugated tube method (Sant et al. 2006) must be considered when evaluating these materials.
The laboratory mixes of RM1, RM2 and RM3 showed excellent freeze-thaw resistance (RDM>80% after 300 F-T cycles). The laboratory specimens of RM4 and RM5-R mixes failed after 30 cycles of freezing and thawing. The laboratory specimens of RM5AE reached a RDM of 60% after 220 cycles of freezing and thawing. The specimens also underwent severe scaling. This could be attributed to the excess water added (~17%) above the manufacturer’s recommendation. Also, the laboratory specimens were consolidated by vibration, which might have altered the air-void system resulting in poor F-T resistance for RM4 and RM5-R and reduced F-T resistance for RM5-AE. RM2 specimens cast in the field failed after 100 cycles of freezing and thawing. RM1, RM3 and RM4 specimens cast in the field displayed excellent freeze-thaw resistance. RM5-AE specimens cast in the field had a RDM of 74% after 300 cycles. 4.6 Resistance to Chloride-Ion Penetration Figure 9 provides information on the relative resistance of tested mixtures to chloride-ion penetration. 9000
8000
Total Charge Passed (Coloumb)
7000
To study the cracking tendency of the repair materials, the restrained shrinkage test was performed. The strains were monitored for a period of 35 days in a controlled environment of 23°C and 50% RH. None of the repair materials cracked. According to ASTM C 1531, if no cracking is observed after 28 days, then the cracking susceptibility of the mix is deemed to be low.
6000
5000
4000
3000
2000
4.5 Freeze-Thaw Resistance Table 5 provides results on the change in relative dynamic modulus (RDM) of the specimens subjected to accelerated freeze-thaw (F-T) conditions in the laboratory.
1000
0 RM1
RM2
RM3
RM4
RM5-R
RM5-AE
Figure 9. Resistance to Chloride-Ion Penetration (Lab Mixes)
The material RM3 had the lowest value of the total charge passed after 6 hours (336 coulombs) which cor-
responds to very low chloride-ion permeability according to AASHTO T 277. RM2 has a low chloride-ion permeability and RM1, RM4 and RM5-R had moderate chloride-ion permeability. RM5-AE had the highest value (8159 coulombs) for the total charge passed after 6 hours indicating that it could potentially be unsafe to be used in direct contact with rebars under condition of salt exposure. 5 CONCLUDING REMARKS
Department of Transportation and Purdue University. The contents of this paper reflect the views of the authors, who are responsible for the facts and the accuracy of the data presented herein, and do not necessarily reflect the official views or policies of the Federal Highway Administration and the Indiana Department of Transportation, nor do the contents constitute a standard, specification, or regulation. The authors would like to thank all the material manufacturers for supplying their materials for testing and also assisting with the field installations.
Laboratory Study REFERENCES •
•
• • •
• •
The repair materials studied in this project had varying chemical compositions which influenced performance in terms of mechanical and durability parameters. RM1, RM4, RM5-R and RM5-AE materials displayed good flow characteristics and can be considered as having self-leveling characteristics. RM2 and RM3 experienced rapid slump loss. All the materials (except RM5-AE) showed acceptable rate of strength gain at early ages. In general, all the materials displayed good bond to substrate concrete. Relatively poor freeze-thaw durability was observed for RM4, RM5-R and RM5-AE possibly the result of additional water that needed to be added to maintian adequate workability of extended mixtures. RM5-AE displayed poor resistance to chloride-ion penetration The cracking potential of all materials was low. Field Installations
•
• •
Ambient temperature conditions playeed a vital role in controlling rate of strength gain. In hot weather conditions, cold water should be used to prevent flash-set of materials studied. In cold weather conditions, warm water should be used to accelerate hydration. The uniformity of the field installations can be improved by accounting for moisture content of the aggregate during the batching process. Calibrated buckets should be use to control the amount of water and aggregates added into each mix.
ACKNOWLEDGEMENTS This work was supported by the Joint Transportation Research Program administered by the Indiana
AASHTO PP 34 2005. Standard Practice for Estimating the Cracking Tendency of Concrete. AASHTO T 277 2005. Standard Practice for Electrical Indication of Concrete’s Ability to Resist Chloride Ion Penetration. ASTM C 928 2006, Standard Specification for Packaged, Dry, Rapid-Hardening Cementitious Materials for Concrete Repairs, ASTM International. Barde, A., Parameswaran, S., Chariton, T., Weiss, J., Cohen, M., and Newbolds, S. 2006. Evaluation of Rapid Setting CementBased Materials for Patching and Repair (Phase-I), Joint Transportation Research Program Project SPR-2648. Deshpande, Y., Nantung, T. and Olek, J. 2006 Dowel Bar Retrofit Mix Design and Specification, Joint Transportation Research Program Project SPR-2789. Iowa Department of Transportation, Test Method No. Iowa 406C 2000. Method of Test for determining the shearing strength of bonded concrete. McDonald, J.E., Vaysburd., A.M., Emmons, P.H., Poston, R.W., and Kesner, K., 2001. Selecting durable repair materials: Performance Criteria – Summary, Concrete International, Jan 2001: 37-44. Ramachandran, V.S., Paroli, R.M., Beaudoin, J.J., and Delgado, A.H. 2003. Handbook of Thermal Analysis of Construction Materials. Noyes Publication/William Andrew Publishing, Norwich, New York USA. Sant, G., Lura, P., and Weiss, W.J., 2007. Measurement of Volume Change in Cementitious Materials at Early Ages: Review of Testing Protocols and Interpretation of Results: Journal of the Transportation Research Board, No. 1979. Vaysburd, A.M., Emmons, P.H., Mailvaganam, N.P., McDonald, J.E. and Bissonnette, B., 2004. Concrete Repair Technology – A revised Approach is Needed, Concrete International, Jan 2004: 59 – 64. Vaysburd, A.M. 2006. Holistic system approach to design and implementation of concrete repair, Cement and Concrete Composites Vol. 28 (2006): 671-678.