Electronic Notes in Theoretical Computer Science Electronic Notes in Theoretical Computer Science 00 (2011) 1–15
Performance Evaluation of Software Development Teams: a Practical Case Study Paulo Fernandes 1,2,∗, Afonso Sales 3 , Alan R. Santos , Thais Webber 1 Pontif´ıcia Universidade Cat´olica do Rio Grande do Sul Avenida Ipiranga, 6681 – Pr´edio 32 90619-900 – Porto Alegre – RS – Brazil Tel.: +55-51-3320-3611 Fax: +55-51-3320-3621
Abstract Software development projects have become a challenge for both industry and academia regarding the performance evaluation of teams. Recently, a Stochastic Automata Networks (SAN) model was proposed as theoretical representation for performance prediction of software development teams. In this paper, we present an exercise of such SAN analytical modeling for a practical case study from an Information Technology company that has multiple sites and different participants’ roles and expertises. We present the matching of our model predictions with the actual project observations. Then, we focus our attention on the central entity varying its availability and the level of provided support in order to observe the impact on the participants’ performance. We summarize our study with further discussions of numerical results and possible model extensions. Keywords: Performance Evaluation, Analytical Modeling, Stochastic Automata Networks, Global Software Development, Team Building Process
1. Introduction In order to improve business results, there is a demand to re-structure the Information Technology (IT) sector extending companies operations to offshore software development centers. Globalization and the increasing need of companies to expand their markets spreading operations in several countries demands an organizational improvement including the Information Technology area and software development projects. Furthermore, there are research challenges in the software development field such as heterogeneous team configurations distributed in separate sites, or even different time zones, inter-cultural factors, different experience levels and technical background [1, 2, 3, 4]. One of the main challenges in multi-site software development projects is the communication area, because it is hard to ensure the same understanding about projects goals among people from different cultures and knowledge ∗ Corresponding
author. The order of authors is merely alphabetical. Email addresses:
[email protected] (Paulo Fernandes ),
[email protected] (Afonso Sales ),
[email protected] (Alan R. Santos ),
[email protected] (Thais Webber ) 1 Authors receive financial support provided by PUCRS-Petrobras (Conv. 0050.0048664.09.9). 2 Paulo Fernandes is also funded by CNPq-Brazil (PQ 307284/2010-7). 3 Afonso Sales receives grants from CAPES-Brazil (PNPD 02388/09-0).
P. Fernandes, A. Sales, A. R. Santos, T. Webber / Electronic Notes in Theoretical Computer Science 00 (2011) 1–15
2
level [5]. Large companies have been using a set of processes to facilitate the work of different teams. However, teams’ performance analysis becomes challenging for both industry and academia [6, 7, 8, 9, 10]. Theoretical models can be a useful tool to analyze, for instance, the evolution and intercommunication of software development processes in order to help project managers to better understand issues related to the development context [11, 12, 13]. Related works concerning stochastic models and simulations are developed towards to the specification of the dynamics of software projects [6, 14], and the usage of analytical models to analyze teams performance variability [15, 16]. Stochastic Automata Networks (SAN) [17, 18] is a powerful modeling formalism based on Markov chains [19] that provides a high-level description (abstraction) of a model. SAN is a suitable formalism for modeling software development projects due to the fact that development teams can be easily abstracted in a modular way. This formalism describes each module as a stochastic automaton depicted by a state-transition diagram, where the transitions are labeled with probabilistic and timing information. The behavior of a SAN model is given by the occurrence of events, which allows the changes of the states of one or more automata. In a SAN model, an estimated duration is associated to each event determining how often each event can occur. Giving this timing information, the numerical solution of the model provides steady-state probabilities from which measures of interest can be extracted, e.g., performance indices. Among a myriad of tools to provide these indices [20, 21, 19], we use a numerical solver called GTAexpress [22] to obtain the performance indices from the analytical models. In this paper, we report our findings on the use of SAN for analytical modeling of software development teams in order to predict their performance in different scenarios. We present our results based on a case instance of a multi-site project analyzing the effect of availability and levels of support provided by a centralized management entity. In order to verify our prediction accuracy, we validate the numerical results obtained from the proposed model comparing with the actual hours spent in the project’s phases. Following, we turn our attention to a deeper analysis of possible scenario variations in the project considering different behaviors and skills of participants. Specifically, the availability and quality of the central entity support is analyzed in different scenarios, and the impact on the whole team productivity is predicted. The remainder of this paper is organized as follows. Section 2 presents a study of analytical modeling of global software development teams and the representation of the central entity and team members. Section 3 introduces the practical case study to illustrate the scope and nature of the problem, and also presents the proposed analytical model. Section 4 presents the comparative numerical analysis of the proposed model with the actual project quantitative data. Moreover, in Section 4.3, we vary the availability and levels of support provided by the central entity to analyze the impact of these characteristics on the total project execution time. Finally, the conclusion draws an overview on future work and major contributions of the paper. 2. Analytical modeling of teams Software development teams evaluation is a challenging process, since team building is a multi-variable problem in order to achieve better team’s performance. Despite the clear usefulness of analytical modeling to predict team’s behavior during project’s planning phase, other software development phases such as execution, monitoring and controlling, and closing [23], can also benefit from these theoretical predictions. Traditionally, literature presents different approaches related to the usage of numerical analysis in the software engineering context, e.g., the automated software testing process [24, 25, 26] and quantitative evaluation of development teams [15, 16, 27, 28]. Analytical modeling formalisms are commonly applied to describe many realities in a state-based approach. Markov chains [19] and Markov-based formalisms are employed in several areas such as economics, physics, engineering and bioinformatics, to cite a few. More information about other formalisms, specialized tools, and applications is available in the literature [29, 30, 20, 31, 32, 18, 33, 34, 35, 36]. A modular and compact Markovian formalism is Stochastic Automata Networks (SAN) [17, 18]. SAN is used to model systems by small components (automata) with occasional and defined interactions among them in a structured manner. The solution of a SAN model, i.e., the extraction of numerical results, is usually performed by specific algorithms [22] designed to deal with rather large state spaces. For this reason, SAN facilitates the modeling of distributed development teams (in a software engineering context) by the individual description of each entity behavior, where only some activities represent synchronizations among some entities. In this context, an entity can be modeled as a participant or a whole team.
P. Fernandes, A. Sales, A. R. Santos, T. Webber / Electronic Notes in Theoretical Computer Science 00 (2011) 1–15
3
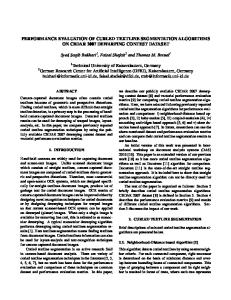
Distributed software development teams are usually dispersed among different locations where there is a central entity or team to manage and coordinate them [9]. The central team can be a single person or a group playing the role of delivery manager, research and development manager, or even project manager, according to the particular denomination used. In the context of geographically dispersed development projects, there are issues that are considered key factors for the project success such as effective communication and interactions among teams [37]. In fact, the interactions effect on team’s performance becomes even more important in projects with a centralized control, where the availability and expertise of the central entity are usually more relevant than the expertise of the developers [9]. Based on those concepts, we focus our attention on the central team’s availability and activities to obtain an analytical representation of this entity. Figure 1 presents two automata (Availability and Activities) that represent the main central team’s behaviors.
Central Team Availability A a
u U
Activities s. 1 . sN
M
co .. 1 coN
C
Type Event Type Event Type Event loc a syn s1 syn co1 ... ... ... ... loc u syn sN syn coN
Figure 1: Central team’s automata
In Figure 1, automaton Availability is modeled with two states, where state A represents that the central team is available to cooperate with participants, and state U represents that the central team is unavailable for any reason, e.g., time-zone restrictions, other project assignments, or meetings. Automaton Activities indicates the main tasks performed by the central team, and it is composed of two states: state M represents that the central team is performing any other management activities (according to the specific scenario); and state C represents that the central team is effectively cooperating with one participant. Events are defined to enable the transitions among automata’s states, where each event has an associated occurrence rate, according to the project’s characteristics. Events a and u are local to the automaton Availability indicating the period of time in which the central team remains available to cooperate with participants. It is important to remark that a software development team is composed of N participants that communicate among themselves and with a central team to solve issues and collaborate. Then, event coi (i=1..N) is a synchronizing event between central team and the i-th participant, where its occurrence represents that the central team changes its current activity from management (state M) to collaboration (state C). Event si reflects mostly the level of central team’s expertise, since its synchronizing occurrence indicates that the central team have provided a support for the i-th participant, i.e., changing the central team activity from state C to state M. In the context of software development teams, a participant may play a given role in the project such as software developer, business analyst, tester, data warehouse engineer, database administrator or an user. However, independent of team roles assignment, participants have a similar behavior that can be modeled in a generic form, taking into account their general duties to accomplish, including issues to be solved according to their roles. Figure 2 depicts the automaton that represents the entity Participant with his/her main activities. In Figure 2, a participant is modeled by one automaton composed of the following states: state W represents that the participant is working, i.e., completing its tasks or collaborating with other members; state S represents that the participant is seeking for a specific solution, information, documentation, sources of data or even learning some technical issue by its own; and state C represents that the participant is collaborating with the central team to solve
P. Fernandes, A. Sales, A. R. Santos, T. Webber / Electronic Notes in Theoretical Computer Science 00 (2011) 1–15
4
Participant W si C
ri coi
ei S
Type Event loc ei ri loc syn coi syn si
Figure 2: Participant’s automaton
technical issues, or for example to discuss project decisions. As presented before, the events si and coi represent the synchronization of the i-th participant with the central team Activities automaton, changing the automaton’s state from collaborating (C) to working (W), and from seeking solution (S ) to collaborating (C) respectively. Additionally, this automaton has two local events: ei and ri . Event ei indicates that the i-th participant has an impediment to accomplish his/her tasks and starts seeking a proper solution, i.e., the occurrence of this event changes the participant’s state from W to S . Once an impediment is solved, the participant returns to work and this behavior is represented by the occurrence of event ri that changes the participant’s state from S to W. Table 1 presents a summary of the events of the two entities (Central Team and Participant) previously illustrated in Figures 1 and 2. Table 1: Description of the Central Team and Participant’s events
Event
Description
a
Available: this event is independent of other automata states and indicates that the central team becomes available to manage and collaborate.
u
Unavailable: this event is independent of other automata states and indicates that the central team becomes unavailable to collaborate.
ei
Impediment: when this event occurs the i-th participant goes to the state where he/she need to seek a solution.
ri
Resume working: this event is independent of other automata states, indicating that the i-th participant resumes work after seeking the solution by him/herself.
coi
Collaborate: this event synchronizes i-th participant automaton with central team Activities automaton, starting the collaboration between them.
si
Provided support: the occurrence of this event synchronizes both i-th participant and central team Activities automata, indicating that the participant resumes work after the central team has provided support during the collaboration.
Using both entities depicted in Figures 1 and 2, one can build an analytical model representing a software development project with N participants that collaborate to solve issues. We present in the next section an instantiation of a case study of a real development process with fourteen participants (N=14) and a central team (represented by 2 automata), i.e., a 16 automata model.
P. Fernandes, A. Sales, A. R. Santos, T. Webber / Electronic Notes in Theoretical Computer Science 00 (2011) 1–15
5
3. Practical case study In order to demonstrate that analytical modeling is useful to complex state-based performance analysis of software development teams in multi-site context, we present a model of a practical case study. In the context of this paper, we named the case study project as Alpha due to confidentiality. Alpha was a Data Warehouse project executed by an IT company using multiple locations: Brazil, USA, Malaysia and India. This project was executed during 11 months (i.e., 11 × 22 workdays = 242 days) and its goal is to improve data availability and data analysis for a certain company management level. The project ran with an adequate infrastructure to integrate the participants in a global environment facilitating communication, interactions, knowledge sharing and web-based support. Table 2 presents the teams’ configuration considering senior/junior participants distributed among sites. In this table the last column indicates the average percentage of working hours each participant was allocated to the project. Table 2: Project Alpha Team Configuration
Quantity 1 1 1 3 1 2 1 3 1 1 1
Role Delivery Manager Project Manager Developer Developer Tester Business Analyst Data Warehouse Engineer User System Engineer Database Administrator Data Warehouse Engineer
Expertise Senior Senior Senior Junior Senior Senior Junior Senior Junior Senior Senior
Location USA Brazil Brazil Brazil Brazil USA USA USA Malaysia India India
Allocation 25% 100% 75% 20% 10% 3% 3% 5% 5% 3%
In Project Alpha, interactions among participants were performed on different ways, e.g.: • Data Warehouse Engineers (India/USA) working with Brazil development resources; • Users from USA working with Brazil development resources; • Users from USA working with Brazil test resource; • Business Analysts from USA collaborating with development resources; • Business Analysts from USA collaborating with test resource; • System Engineer from Malaysia working with Brazil development resources; • Database Administrator from India working with Brazil development resources. Project Alpha was composed of the following phases: • Initiating: project goals definition, creation of a preliminary scope statement to help teams work towards to a common objective. In this phase, the team identifies the vision, scope and initial constraints; • Planning: assessment of the existing environment on solution design level. A solution is planned and designed to map project constraints, i.e., a master project plan is delivered; • Execution: the application components are created based on the development plans, as well as software components are tested to ensure that the solution operates properly; • Monitoring and Controlling: in this phase, the tested solution is promoted to production and transferred to operations.
P. Fernandes, A. Sales, A. R. Santos, T. Webber / Electronic Notes in Theoretical Computer Science 00 (2011) 1–15
6
This project had also different types of challenges and impediments detected during execution phase. The distance factor and central team allocation have created certain challenges as the support quality from central team and timezones alignment. For this particular case, central team members are also allocated as resources of other projects setting the central team support quality from medium to low. The time-zone challenge can bring difficulties to members of a given site, making them to extend or change their workday window to be available to work with external site project team members. For example, sometimes a Malaysian participant needs to extend his/her workday window to be able to chat with a Brazilian participant earlier in the morning. For our analysis, and also for the project execution, an impediment is an emerged issue that must be solved and, often, this issue is dependent of central team’s level of support. Examples of project impediments are enterprise environmental factors that refer to any factor that surround or influence the project success, or organizational shared services that refer to outside project services that also influence the project success. Enterprise environmental factors can come from any of the enterprises involved in the project and may include the organizational culture and structure, existing resources, marketing conditions, government or industry standards and project management information systems. Organizational shared services are linked to outside project services such as network engineers, system engineers and security consultants. 3.1. Instantiating the case study Our proposed model uses both automata presented in Figures 1 and 2 (Section 2) that represents the abstraction of Project Alpha. Figure 3 presents the SAN model for Project Alpha based on the configuration presented in Table 2. In this model, the project and delivery managers are abstracted as a central team entity. Therefore, activities of these managers are encapsulated in automaton Activities, as well as their availability to interact with other participants are encapsulated in automaton Availability (Figures 1). In the model presented in Figure 3, each participant is modeled as an automaton of three states (W, S and C) representing their possible activities in a workday. Note that the software development team (Table 2) is composed of N = 14 participants, where 5 participants are from Brazil, 6 from USA, 1 from Malaysia and 2 from India. The participants (developers, tester, business analysts, data warehouse engineers, users, system engineer and database administrator) located in different sites and with different expertises, need to report and collaborate with the project and delivery managers, as well as they collaborate with other participants when needed. It is important to remark that the interactions among participants (previously described in Section 3) are encapsulated in participants’ state W. In this paper, we are only interested on evaluating the interactions between participants and central team. In this scenario, project and delivery managers act as a central team that coordinates the tasks and project completion. However, central team has an availability parameter that indicates the amount of time available for collaboration/management activities and, in many cases, this becomes a bottleneck for asynchronous and synchronous interactions among participants. In this model, remark that the central team interacts only with one participant at each time, which represents a centralized management that is responsible to coordinate individual actions, reducing the risk of conflicts [9]. This approach aims to limit the dependencies among the participants, especially if they are distributed in multi-sites. Of course, in practice software development teams have adopted more flexible processes [38] to easily overcome communication difficulties in the context of global software development. Summarizing, those interactions are dependent on central team availability (e.g., time-zones, other project tasks), levels of support, knowledge level, and capacity to solve issues or project impediments. We are not directly considering intercultural factors, levels of task complexity, effort and actual hours for each task. This model also assumes workload equally distributed among team members, interactions such as e-mails exchanges, instant messaging, conference calls and video conferences. 3.2. Setting model’s parameters Beyond model mapping, event rates estimation is an important phase of analytical modeling. The model dynamics is given by the definition of events that enable the state transitions in the stochastic automata network (Figure 3). Table 3 shows the estimated values for the model’s event rates, considering an eight-hour workday regime. These estimated values were obtained from Project Alpha’s historical/surveyed data and interviews with managers and participants, collecting quantitative data based on their experiences during the project.
P. Fernandes, A. Sales, A. R. Santos, T. Webber / Electronic Notes in Theoretical Computer Science 00 (2011) 1–15
7
Brazil Developer (senior)
Developer (junior)
W
W
s1
C
Type Event loc e1 loc r1 syn co1 s1 syn
C
Type Event loc e2 loc r2 syn co2 s2 syn
C
C
Type Event loc e4 loc r4 syn co4 s4 syn
Type Event loc e5 loc r5 syn co5 s5 syn
India Delivery & Project Managers Availability Activities
W
A r12
C
e12
co12
S
co5
Malaysia System Engineer (junior) s12
e5
r5 S
co4
Type Event loc e3 loc r3 syn co3 s3 syn
s5
e4
r4 S
co3
W
s4
e3
r3 S
co2
Tester (senior)
W
s3
e2
r2 S
co1
Developer (junior)
W
s2
e1
r1 C
Developer (junior)
a
S
s. 1 . s14
u
M
Database Admin. (senior) s13 C
s14
e13
r13
S
co13
Type Event loc a loc u
Type Event loc e12 loc r12 syn co12 syn s12
W
W co .. 1 co14
C
U
Data Warehouse Engineer (senior) e14
r14 C
S
co14
Type Event loc e13 loc r13 syn co13 syn s13
Type Event loc e14 loc r14 syn co14 syn s14
User (senior)
User (senior)
USA Business Analyst (senior)
Business Analyst (senior)
W
W
s6 r6 C
Data Warehouse Engineer (junior)
co6 Type Event loc e6 loc r6 syn co6 syn s6
r7 S
C
W
W
s7
e6
User (senior)
s8
e7
r8 S
co7 Type Event loc e7 loc r7 syn co7 syn s7
C
co8 Type Event loc e8 loc r8 syn co8 syn s8
W
s9
e8
r9 S
C
co9
W
s10
e9
r10 S
C
Type Event loc e9 loc r9 syn co9 syn s9
co10 Type Event loc e10 loc r10 syn co10 syn s10
s11
e10 S
r11 C
co11
e11 S
Type Event loc e11 loc r11 syn co11 syn s11
Figure 3: The SAN model that represents Project Alpha
Regarding participant’s local events e and r, in this project instantiation, both have rates reflecting the level of expertise, where the participants are classified in two types: Junior and Senior. In addition, synchronizing events co do not represent the frequency of cooperations between participants and central team, but these events are modeled only to represent the resource allocation, in this case central team allocation. Hence when the participant is in state S (seeking solution) and the central team is available, the cooperation starts immediately. Therefore, events co have functional rates that are dependent of the state of central team’s automaton Availability, i.e., there is an availability function (named disp) that allows two possible evaluations: (i) events co have a virtually infinite rate, if automaton Availability is in state A; (ii) events co have a zeroed rate, if automaton Availability is in state U.
P. Fernandes, A. Sales, A. R. Santos, T. Webber / Electronic Notes in Theoretical Computer Science 00 (2011) 1–15
8
Table 3: Estimated event rates for an eight-hour workday
Type
Event
loc
a
loc
u
loc
e
loc
r
syn
co
syn
s
Description
Rate
Central team is available to collaborate with participants on average 2 hours per workday, i.e., central team collaborates on a rate of 4 times per workday. Central team is unavailable to cooperate with participants on average 6 hours per workday. Junior participants work on average 1 hour per workday without any kind of central team support. Due to their expertise, senior participants work on average 7 hours per workday without any kind of central team support. Junior participants spend on average 7 hours per workday seeking solutions. Senior participants spend on average only 1 hour per workday seeking solutions because of their expertise. Once a participant needs to collaborate with the central team, the collaboration occurs immediately if the central team is available. Due to the central team support quality (from medium to low), the collaboration takes on average 2 hours per workday.
8/2 8/6 8/1 8/7 8/7 8/1 disp 8/2
The whole model with states, transitions, events and their associated rates can be numerically solved in order to obtain the steady-state probabilities of the model. Based on these probabilities, it is possible to calculate the team’s performance for different scenarios varying, for example, the central team’s availability and the level of expertise of participants. 4. Numerical analysis The actual quantitative results about Project Alpha were assembled from compiling project log files, informal interviews with the managers, and a survey for collecting quantitative information about participants interactions and issues found during project phases. The analytical model results were obtained using Project Alpha data to instantiate the event rates (Section 3.2). 4.1. Project Alpha quantitative data The project quantitative data was collected focusing mainly on the execution phase working hours and on the impediments occurrence during the project. Impediments were described by participants and central team managers as effective interactions among them. Table 4 shows the estimated effort and actual hours related for each phase of Project Alpha. It is important to remark that approximately 3,317.22 hours were actually spent by participants completing their tasks in the execution phase. Table 4: Project Estimated Effort × Actual Hours
Project phase
Estimated
Actual
Initiating Planning Execution Monitoring and Controlling
611.70 h 1,529.25 h 3,364.35 h 611.70 h
771.65 h 895.60 h 3,317.22 h 438.80 h
P. Fernandes, A. Sales, A. R. Santos, T. Webber / Electronic Notes in Theoretical Computer Science 00 (2011) 1–15
9
Project Alpha faced issues resulting in a significant amount of impediments in the project execution phase. Table 5 summarizes these impediments grouped in eight categories: • Resource: indicates problems related to project resource constraints, allocation, changes and replacements; • Technology: indicates issues concerning tools used within the project; • Process: indicates problems related to the development process exceptions during project execution; • Requirements: indicates the requirement information gathering issues; • Schedule: indicates delays in project deliverable dates; • Deliverable: indicates code or project artifacts, e.g., documents, issues; • Scope: indicates issues to project scope changes; and • Infrastructure: indicates problems with application infrastructure. In Table 5, we present the quantity, category, average, and total duration of project’s impediments. We can notice in this table that Project Alpha has spent about 332 hours dealing with impediments. Table 5: Project’s impediments
Quantity
Category
Average
Total duration
9 3 2 11 4 4 1 6 40
Resource Technology Process Requirements Schedule Deliverable Scope Infrastructure Total
8h 4h 8h 4h 8h 24 h 30 h 5h 8.3 h
72 h 12 h 16 h 44 h 32 h 96 h 30 h 30 h 332 h
4.2. Model quantitative results This section presents the quantitative results obtained from the proposed model numerical solution, according to the parameters defined in Table 3 (Section 3.2). The numerical solution is primarily expressed by the steady-state probability of the SAN model. From these probabilities and from the participants individual hours allocated to Project Alpha, we can determine the average working hours per eight-hour workday. Readers interested in more information about the software tool for numerical solution of SAN models refer to PEPS (Performance Evaluation of Parallel Systems) [20]. Table 6 shows the results of the main entities of the proposed model (Central Team, Senior, and Junior participants) and their correspondent steady-state probabilities. Observing the results presented in Table 6, it is possible to notice that senior participants have, as expected, high autonomy to deal with their tasks. However, the probability of working state (W) for senior participants is slightly smaller than the 87.5% corresponding to the seven hours of working per eight-hour workday. Observing the working percentage of junior participants, we find a quite low value of 14.7% which corresponds to a little more than one hour of work per eight-hour workday, while most of their time (more than six hours per workday) is spent in state S (seeking solution). Junior participants do not collaborate very often with the central team (half an hour per workday), which is probably a side effect of the low availability and low quality provided support.
P. Fernandes, A. Sales, A. R. Santos, T. Webber / Electronic Notes in Theoretical Computer Science 00 (2011) 1–15
10
Table 6: Steady-State probabilities of the proposed model
Entity
Central Team
Seniors
Juniors
State
Probability
A U M C W S C W S C
25.00% 75.00% 56.27% 43.73% 87.09% 11.96% 0.95% 14.70% 78.26% 7.04%
Table 7 shows the participants individual working hours taking into account the average percentage of working hours each participant was allocated to the project (see Table 2). According to Table 4, Project Alpha spent 3,317.22 hours in the execution phase, instead of the initially estimated 3,364.35 hours. This difference corresponds to less than 1.5%, which already is a very small error of judgment. However, Table 7 shows that the analytical model instantiated to Project Alpha parameters pointed out an average of 13.69 working hours, considering all participants individual working hours. Consequently, using as basis 242 days (11 months with 22 workdays) of project execution, the total number of working hours calculated from the model probabilities is 3,312.98 hours. Note that the model provided an approximated value for the total working hours, which is even closer to the actual number of hours spent in the execution phase. In fact, the predictions obtained from the SAN model deliver estimations with an impressive relative error of less than 0.2%. Table 7: Project working hours obtained from the proposed model
Quantity
Expertise
Allocation (%)
State W (%)
Working hours per day
1 3 1 2 1 3 1 1 1
Senior Junior Senior Senior Junior Senior Junior Senior Senior
100 75 20 10 3 3 5 5 3
87.09 14.70 87.09 87.09 14.70 87.09 14.70 87.09 87.09 Total
6.97 2.65 1.39 1.39 0.04 0.63 0.06 0.35 0.21 13.69
Analogously to the prediction of working hours (Table 7), Table 8 presents the results from the analytical model regarding project impediments, using state C probabilities as statistical information about needed interactions to solve issues. The cooperation hours are summed in this table to indicate the time spent in solving project issues cooperating with the central team, considering an eight-hour workday. State C abstraction indicates that participants have found issues difficult to overcome by themselves and need effectively to cooperate with the central team managers to solve them.
P. Fernandes, A. Sales, A. R. Santos, T. Webber / Electronic Notes in Theoretical Computer Science 00 (2011) 1–15
11
Table 8: Project impediment hours obtained from the proposed model
Quantity
Expertise
Allocation (%)
State C (%)
Cooperating hours per day
1 3 1 2 1 3 1 1 1
Senior Junior Senior Senior Junior Senior Junior Senior Senior
100 75 20 10 3 3 5 5 3
0.95 7.04 0.95 0.95 7.04 0.95 7.04 0.95 0.95 Total
0.076 1.267 0.015 0.015 0.017 0.007 0.028 0.004 0.002 1.43
The analytical model predictions for the collaboration hours to solve project impediments is on average 1.43 hours per day. Once again, considering 242 workdays as the project duration, the model results indicate a total of 346.06 hours of impediments. Comparing this prediction with the 332 impediments hours observed in Project Alpha (Table 5), a very small relative error of 4% is still found, which is even more impressive taking into account the amount of information that was abstracted while defining the model states and event rates. 4.3. Different scenarios analysis Since the results obtained from the analytical model of Project Alpha were successful considering the low relative errors found in previous section, different scenarios were modeled in order to analyze the impact on varying availability hours and levels of support provided by the managers. The team configuration was not changed maintaining 14 participants and the central team, keeping the participants parameterized (events e and r) with original expertises (Table 3, Section 3.2). For the other events (a, u and s), we present in Table 9 different values for the model’s event rates, i.e., assuming different central team management behaviors. Specifically, we consider two levels of availability (High and Low) and four levels of quality of support (Lower, Low, High, and Higher). Taking into account these levels of availability and support, it is possible to define eight different scenarios according with the estimated event rates presented in the table. In Table 10, we present the configurations of scenarios used to predict Project Alpha, varying levels of availability and support quality provided by the central team. Using those new configurations it is possible to calculate new time estimates for project execution phase on each scenario through the model solution. Table 11 presents the results for eight proposed scenarios from Table 10, showing the estimated working hours per day calculated for the whole team and, hence, the estimated project execution time. Observing the results presented in Table 11, scenario 8 (Low level of availability and Lower level of support provided by the central team) presented as expected the worst estimated time for the project execution phase, i.e., if the project was executed with this configuration it would take around 11.28 execution months. Actually, time estimates for project execution considering scenarios 5, 6, 7, and 8 (where the central team provides a Low level of availability) were close to actual execution time of Project Alpha. There is a little gain of around 3.8% in scenario 5 (10.58 months to perform the project) in contrast to the actual execution time (11.00 months) of Project Alpha. Notice that the fact of increasing the central team availability level from Low to High does not necessarily improve the gain on project execution time. High levels of availability combined with Low or Lower level of support quality generates a small project execution time gain (about 2.7%) or even execution time loss (around 2.2%). This fact can be observed through results presented in Table 11 respectively for scenarios 3 and 4. On the other hand, High levels of availability combined with High levels of quality of support can provide significant gain on project execution time.
P. Fernandes, A. Sales, A. R. Santos, T. Webber / Electronic Notes in Theoretical Computer Science 00 (2011) 1–15
12
Table 9: Estimated event rates for an eight-hour workday composing different scenarios
Type
loc
loc
loc
Event
a
u
e
loc
r
syn
co
syn
s
Description
Rate
High availability: Central team is available to collaborate with participants on average 7 hours per workday. Low availability: Central team is available to collaborate with participants on average 1 hour per workday. High availability: Central team is unavailable to cooperate with participants on average 1 hour per workday. Low availability: Central team is unavailable to cooperate with participants on average 7 hour per workday. Junior participants work on average 1 hour per workday without any kind of central team support. Due to their expertise, senior participants work on average 7 hours per workday without any kind of central team support. Junior participants spend on average 7 hours per workday seeking solutions. Senior participants spend on average only 1 hour per workday seeking solutions because of their expertise. Once a participant needs to collaborate with the central team, the collaboration occurs immediately if the central team is available. Higher quality: Central team takes on average 0.5 hour per workday collaborating with participants. High quality: Central team takes on average 1 hour per workday collaborating with participants. Low quality: Central team takes on average 2 hours per workday collaborating with participants. Lower quality: Central team takes on average 4 hours per workday collaborating with participants.
8/7 8/1 8/1 8/7 8/1 8/7 8/7 8/1 disp 8/0.5 8/1 8/2 8/4
For scenario 2, it was obtained a gain of 11% (i.e., the project could be performed during 9.79 months instead of the actual execution time of 11 months), and the best estimated time for executing the project was obtained from scenario 1, where the project could be executed during 8.44 months (i.e., a gain of approximately 23%). Table 10: Configuration of scenarios for performance prediction of Project Alpha
Scenario
Level of availability (event a)
Level of quality of support (event s)
1 2 3 4 5 6 7 8
High High High High Low Low Low Low
Higher High Low Lower Higher High Low Lower
P. Fernandes, A. Sales, A. R. Santos, T. Webber / Electronic Notes in Theoretical Computer Science 00 (2011) 1–15
13
Table 11: Estimated time for executing the project
Actual project execution time
Scenario
Estimated working hours per day
Estimated project execution time
3,317.22 hours performed during 11.00 months
1 2 3 4 5 6 7 8
17.87 hours 15.40 hours 14.09 hours 13.41 hours 14.25 hours 13.85 hours 13.58 hours 13.37 hours
8.44 months 9.79 months 10.70 months 11.24 months 10.58 months 10.89 months 11.10 months 11.28 months
The use of modeling formalisms to describe and analyze global software development projects is not a trivial effort. This section presented a modeling exercise, which has demonstrated to be useful on the context of software engineering for project planning and analysis. Our focus was on the analysis and prediction of project execution time. But, other project phases (e.g., monitoring and controlling) could be considered to measure the team’s performance in these phases. 5. Conclusion The performance evaluation of software development teams using analytical models is an important tool in project management area. Moreover, these mathematical models allow the analysis and prediction of expected and nonexpected behaviors of teams under complex situations, such as development projects with participants having different levels of expertise in multiple locations and multiple time zones. An important contribution of this paper is to bring into a practical case scenario a theoretical modeling effort to describe a complex environment of global software development. Despite the numerous abstractions made in the modeling stage, the obtained numerical results demonstrated a very impressive accuracy when compared to actual project outcome (i.e., a relative error of less than 0.2%). Precisely, computing the steady-state probabilities of the instantiated model composed of 16 automata (i.e., more than 19 million states), we were able to predict a total number of 3,312.98 working hours to execute the project compared to 3,317.22 actual working hours spent in the execution phase. This fact by itself justifies our initial assumption that analytical modeling, in our particular case modeled using the SAN formalism, may be a worthy option to build teams in software development projects anticipating its overall performance. We also propose in this paper different model instantiations (varying the availability and levels of support provided by the central team) to observe the impact of central team’s characteristics on the total time of the project execution phase. It was possible to notice that a central team that provides a high availability and high levels of support can reach considerable gains on the project execution time, i.e., a gain between 10% and 25%. However, a central team that provides a low availability, or even a high availability but low levels of support, does not impact significantly on the project execution time. For these cases, the increase of the predicted time to perform the project was inferior to two weeks. This analysis can bring important contributions on team building process, where it can be economically interesting to compose a development team with a central team that has low availability, since the total project execution time has a little variation (less than a couple of weeks). On the contrary, if a participant interacts with a central team highly available, then the level of support provided by this central team must also be high in order to achieve project execution time gains. Although this paper presents a successful modeling effort of a real case development project, it is important to keep in mind that a powerful stochastic modeling formalism was used, and an efficient solution tool is required to achieve the numerical predictions in a timely manner. Therefore, it is important to have either a performance evaluation expert, or a very suitable model to apply to different real case projects. This fact opens interesting future works about
P. Fernandes, A. Sales, A. R. Santos, T. Webber / Electronic Notes in Theoretical Computer Science 00 (2011) 1–15
14
an automatic tool to facilitate the model instantiation in order to make this modeling approach much more easily applicable even for project managers that usually are not performance evaluation experts. A possible future work is to extend the current theoretical model to encompass other different aspects that can be relevant to project outcome. For example, the results obtained in this paper suggest the extension of the model in order to represent explicit interactions between senior and junior participants, reducing the time spent for seeking issue solutions and increasing the working hours per day. Another interesting future work is to thoroughly analyze model representations of a global software development project, varying the number of participants with different levels of experience and availability, where a project could be modeled by traditional and agile software development methodologies [38]. This numerical analysis may provide insightful conclusions not only to specific practical cases, but it also draws formal comparisons between software development methodologies. Nevertheless, the proposed analytical model may be applied as it is to a large number of practical cases, and considering the accuracy achieved for the project Alpha modeling, it is natural to expect good predictions about the outcome of software development teams. References [1] [2] [3] [4] [5] [6] [7]
[8] [9] [10] [11] [12] [13] [14] [15] [16]
[17] [18] [19] [20] [21] [22]
[23] [24]
A. Taweel, P. Brereton, Modelling software development across time zones, Information and Software Technology 48 (1) (2006) 1–11. S. Faraj, L. Sproull, Coordinating expertise in software development teams, Management Science 46 (12) (2000) 1554–1568. E. Carmel, Global software teams: collaborating across borders and time zones, Prentice Hall PTR, Upper Saddle River, NJ, USA, 1999. C. U. Smith, L. G. Williams, Software performance engineering: a case study including performance comparison with design alternatives, IEEE Transactions on Software Engineering 19 (7) (1993) 720–741. S. Setamanit, W. Wakeland, D. M. Raffo, Planning and improving global software development process using simulation, in: Proceedings of the 2006 International Workshop on Global Software Development for the Practitioner (GSD’06), Shanghai, China, 2006, pp. 8–14. J. N. Cummings, J. A. Espinosa, C. K. Pickering, Crossing spatial and temporal boundaries in globally distributed projects: A relational model of coordination delay, Information Systems Research 20 (3) (2009) 420–439. K. Swigger, F. C. Serce, F. N. Alpaslan, R. Brazile, G. Dafoulas, V. Lopez, A Comparison of Team Performance Measures for Global Software Development Student Teams, in: Proceedings of the 4th International Conference on Global Software Engineering (ICGSE’09), 2009, pp. 267–274. M. Bass, J. D. Herbsleb, C. Lescher, Collaboration in Global Software Projects at Siemens: An Experience Report, in: Proceedings of the 2nd International Conference on Global Software Engineering (ICGSE’07), 2007, pp. 33–39. R. Sangwan, N. Mullick, M. Bass, D. J. Paulish, J. Kazmeier, Global Software Development Handbook, CRC Press, 2006. A. von Mayrhauser, The role of simulation in software engineering experimentation, Lecture Notes in Computer Science 706 (1993) 177–179. S. Ferreira, J. Collofello, D. Shunk, G. Mackulak, Understanding the effects of requirements volatility in software engineering by using analytical modeling and software process simulation, Journal of Systems and Software 82 (10) (2009) 1568–1577. S. Setamanit, W. Wakeland, D. M. Raffo, Using simulation to evaluate global software development task allocation strategies: Research Sections, Software Process: Improvement and Practice 12 (5) (2007) 491–503. M. I. Kellner, R. J. Madachy, D. M. Raffo, Software process simulation modeling: why? what? how?, The Journal of Systems & Software 46 (2-3) (1999) 91–105. F. Padberg, A Discrete Simulation Model for Assessing Software Project Scheduling Policies, Software Process: Improvement and Practice 7 (3-4) (2002) 127–139. R. M. Czekster, P. Fernandes, A. Sales, T. Webber, Analytical Modeling of Software Development Teams in Globally Distributed Projects, in: Proceedings of the 5th International Conference on Global Software Engineering (ICGSE’10), IEEE Computer Society, 2010, pp. 287–296. A. Avritzer, A. Lima, An Empirical Approach for the Assessment of Scheduling Risk in A Large Globally Distributed Industrial Software Project, in: Proceedings of the 4th International Conference on Global Software Engineering (ICGSE’09), IEEE Computer Society, 2009, pp. 341–346. B. Plateau, On the stochastic structure of parallelism and synchronization models for distributed algorithms, ACM SIGMETRICS Performance Evaluation Review 13 (2) (1985) 147–154. L. Brenner, P. Fernandes, A. Sales, The Need for and the Advantages of Generalized Tensor Algebra for Kronecker Structured Representations, International Journal of Simulation: Systems, Science & Technology (IJSIM) 6 (3-4) (2005) 52–60. W. J. Stewart, Introduction to the numerical solution of Markov chains, Princeton University Press, 1994. L. Brenner, P. Fernandes, B. Plateau, I. Sbeity, PEPS2007 - Stochastic Automata Networks Software Tool, in: Proceedings of the 4th International Conference on Quantitative Evaluation of SysTems (QEST 2007), IEEE Computer Society, Edinburgh, UK, 2007, pp. 163–164. M. Tribastone, A. Duguid, S. Gilmore, The PEPA Eclipse Plug-in, Performance Evaluation Review 36 (4) (2009) 28–33. R. M. Czekster, P. Fernandes, T. Webber, GTA express - A Software Package to Handle Kronecker Descriptors, in: Proceedings of the 6th International Conference on Quantitative Evaluation of SysTems (QEST 2009), IEEE Computer Society, Budapest, Hungary, 2009, pp. 281–282. Project Management Institute, A Guide to the Project Management Body of Knowledge (PMBOK Guide), Project Management Institute, 2008. C. Bertolini, A. G. Farina, P. Fernandes, F. M. Oliveira, Test Case Generation Using Stochastic Automata Networks: Quantitative Analysis, in: Proceedings of the 2nd International Conference on Software Engineering and Formal Methods (SEFM’04), 2004, pp. 251–260.
P. Fernandes, A. Sales, A. R. Santos, T. Webber / Electronic Notes in Theoretical Computer Science 00 (2011) 1–15
15
[25] A. G. Farina, P. Fernandes, F. M. Oliveira, Representing software usage models with Stochastic Automata Networks, in: Proceedings of the 14th International Conference on Software Engineering and Knowledge Engineering (SEKE’02), Ischia, Italy, 2002, pp. 401–407. [26] J. A. Whittaker, M. G. Thomason, A Markov Chain Model for Statistical Software Testing, IEEE Transactions on Software Engineering 20 (10) (1994) 812–824. [27] K. A. Buragga, An analytical model for requirements activities and software product quality, Journal of Computational Methods in Science and Engineering 6 (2006) 205–215. [28] G. H. Walton, J. H. Poore, Generating transition probabilities to support model-based software testing, Software: Practice and Experience 30 (10) (2000) 1095–1106. [29] F. L. Dotti, P. Fernandes, C. M. Nunes, Structured Markovian models for discrete spatial mobile node distribution, Journal of the Brazilian Computer Society 17 (2011) 31–52. [30] H. DeRemigio, P. Kemper, M. D. Lamar, G. D. Smith, Markov Chain Models of Coupled Intracellular Calcium Channels: Kronecker Structured Representations and Benchmark Stationary Distribution Calculations, in: Pacific Symposium on Biocomputing, World Scientific, Kohala Coast, Hawaii, USA, 2008, pp. 354–365. [31] R. Chanin, M. Corrˆea, P. Fernandes, A. Sales, R. Scheer, A. F. Zorzo, Analytical Modeling for Operating System Schedulers on NUMA Systems, Electronic Notes in Theoretical Computer Science (ENTCS) 151 (3) (2006) 131–149. [32] F. Delamare, F. L. Dotti, P. Fernandes, C. M. Nunes, L. C. Ost, Analytical modeling of random waypoint mobility patterns, in: Proceedings of the 3rd ACM International Workshop on Performance Evaluation of Wireless Ad Hoc, Sensor, and Ubiquitous Networks (PE-WASUN’06), ACM Press, Terromolinos, Spain, 2006, pp. 106–113. [33] L. Baldo, L. Brenner, L. G. Fernandes, P. Fernandes, A. Sales, Performance Models for Master/Slave Parallel Programs, Electronic Notes In Theoretical Computer Science (ENTCS) 128 (4) (2005) 101–121. [34] V. Nguyen, R. Mathias, G. D. Smith, A stochastic automata network descriptor for Markov chain models of instantaneously coupled intracellular Ca2+ channels, Bulletin of Mathematical Biology 67 (3) (2005) 393–432. [35] A. Nandi, R. Marculescu, System-level power/performance analysis for embedded systems design, in: Proceedings of the 38th annual Design Automation Conference (DAC 2001), ACM, Las Vegas, Nevada, USA, 2001, pp. 599–604. [36] P. Fernandes, B. Plateau, W. J. Stewart, Efficient descriptor-vector multiplication in Stochastic Automata Networks, Journal of the ACM 45 (3) (1998) 381–414. [37] J. D. Herbsleb, A. Mockus, An Empirical Study of Speed and Communication in Globally Distributed Software Development, IEEE Transactions on Software Engineering 29 (6) (2003) 481–494. [38] M. Cohn, Agile Estimating and Planning, Prentice Hall PTR, Upper Saddle River, NJ, USA, 2005.