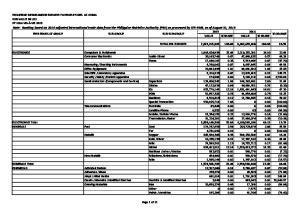
PHILIPPINE MERCHANDISE EXPORTS TO GERMANY FOB VALUE IN US$ FY 2013 VIS-À-VIS 2012 SOURCE: PSA PROCESSED BY: DTI-EMB
Note: Based on adjusted and final 2013 international trade data from the Philippine Statistics Authority (PSA) as processed by DTI-EMB, as of June 10, 2014 PRODUCT GROUP
SUB GROUP
SUB SUB GROUP TOTAL PHL EXPORTS
ANIMAL ORIGIN ANIMAL ORIGIN Total ARMS /AMMUNITIONS /EXPLOSIVES ARMS /AMMUNITIONS /EXPLOSIVES Total ARTS /ANTIQUES ARTS /ANTIQUES Total BEVERAGES BEVERAGES Total CARRAGEENAN CARRAGEENAN Total CHEMICALS
Coral /Shell Misc Arms /Ammunitions Artworks Non-Alcoholic
Activated Carbon Adhesives /Glues Alkyd /Allied Resins Casein /Albumins /Modified Starches Coloring Materials
Inorganic Lubricating Preparations Misc Oleochemicals Organic Pest Control /Bio-Security Plastic
Juice Drinks
Dextrins & Modified Starches Inks Paints /Varnishes Pigments
Insecticides Other Primary Form
Pyrotechnics Surfactants CHEMICALS Total COCONUT COCONUT Total
Coir Page 1 of 9
2013 VALUE % SHARE
2012 VALUE % SHARE
2,338,879,884
100.00
1,956,091,708
100.00
137,300 0 137,300 1,958,404 1,958,404 72,469 72,469 0 0 5,491,115 5,491,115 18,035,621 4,124 20,384 196 225,623 0 20,385 1,462,568 67,532 1,222,932 106,540 0 0 21,159 625,015 218,508 18,872 22,049,459 81,118 81,118
0.01 0.00 0.01 0.08 0.08 0.00 0.00 0.00 0.00 0.23 0.23 0.77 0.00 0.00 0.00 0.01 0.00 0.00 0.06 0.00 0.05 0.00 0.00 0.00 0.00 0.03 0.01 0.00 0.94 0.00 0.00
97,332 1,480 98,812 237,140 237,140 3,195 3,195 24,697 24,697 6,433,485 6,433,485 10,838,104 53,112 0 0 67,592 40,976 0 1,614,569 0 156,931 8,940,030 62,500 49,831 8,331 268,657 1,819 1,376,848 23,479,300 0 0
0.00 0.00 0.01 0.01 0.01 0.00 0.00 0.00 0.00 0.33 0.33 0.55 0.00 0.00 0.00 0.00 0.00 0.00 0.08 0.00 0.01 0.46 0.00 0.00 0.00 0.01 0.00 0.07 1.20 0.00 0.00
% CHANGE 19.57 41.06 (100.00) 38.95 725.84 725.84 2,168.20 2,168.20 (100.00) (100.00) (14.65) (14.65) 66.41 (92.24)
233.80 (100.00) (9.41) 679.28 (98.81) (100.00) (100.00) 153.98 132.64 11,912.53 (98.63) (6.09)
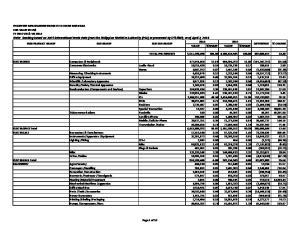
PRODUCT GROUP CONSTRUCTION MATERIALS
SUB GROUP Aggregates Builders' Woodwork Cement Marble Tile /Slab Metal Misc Plastic
SUB SUB GROUP
Misc Tube /Pipe /Fitting Other Pipes /Fittings
Prefab Building Sanitarywares /Bathroom Fixtures CONSTRUCTION MATERIALS Total ELECTRICALS
Generators & Transformers Instruments /Apparatus /Equipment Lighting /Fitting
CFL-I Misc Plugs & Sockets
Misc Wires /Cables ELECTRICALS Total ELECTRONICS
Computers & Peripherals Consumer Electronics Measuring /Checking Instruments Office Equipment Scientific /Laboratory Apparatus Security /Safety /Control Apparatus Semiconductors (Components and Devices)
Telecommunications
ELECTRONICS Total FASHION ACCESSORIES
Gloves /Mittens
Audio Visual Home
Capacitors Diodes ICs PCBs Resistors Special Transaction Facsimile Landline Phone Mobile /Cellular Phone Transmission /Radar Fashion Page 2 of 9
2013 VALUE % SHARE 49,195 257,517 2,924,275 35,774 17,681 26,178 324,802 37,122 160,107 79,177 21,142 3,932,970 5,955,580 22,951,460 25 13,763,271 9,713 42,731,968 195,686 85,607,703 452,733,687 47,832,950 4,970,164 585,143 12,432,252 10,160,506 1,011 2,301,634 114,402,800 676,447,878 6,753,005 38,906 13,602,049 20,325 634,751 833,950 22,859,592 1,366,610,603 65,892
0.00 0.01 0.13 0.00 0.00 0.00 0.01 0.00 0.01 0.00 0.00 0.17 0.25 0.98 0.00 0.59 0.00 1.83 0.01 3.66 19.36 2.05 0.21 0.03 0.53 0.43 0.00 0.10 4.89 28.92 0.29 0.00 0.58 0.00 0.03 0.04 0.98 58.43 0.00
2012 VALUE % SHARE 47,374 0 101,896 11,192 23,572 42,844 454,134 0 5,000 89,822 32,294 808,128 1,415,025 173,546,068 0 22,522,958 5,272 44,767,113 71,058 242,327,494 269,055,263 36,068,112 3,809,079 1,588,986 13,533,719 11,309,184 0 4,312,572 56,941,156 313,271,428 8,233,643 7,400 67,342,440 52,000 724,857 4,464,224 10,349,026 801,063,089 185,704
0.00 0.00 0.01 0.00 0.00 0.00 0.02 0.00 0.00 0.00 0.00 0.04 0.07 8.87 0.00 1.15 0.00 2.29 0.00 12.39 13.75 1.84 0.19 0.08 0.69 0.58 0.00 0.22 2.91 16.02 0.42 0.00 3.44 0.00 0.04 0.23 0.53 40.95 0.01
% CHANGE 3.84 2,769.86 219.64 (24.99) (38.90) (28.48) 3,102.14 (11.85) (34.53) 386.68 320.88 (86.78) (38.89) 84.24 (4.55) 175.39 (64.67) 68.27 32.62 30.48 (63.18) (8.14) (10.16) (46.63) 100.91 115.93 (17.98) 425.76 (79.80) (60.91) (12.43) (81.32) 120.89 70.60 (64.52)
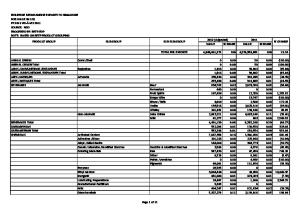
PRODUCT GROUP
SUB GROUP
SUB SUB GROUP Sport /Work
Handbags /Belts Hats /Headgears Jewellery Misc
Travelgoods
FASHION ACCESSORIES Total FLOWER /PLANT
Live
Costume Precious Article /Accessory Eyewear Feather Article Safety /Protective Gear Umbrella /Stick /Whip Wigs /Toupees Misc Sport Bags Trunks /Cases /Satchels Misc Orchid
Misc FLOWER /PLANT Total FOOTWEAR
FOOTWEAR Total FOREST-BASED
FOREST-BASED Total FRESH FOOD FRESH FOOD Total FURNITURE /FURNISHINGS
Non-Leather Parts /Supplies /Accessories Slippers /Sandals Special Use Sports Fibreboard Fuel Wood /Charcoal Lumber Non-Wood Pulpwood Fruits Meat /Meat Offal
Banana Poultry
Furnishing
Lamp /Lighting Matress / Cushion Indigenous Metal Parts /Supplies
Furniture
Page 3 of 9
2013 VALUE % SHARE 320,012 101,412 709,534 681,200 336,528 7,197,943 8,403,612 0 1,308,520 7,131 232,487 847,648 4,938,400 0 25,150,319 4,927 0 66,050 70,977 52 326 1,500 430,739 539,566 972,183 217,106 41,544 112 81,867 2,396 343,025 3,802,290 0 3,802,290 3,583,225 107,074 297,219 313,826 3,556,738
0.01 0.00 0.03 0.03 0.01 0.31 0.36 0.00 0.06 0.00 0.01 0.04 0.21 0.00 1.08 0.00 0.00 0.00 0.00 0.00 0.00 0.00 0.02 0.02 0.04 0.01 0.00 0.00 0.00 0.00 0.01 0.16 0.00 0.16 0.15 0.00 0.01 0.01 0.15
2012 VALUE % SHARE 358,113 107,522 47,872 1,516,682 275,230 11,094,309 869,893 78,876 1,191,712 865 405,589 20,923 3,135,459 213,316 19,502,065 0 4,655 167,665 172,320 3,680 0 3,011 741,308 397 748,396 18,824 0 319 6,084 526 25,753 987,610 16,084 1,003,694 1,143,328 321,798 427,809 528,350 161,709
% CHANGE
0.02 (10.64) 0.01 (5.68) 0.00 1,382.15 0.08 (55.09) 0.01 22.27 0.57 (35.12) 0.04 866.05 0.00 (100.00) 0.06 9.80 0.00 724.39 0.02 (42.68) 0.00 3,951.27 0.16 57.50 0.01 (100.00) 1.00 28.96 0.00 0.00 (100.00) 0.01 (60.61) 0.01 (58.81) 0.00 (98.59) 0.00 0.00 (50.18) 0.04 (41.89) 0.00 135,810.83 0.04 29.90 0.00 1,053.35 0.00 0.00 (64.89) 0.00 1,245.61 0.00 355.51 0.00 1,231.98 0.05 285.00 0.00 (100.00) 0.05 278.83 0.06 213.40 0.02 (66.73) 0.02 (30.53) 0.03 (40.60) 0.01 2,099.47
PRODUCT GROUP
SUB GROUP
SUB SUB GROUP Plastic Special Purpose Stone Wood
FURNITURE /FURNISHINGS Total GAMES /SPORTS
GAMES /SPORTS Total GARMENT /TEXTILE
Fishing /Hunting Games Sports
Apparel
Non-Apparel
GARMENT /TEXTILE Total GLASS MANUFACTURES GLASS MANUFACTURES Total HEALTH SUPPLEMENTS HEALTH SUPPLEMENTS Total HOUSEWARES
Balls Gym / Athlete Cotton Man-Made Other Silk /Vegetable Wool Fabric Made-Up Articles Yarn
Float /Polished Misc
Artificial Flowers / Trees Basketworks Holiday Décor Misc Shellcraft Statuette Table /Kitchen
Ceramicware Glassware Misc Utensil
Woodware HOUSEWARES Total INDUSTRIAL SCRAPS /PARINGS /WASTES
Electric /Electrical Metal
Iron /Steel Misc Page 4 of 9
2013 VALUE % SHARE 3,789,614 2,270 1,726 2,317,719 13,969,411 229,055 23,981 1,217,534 28,959 1,499,529 14,953,076 33,600,441 825,598 3,430,591 1,527,236 444,298 360,328 4,290 55,145,858 301,704 19,212,431 19,514,135 3,408 3,408 29,980 418,096 248,884 142,906 1,196,755 536,283 20,798 4,088 1,642,979 879,976 216,030 5,336,775 868 68,191 25,704
0.16 0.00 0.00 0.10 0.60 0.01 0.00 0.05 0.00 0.06 0.64 1.44 0.04 0.15 0.07 0.02 0.02 0.00 2.36 0.01 0.82 0.83 0.00 0.00 0.00 0.02 0.01 0.01 0.05 0.02 0.00 0.00 0.07 0.04 0.01 0.23 0.00 0.00 0.00
2012 VALUE % SHARE 93,663 0 86,622 3,836,736 6,600,015 316,160 24,196 1,077,768 1,540 1,419,664 8,031,643 32,187,152 4,024,451 2,365,447 744,957 545,037 290,987 273 48,189,947 0 697,380 697,380 11,607 11,607 90,742 413,641 742,319 152,638 1,790,942 751,949 20,355 880 522,995 263,673 151,883 4,902,017 0 124,887 189,097
0.00 0.00 0.00 0.20 0.34 0.02 0.00 0.06 0.00 0.07 0.41 1.65 0.21 0.12 0.04 0.03 0.01 0.00 2.46 0.00 0.04 0.04 0.00 0.00 0.00 0.02 0.04 0.01 0.09 0.04 0.00 0.00 0.03 0.01 0.01 0.25 0.00 0.01 0.01
% CHANGE 3,946.01 (98.01) (39.59) 111.66 (27.55) (0.89) 12.97 1,780.45 5.63 86.18 4.39 (79.49) 45.03 105.01 (18.48) 23.83 1,471.43 14.43 2,654.94 2,698.21 (70.64) (70.64) (66.96) 1.08 (66.47) (6.38) (33.18) (28.68) 2.18 364.55 214.15 233.74 42.23 8.87 (45.40) (86.41)
PRODUCT GROUP
SUB GROUP
SUB SUB GROUP
Misc Plastic INDUSTRIAL SCRAPS /PARINGS /WASTES Total LAC /GUM /RESIN /SAP LAC /GUM /RESIN /SAP Total LEATHER HIDE /SKIN LEATHER HIDE /SKIN Total LIVE ANIMALS LIVE ANIMALS Total MACHINERY
MACHINERY Total MARINE /AQUACULTURE
MARINE /AQUACULTURE Total MEDIA /ENTERTAINMENT MEDIA /ENTERTAINMENT Total MEDICAL SUPPLY /DEVICE MEDICAL SUPPLY /DEVICE Total MEDICINAL PLANTS /SEEDS /FRUITS MEDICINAL PLANTS /SEEDS /FRUITS Total METAL MANUFACTURES
Misc Birds Misc Agro-Forestry Conveyors /Handling Excavation /Construction Extinguishing /Blasting /Spraying Garments /Footwear /Travelgoods Heating /Material Treatment Lathes Mechanical Machines /Apparatus Office Machines Parts /Tools /Accessories Power Generators Printing /Binding /Packaging Pumps /Compressors /Fans Rolling /Filtering Fish Eggs/Sardines Live Fish Molluscs Tuna
Recorded
Fresh /Chilled /Frozen Misc Other
Aluminum Copper Page 5 of 9
2013 VALUE % SHARE 0 0 94,763 107,700 107,700 324,190 324,190 10,515 134,690 145,205 5,448,679 169,847 8,122,674 203,897 194 6,176,397 500 726,099 1,897,827 9,904,340 1,146,859 48,244 108,576 353,849 34,307,982 7,382,497 0 96 412,300 85,689,349 93,484,242 150 150 3,730,553 3,730,553 41,167 41,167 285,249 55,685
0.00 0.00 0.00 0.00 0.00 0.01 0.01 0.00 0.01 0.01 0.23 0.01 0.35 0.01 0.00 0.26 0.00 0.03 0.08 0.42 0.05 0.00 0.00 0.02 1.47 0.32 0.00 0.00 0.02 3.66 4.00 0.00 0.00 0.16 0.16 0.00 0.00 0.01 0.00
2012 VALUE % SHARE 250 155 314,389 51,000 51,000 314,140 314,140 5,374 263,874 269,248 86,089 3,498 5,787,490 634,639 682 63,550 0 3,617,310 1,084,520 1,199,727 2,470 88,389 540,404 150,321 13,259,089 39,460,197 10,121 7,532 1,729,668 31,060,574 72,268,092 0 0 1,359,893 1,359,893 0 0 246,245 51,601
0.00 0.00 0.02 0.00 0.00 0.02 0.02 0.00 0.01 0.01 0.00 0.00 0.30 0.03 0.00 0.00 0.00 0.18 0.06 0.06 0.00 0.00 0.03 0.01 0.68 2.02 0.00 0.00 0.09 1.59 3.69 0.00 0.00 0.07 0.07 0.00 0.00 0.01 0.00
% CHANGE (100.00) (100.00) (69.86) 111.18 111.18 3.20 3.20 95.66 (48.96) (46.07) 6,229.12 4,755.55 40.35 (67.87) (71.55) 9,618.96 (79.93) 74.99 725.55 46,331.54 (45.42) (79.91) 135.40 158.75 (81.29) (100.00) (98.73) (76.16) 175.88 29.36
174.33 174.33
15.84 7.91
PRODUCT GROUP
SUB GROUP Iron /Steel /Alloy
SUB SUB GROUP Bolts /Nuts Misc
Misc Nickel METAL MANUFACTURES Total MINERALS
MINERALS Total MISC. INDUSTRIAL PRODUCTS MISC. INDUSTRIAL PRODUCTS Total MUSICAL INSTRUMENTS MUSICAL INSTRUMENTS Total OILS /FATS /WAXES
OILS /FATS /WAXES Total PACKAGING
Fuel Metallic Non-Metallic
Coal Misc Milestone /Grindstone Misc
Misc Coconut Essential Vegetable
Fiber Textile Glass Metal
Misc Misc Palm /Palm Kernel /Babassu Soya
Aluminum Copper /Tin Iron /Steel
Paper Plastic Wood PACKAGING Total PAPER MANUFACTURES
PAPER MANUFACTURES Total PERSONAL CARE
Coated Graphic Kraft Misc Not Further Worked Photo Beauty /Make-up Grooming Essentials Misc Page 6 of 9
2013 VALUE % SHARE 7,160,040 126,475,338 237,904 88 134,214,304 0 0 29,808 15,771 45,579 67,585,493 67,585,493 8,787 8,787 5,282,135 5,600 541,965 11,447,392 0 17,277,092 0 0 85,609 3,406 85,425 42,621 3,356,448 72,873 3,646,382 176,590 0 14,229 210,946 9,060 850 411,675 761 70 19,164
0.31 5.41 0.01 0.00 5.74 0.00 0.00 0.00 0.00 0.00 2.89 2.89 0.00 0.00 0.23 0.00 0.02 0.49 0.00 0.74 0.00 0.00 0.00 0.00 0.00 0.00 0.14 0.00 0.16 0.01 0.00 0.00 0.01 0.00 0.00 0.02 0.00 0.00 0.00
2012 VALUE % SHARE 15,633,475 558,441 785,178 9,700 17,284,640 44,493 838,800 29,906 0 913,199 45,214,501 45,214,501 20,958 20,958 6,495,483 0 0 85,319 6,600,000 13,180,802 41,544 2,450 2,255 0 0 16,689 3,637,737 0 3,700,675 458,237 379,370 13,705 1,023,607 81,753 0 1,956,672 0 0 262,442
0.80 0.03 0.04 0.00 0.88 0.00 0.04 0.00 0.00 0.05 2.31 2.31 0.00 0.00 0.33 0.00 0.00 0.00 0.34 0.67 0.00 0.00 0.00 0.00 0.00 0.00 0.19 0.00 0.19 0.02 0.02 0.00 0.05 0.00 0.00 0.10 0.00 0.00 0.01
% CHANGE (54.20) 22,547.93 (69.70) (99.09) 676.49 (100.00) (100.00) (0.33) (95.01) 49.48 49.48 (58.07) (58.07) (18.68)
13,317.17 (100.00) 31.08 (100.00) (100.00) 3,696.41
155.38 (7.73) (1.47) (61.46) (100.00) 3.82 (79.39) (88.92) (78.96)
(92.70)
PRODUCT GROUP PERSONAL CARE Total PHARMACEUTICALS
SUB GROUP
SUB SUB GROUP
Goods /Supplies Medicaments
Suture /Reagent Specialised
PHARMACEUTICALS Total PHOTOGRAPHY
Supplies /Accessories
Misc Paper /Plates /Films
PHOTOGRAPHY Total PROCESSED FOOD
Cereals /Flours
Meal /Powder /Flake /Pellet Misc Pasta /Noodle Bar /Block /Slab Misc
Cocoa Coconut Confectionery Food Ingredients Fruits & Extracts
Meat /Meat Preparation Sauce /Spread Seasonings /Condiments Soup /Broth Sugar /Sweeteners Vegetables PROCESSED FOOD Total PULPS /FIBERS PULPS /FIBERS Total RUBBER RUBBER Total RUBBER MANUFACTURES
Misc Drained /Glazed /Crystallized Dried Frozen Jam /Jellie /Marmalade Juices & Concentrates Prepared /Preserved Puree Misc Misc Mixed Seasonings & Condiments Table Salt Misc Muscovado Drained /Glazed /Crystallized Prepared /Preserved
Natural
Abaca Misc
Natural Natural /Synthetic
Standard
Conveyor /Transmission Belt Page 7 of 9
2013 VALUE % SHARE 19,995 1,460 0 1,460 18,986 20,318 39,304 178,715 81,614 20,340 4,408 0 9,197,549 449,195 0 10,467,605 1,172,054 167,030 52,130 697,195 4,148,573 50,269 48,888 4,180 0 2,000 0 214,969 0 0 18,862 26,975,576 836,061 875,143 1,711,204 0 0 0 0
0.00 0.00 0.00 0.00 0.00 0.00 0.00 0.01 0.00 0.00 0.00 0.00 0.39 0.02 0.00 0.45 0.05 0.01 0.00 0.03 0.18 0.00 0.00 0.00 0.00 0.00 0.00 0.01 0.00 0.00 0.00 1.15 0.04 0.04 0.07 0.00 0.00 0.00 0.00
2012 VALUE % SHARE 262,442 0 535,485 535,485 22,228 0 22,228 201,740 0 6,846 0 51,780 8,507,675 10,137 121,792 17,635 2,077,824 347,802 8,303 541,482 1,033,002 79,540 0 0 1,550 0 700 119,318 322,941 7,482 0 13,457,549 541,757 226,100 767,857 34,337 56 34,393 342
0.01 0.00 0.03 0.03 0.00 0.00 0.00 0.01 0.00 0.00 0.00 0.00 0.43 0.00 0.01 0.00 0.11 0.02 0.00 0.03 0.05 0.00 0.00 0.00 0.00 0.00 0.00 0.01 0.02 0.00 0.00 0.69 0.03 0.01 0.04 0.00 0.00 0.00 0.00
% CHANGE (92.38) (100.00) (99.73) (14.59) 76.82 (11.41) 197.11 (100.00) 8.11 4,331.24 (100.00) 59,256.99 (43.59) (51.98) 527.85 28.76 301.60 (36.80)
(100.00) (100.00) 80.16 (100.00) (100.00) 100.45 54.32 287.06 122.85 (100.00) (100.00) (100.00) (100.00)
PRODUCT GROUP
SUB GROUP
SUB SUB GROUP
Misc Tube /Pipe RUBBER MANUFACTURES Total SEAWEEDS SEAWEEDS Total SOAP /DETERGENT SOAP /DETERGENT Total SPECIAL TRANSACTIONS
Consignment
Clothing Articles Jewellery Misc
Metal Misc Replacement/Returned Temporary Import /Export SPECIAL TRANSACTIONS Total STATIONERY
STATIONERY Total TIMEPIECES TIMEPIECES Total TOBACCO
Misc Paper Printed Matter Publications Ribbons
Books
Clock Watch Cigar /Cheroot /Cigarillo Leaves
Dried Misc Rolled
Misc TOBACCO Total TOYS
TOYS Total TRANSPORT
Dolls Misc Puzzle /Constructional Scale Models Aviation /Aerospace Land
Bicycles /Parts Motor Vehicle Parts Motor Vehicles Page 8 of 9
2013 VALUE % SHARE
2012 VALUE % SHARE
1,440,744 1,882 1,442,626 1,000 1,000 5,798 5,798 70,252 0 83,423,194 0 319,253 4,612,931 4,306,474 92,732,104 12,829 407,410 93,205 614 780 514,838 4,735 45,309 50,044 632,078 0 3,335,248 664,770 0 4,632,096 0 223,413 52,325 1,449,945 1,725,683 17,061,975 1,584,895 219,233,390 765,056
317,232 72 317,646 104,000 104,000 0 0 2,592,561 13,594 232,675,431 69,360 4,034,106 14,152,938 5,692,300 259,230,290 32,130 146,999 506,536 10,815 0 696,480 2,337 1,878 4,215 349,027 806,225 140,442 744 35,604 1,332,042 52,072 183,104 1,618,370 2,745,459 4,599,005 0 979,256 171,938,451 0
0.06 0.00 0.06 0.00 0.00 0.00 0.00 0.00 0.00 3.57 0.00 0.01 0.20 0.18 3.96 0.00 0.02 0.00 0.00 0.00 0.02 0.00 0.00 0.00 0.03 0.00 0.14 0.03 0.00 0.20 0.00 0.01 0.00 0.06 0.07 0.73 0.07 9.37 0.03
0.02 0.00 0.02 0.01 0.01 0.00 0.00 0.13 0.00 11.89 0.00 0.21 0.72 0.29 13.25 0.00 0.01 0.03 0.00 0.00 0.04 0.00 0.00 0.00 0.02 0.04 0.01 0.00 0.00 0.07 0.00 0.01 0.08 0.14 0.24 0.00 0.05 8.79 0.00
% CHANGE 354.16 2,513.89 354.16 (99.04) (99.04)
(97.29) (100.00) (64.15) (100.00) (92.09) (67.41) (24.35) (64.23) (60.07) 177.15 (81.60) (94.32) (26.08) 102.61 2,312.62 1,087.28 81.10 (100.00) 2,274.82 89,250.81 (100.00) 247.74 (100.00) 22.01 (96.77) (47.19) (62.48) 61.85 27.51
PRODUCT GROUP
SUB GROUP
SUB SUB GROUP Motorcycle Parts Motorcycles Trailers /Parts
Maritime TRANSPORT Total TWINES /CORDAGES /NETS TWINES /CORDAGES /NETS Total
Page 9 of 9
2013 VALUE % SHARE
2012 VALUE % SHARE
2,345 178,154 1,043,947 1,822,117 241,691,879 161,962 161,962
201,974 47,414 2,424,692 171,036,837 346,628,624 243,956 243,956
0.00 0.01 0.04 0.08 10.33 0.01 0.01
0.01 0.00 0.12 8.74 17.72 0.01 0.01
% CHANGE (98.84) 275.74 (56.95) (98.93) (30.27) (33.61) (33.61)