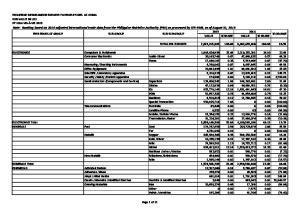
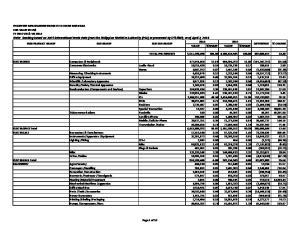
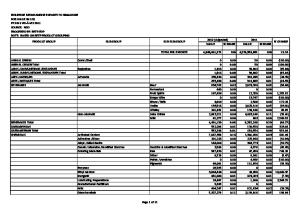
PHILIPPINE MERCHANDISE EXPORTS TO UNITED STATES OF AMERICA FOB VALUE IN US$ FY 2013 VIS-À-VIS 2012 SOURCE: PSA PROCESSED BY: DTI-EMB
Note: Based on adjusted and final 2013 international trade data from the Philippine Statistics Authority (PSA) as processed by DTI-EMB, as of June 10, 2014 PRODUCT GROUP
SUB GROUP
SUB SUB GROUP TOTAL PHL EXPORTS
ANIMAL /PLANT ANIMAL /PLANT Total ANIMAL ORIGIN ANIMAL ORIGIN Total ARMS /AMMUNITIONS /EXPLOSIVES ARMS /AMMUNITIONS /EXPLOSIVES Total ARTS /ANTIQUES ARTS /ANTIQUES Total BEVERAGES
Coral /Shell Misc Arms /Ammunitions Explosives Antiques /Collections Artworks Alcoholic
Non-Alcoholic
BEVERAGES Total CARRAGEENAN CARRAGEENAN Total CHEMICALS
Activated Carbon Adhesives /Glues Alkyd /Allied Resins Casein /Albumins /Modified Starches Coloring Materials
Beer Fruit Spirits Misc Rhum /Tafia Whisky Bottled Water Juice Drinks Misc Salabat
Dextrins & Modified Starches Gelatin & Derivatives Inks Other Paints /Varnishes Page 1 of 13
2013 VALUE % SHARE
2012 % CHANGE VALUE % SHARE
8,324,490,022
100.00
7,417,516,130
100.00
83,740 83,740 4,067,844 188,098 4,255,942 46,603,606 0 46,603,606 18,006 6,285,955 6,303,961 222,068 33,152 0 34,098 19,614 190,615 236,386 140,895 58,498 935,326 47,466,507 47,466,507 10,755,556 661,980 328,484 77,145 3,287 4,261,522 113,964 515,635
0.00 0.00 0.05 0.00 0.05 0.56 0.00 0.56 0.00 0.08 0.08 0.00 0.00 0.00 0.00 0.00 0.00 0.00 0.00 0.00 0.01 0.57 0.57 0.13 0.01 0.00 0.00 0.00 0.05 0.00 0.01
0 0 1,487,504 57,405 1,544,909 30,679,132 678 30,679,810 37,134 2,161,227 2,198,361 868,130 0 23,400 353 0 1,257 373,596 10,335 29,570 1,306,641 38,446,137 38,446,137 4,825,870 6,522 0 63,762 531 1,322,343 0 32,526
0.00 0.00 0.02 0.00 0.02 0.41 0.00 0.41 0.00 0.03 0.03 0.01 0.00 0.00 0.00 0.00 0.00 0.01 0.00 0.00 0.02 0.52 0.52 0.07 0.00 0.00 0.00 0.00 0.02 0.00 0.00
12.23
173.47 227.67 175.48 51.91 (100.00) 51.90 (51.51) 190.85 186.76 (74.42) (100.00) 9,559.49 15,064.28 (36.73) 1,263.28 97.83 (28.42) 23.46 23.46 122.87 10,049.95 20.99 519.02 222.27 1,485.30
PRODUCT GROUP
SUB GROUP
SUB SUB GROUP Pigments
Industrial Gases Inorganic Lubricating Preparations Manufactured Fertilizers Misc Oleochemicals Organic Pest Control /Bio-Security Plastic
Disinfectants Insecticides Other Primary Form
Pyrotechnics Surfactants CHEMICALS Total COCONUT
COCONUT Total CONSTRUCTION MATERIALS
Coir Copra Dust /Peat Shell Aggregates Bricks /Tiles Builders' Woodwork Cement Marble Tile /Slab Metal Misc Plastic
Misc Tube /Pipe /Fitting Other Pipes /Fittings Tiles /Floorings
Prefab Building Sanitarywares /Bathroom Fixtures CONSTRUCTION MATERIALS Total ELECTRICALS
Generators & Transformers Instruments /Apparatus /Equipment Lighting /Fitting
CFL-I Misc Plugs & Sockets Page 2 of 13
2013 VALUE % SHARE
2012 % CHANGE VALUE % SHARE
505,615 18,062 11,437,637 8,103 19,952 1,081,744 4,548,881 26,383,255 112,595 105,455 577,601 6,702,644 1,826,791 47,791,937 117,837,845 1,473,970 25,300 115,585 1,733,736 3,348,591 198,030 189,853 2,054,590 25,179,559 1,525,732 1,791,090 78,687,636 2,366,006 3,633 2,640,033 2,769 3,782,661 449,761 118,871,353 38,906,052 21,621,540 753 150,211,257 145,525
478,726 19,760 8,431,376 91,715 3,632 168,855 20,668,534 119,597 5,000 0 597,180 40,952,523 0 57,923,197 135,711,649 24,215 0 139,536 387,629 551,380 165,811 36,409 2,557,299 10,424,679 1,123,446 238,038 191,146,323 3,857,001 2,960 2,246,976 0 953,502 604,183 213,356,627 66,034,478 25,566,944 0 97,802,641 120,863
0.01 0.00 0.14 0.00 0.00 0.01 0.05 0.32 0.00 0.00 0.01 0.08 0.02 0.57 1.42 0.02 0.00 0.00 0.02 0.04 0.00 0.00 0.02 0.30 0.02 0.02 0.95 0.03 0.00 0.03 0.00 0.05 0.01 1.43 0.47 0.26 0.00 1.80 0.00
0.01 0.00 0.11 0.00 0.00 0.00 0.28 0.00 0.00 0.00 0.01 0.55 0.00 0.78 1.83 0.00 0.00 0.00 0.01 0.01 0.00 0.00 0.03 0.14 0.02 0.00 2.58 0.05 0.00 0.03 0.00 0.01 0.01 2.88 0.89 0.34 0.00 1.32 0.00
5.62 (8.59) 35.66 (91.17) 449.34 540.63 (77.99) 21,960.13 2,151.90 (3.28) (83.63) (17.49) (13.17) 5,987.01 (17.16) 347.27 507.31 19.43 421.45 (19.66) 141.54 35.81 652.44 (58.83) (38.66) 22.74 17.49 296.71 (25.56) (44.29) (41.08) (15.43) 53.59 20.40
PRODUCT GROUP
SUB GROUP
SUB SUB GROUP
Misc Wires /Cables ELECTRICALS Total ELECTRONICS
Computers & Peripherals Consumer Electronics Measuring /Checking Instruments Office Equipment Scientific /Laboratory Apparatus Security /Safety /Control Apparatus Semiconductors (Components and Devices)
Telecommunications
ELECTRONICS Total FASHION ACCESSORIES
Gloves /Mittens Handbags /Belts Hats /Headgears Jewellery Misc
Travelgoods
Audio Visual Home
Capacitors Diodes ICs PCBs Resistors Special Transaction Facsimile Landline Phone Mobile /Cellular Phone Transmission /Radar Fashion Sport /Work
Costume Precious Article /Accessory Eyewear Feather Article Hand-Screens /Fans Lighters /Pipes Safety /Protective Gear Umbrella /Stick /Whip Wigs /Toupees Misc Sport Bags Trunks /Cases /Satchels
FASHION ACCESSORIES Total Page 3 of 13
2013 VALUE % SHARE 714,176,253 11,020,324 936,081,704 571,223,012 56,988,542 15,673,838 6,898,671 20,446,265 112,983,332 5,001,945 16,022,991 286,489,628 721,555,209 50,725,903 2,412,460 122,508,799 1,277,351 48,069,773 93,336,782 92,609,959 2,224,224,460 14,132,890 42,124,295 44,405,945 6,887,751 4,447,312 7,405,495 1,732,279 126,777,188 39,736 6,808 599,405 13,789 0 252,115 11,215,964 41,798,117 1,277,106 303,116,195
8.58 0.13 11.24 6.86 0.68 0.19 0.08 0.25 1.36 0.06 0.19 3.44 8.67 0.61 0.03 1.47 0.02 0.58 1.12 1.11 26.72 0.17 0.51 0.53 0.08 0.05 0.09 0.02 1.52 0.00 0.00 0.01 0.00 0.00 0.00 0.13 0.50 0.02 3.64
2012 % CHANGE VALUE % SHARE 513,973,428 10,207,532 713,705,886 424,306,648 15,742,998 15,349,056 29,312,530 12,466,200 62,108,406 300 8,329,056 372,220,639 579,819,098 11,888,761 213,014 201,980,403 4,330,852 171,975,021 120,207,580 66,278,266 2,096,528,828 8,520,702 28,062,570 16,728,932 3,448,529 5,702,594 7,972,650 839,202 55,194,760 18,274 23,032 1,143,599 10,717 2,211 705,711 16,846,454 6,646,279 289,221 152,155,437
6.93 38.95 0.14 7.96 9.62 31.16 5.72 34.63 0.21 261.99 0.21 2.12 0.40 (76.47) 0.17 64.01 0.84 81.91 0.00 ########## 0.11 92.37 5.02 (23.03) 7.82 24.44 0.16 326.67 0.00 1,032.54 2.72 (39.35) 0.06 (70.51) 2.32 (72.05) 1.62 (22.35) 0.89 39.73 28.26 6.09 0.11 65.87 0.38 50.11 0.23 165.44 0.05 99.73 0.08 (22.01) 0.11 (7.11) 0.01 106.42 0.74 129.69 0.00 117.45 0.00 (70.44) 0.02 (47.59) 0.00 28.66 0.00 (100.00) 0.01 (64.28) 0.23 (33.42) 0.09 528.90 0.00 341.57 2.05 99.21
PRODUCT GROUP FLOWER /PLANT
SUB GROUP Live
SUB SUB GROUP Misc Orchid
Misc FLOWER /PLANT Total FOOTWEAR
FOOTWEAR Total FOREST-BASED
Leather Non-Leather Parts /Supplies /Accessories Slippers /Sandals Special Use Sports Fibreboard Fuel Wood /Charcoal Hoopwood /Pole /Stick Lumber Misc Non-Wood Particle Board Plywood /Veneer Pulpwood Rough Wood
Veneer Sheet /Slat FOREST-BASED Total FRESH FOOD
Cereals
Cocoa Beans Coconut Coffee Beans
Fruits
Baulks Misc Pit-props Misc Corn Misc Rice Misc Arabica Excelsa Liberica Robusta Banana Mango Misc Papaya Pineapple Page 4 of 13
2013 VALUE % SHARE 47,319 0 788,883 836,202 19,379 1,672 38,140 111,443 77,117 15,595 263,346 649,248 21,961 0 5,524,142 1,273,653 201,633 100,000 401,536 83,218 0 23,790 85,852 95,854 8,460,887 0 568,517 28,158 0 258,833 2,400 0 0 0 33,355,550 1,384,489 75,517 70,655 3,251,971
0.00 0.00 0.01 0.01 0.00 0.00 0.00 0.00 0.00 0.00 0.00 0.01 0.00 0.00 0.07 0.02 0.00 0.00 0.00 0.00 0.00 0.00 0.00 0.00 0.10 0.00 0.01 0.00 0.00 0.00 0.00 0.00 0.00 0.00 0.40 0.02 0.00 0.00 0.04
2012 % CHANGE VALUE % SHARE 59,271 3,114 706,924 769,309 6,093 6,952 0 52,110 5,704 30,844 101,703 781,770 15,400 246 358,431 1,653,624 130,317 0 431,968 98,526 28,306 0 40,890 0 3,539,478 74,148 54 56,719 9,000 309,795 4,827 4,185 1,140 8,547 2,663,343 82,806 84,190 0 68,315
0.00 (20.17) 0.00 (100.00) 0.01 11.59 0.01 8.70 0.00 218.05 0.00 (75.95) 0.00 0.00 113.86 0.00 1,251.98 0.00 (49.44) 0.00 158.94 0.01 (16.95) 0.00 42.60 0.00 (100.00) 0.00 1,441.20 0.02 (22.98) 0.00 54.73 0.00 0.01 (7.04) 0.00 (15.54) 0.00 (100.00) 0.00 0.00 109.96 0.00 0.05 139.04 0.00 (100.00) 0.00 ########## 0.00 (50.36) 0.00 (100.00) 0.00 (16.45) 0.00 (50.28) 0.00 (100.00) 0.00 (100.00) 0.00 (100.00) 0.04 1,152.39 0.00 1,571.97 0.00 (10.30) 0.00 0.00 4,660.26
PRODUCT GROUP
SUB GROUP Meat /Meat Offal
Nuts Roots & Tubers Seeds Spices
Tea & Mate Vegetables
FRESH FOOD Total FURNITURE /FURNISHINGS
Furnishing Furniture
FURNITURE /FURNISHINGS Total GAMES /SPORTS
GAMES /SPORTS Total GARMENT /TEXTILE
Fishing /Hunting Games Sports
Apparel
Non-Apparel
SUB SUB GROUP Bovine Misc Poultry Swine Manioc, Arrowroot etc. Chili Misc Pepper Leguminous Misc Onion /Shallot Lamp /Lighting Matress / Cushion Indigenous Metal Parts /Supplies Plastic Special Purpose Stone Wood
Balls Gym / Athlete Misc Snow / Water Cotton Man-Made Other Silk /Vegetable Wool Fabric Made-Up Articles Page 5 of 13
2013 VALUE % SHARE
2012 % CHANGE VALUE % SHARE
0 2,086 773,256 969,725 82,845 405,057 0 250,519 3,495 76,171 23,660 1,996,167 15,877 25,488 43,620,436 6,006,096 752,596 12,913,632 6,249,143 2,403,436 3,980,098 14,415,548 4,899,608 62,146,068 113,766,225 8,042,945 68,242,613 6,281,624 1,863,341 0 350 84,430,873 329,253,010 471,943,156 28,590,787 94,030,546 39,127,464 17,276,688 16,017,712
70 0 91,692 73,194 7,220 886,163 19,035 1,012 35,769 1,094 21,963 525 39,925 0 4,544,731 7,461,027 470,248 10,445,615 4,868,812 1,662,775 1,308,291 7,912,196 3,848,511 47,291,788 85,269,263 5,788,317 46,995,168 5,896,320 390,359 55,536 23,461 59,149,161 358,929,296 364,607,803 20,650,680 139,074,955 30,760,067 11,250,386 9,029,222
0.00 0.00 0.01 0.01 0.00 0.00 0.00 0.00 0.00 0.00 0.00 0.02 0.00 0.00 0.52 0.07 0.01 0.16 0.08 0.03 0.05 0.17 0.06 0.75 1.37 0.10 0.82 0.08 0.02 0.00 0.00 1.01 3.96 5.67 0.34 1.13 0.47 0.21 0.19
0.00 (100.00) 0.00 0.00 743.32 0.00 1,224.87 0.00 1,047.44 0.01 (54.29) 0.00 (100.00) 0.00 24,654.84 0.00 (90.23) 0.00 6,862.61 0.00 7.73 0.00 380,122.29 0.00 (60.23) 0.00 0.06 859.80 0.10 (19.50) 0.01 60.04 0.14 23.63 0.07 28.35 0.02 44.54 0.02 204.22 0.11 82.19 0.05 27.31 0.64 31.41 1.15 33.42 0.08 38.95 0.63 45.21 0.08 6.53 0.01 377.34 0.00 (100.00) 0.00 (98.51) 0.80 42.74 4.84 (8.27) 4.92 29.44 0.28 38.45 1.87 (32.39) 0.41 27.20 0.15 53.57 0.12 77.40
PRODUCT GROUP
SUB GROUP
SUB SUB GROUP Yarn
GARMENT /TEXTILE Total GAS GAS Total GLASS MANUFACTURES
GLASS MANUFACTURES Total HEALTH SUPPLEMENTS HEALTH SUPPLEMENTS Total HOUSEWARES
Cast /Rolled Drawn Float /Polished Misc Rod /Tube
Artificial Flowers / Trees Basketworks Holiday Décor Misc Shellcraft Statuette Table /Kitchen
Ceramicware Cutlery Glassware Misc Utensil
Woodware HOUSEWARES Total INDUSTRIAL SCRAPS /PARINGS /WASTES
Chemical /Allied Waste Electric /Electrical Metal
Iron /Steel Misc
Misc Plastic INDUSTRIAL SCRAPS /PARINGS /WASTES Total LAC /GUM /RESIN /SAP LAC /GUM /RESIN /SAP Total LEATHER HIDE /SKIN LEATHER HIDE /SKIN Total LIVE ANIMALS
Further Prepared Tanned /Crusted Birds Breeding
Bovine /Equine
Misc Page 6 of 13
2013 VALUE % SHARE
2012 % CHANGE VALUE % SHARE
1,776,385 998,015,748 764,112 764,112 0 128,714 457,729 5,113,600 170,945 5,870,988 1,741,873 1,741,873 334,496 32,876,524 44,826,788 522,703 13,248,522 12,243,056 460,138 14,301 31,372 24,905,596 6,298,140 817,345 136,578,981 13,982 569 1,801,786 1,450,739 9,082 2,435,549 5,711,707 28,597 28,597 60,922 65,719 126,641 855 939,426
2,241,746 936,544,155 552,535 552,535 79,007 751 124,552 3,675,903 59,982 3,940,195 347,598 347,598 2,228,280 26,404,222 21,549,139 731,637 10,579,436 16,059,634 188,887 0 76,899 3,670,679 14,285,338 584,584 96,358,735 36,279 0 49,612 1,814,180 13,083 10,519 1,923,673 1,153 1,153 36,366 0 36,366 0 393,380
0.02 11.99 0.01 0.01 0.00 0.00 0.01 0.06 0.00 0.07 0.02 0.02 0.00 0.39 0.54 0.01 0.16 0.15 0.01 0.00 0.00 0.30 0.08 0.01 1.64 0.00 0.00 0.02 0.02 0.00 0.03 0.07 0.00 0.00 0.00 0.00 0.00 0.00 0.01
0.03 12.63 0.01 0.01 0.00 0.00 0.00 0.05 0.00 0.05 0.00 0.00 0.03 0.36 0.29 0.01 0.14 0.22 0.00 0.00 0.00 0.05 0.19 0.01 1.30 0.00 0.00 0.00 0.02 0.00 0.00 0.03 0.00 0.00 0.00 0.00 0.00 0.00 0.01
(20.76) 6.56 38.29 38.29 (100.00) 17,039.01 267.50 39.11 184.99 49.00 401.12 401.12 (84.99) 24.51 108.02 (28.56) 25.23 (23.77) 143.60 (59.20) 578.50 (55.91) 39.82 41.74 (61.46) 3,531.75 (20.03) (30.58) 23,053.81 196.92 2,380.23 2,380.23 67.52 248.24 138.81
PRODUCT GROUP
SUB GROUP Misc Non-Breeding
LIVE ANIMALS Total MACHINERY
MACHINERY Total MARINE /AQUACULTURE
Misc
Agro-Forestry Conveyors /Handling Excavation /Construction Extinguishing /Blasting /Spraying Garments /Footwear /Travelgoods Heating /Material Treatment Lathes Mechanical Machines /Apparatus Nuclear-Based Office Machines Parts /Tools /Accessories Power Generators Printing /Binding /Packaging Pumps /Compressors /Fans Refrigeration /Cooling /Freezing Rolling /Filtering Weighing Crustaceans
Dried /Salted /Smoked /in Brine Fish Eggs Fish Eggs/Sardines Fish Fillet /Meat Fresh /Chilled /Frozen Live Fish Milkfish Misc Molluscs Tilapia Tuna MARINE /AQUACULTURE Total MEDIA /ENTERTAINMENT
SUB SUB GROUP
Recorded
Crabs Rock Lobster /Crawfish Shrimps /Prawns
Fresh /Chilled /Frozen Misc Other Video Page 7 of 13
2013 VALUE % SHARE
2012 % CHANGE VALUE % SHARE
3,246,597 2,622,385 6,809,263 34,545,984 1,023,369 8,242,888 598,703 207,280 4,555,649 1,859,592 28,054,695 1,000 6,439,456 35,484,213 72,990,682 25,980,038 30,841,906 10,000 6,782,311 6,780 257,624,546 45,575,119 715,812 17,177,892 635,996 93,639 15,881,736 9,140,666 3,647,081 1,013,174 14,915,826 2,320,149 10,444,873 31,461,681 8,451,288 125,606,420 287,081,352 8,028 27,512
3,727,572 464,158 4,585,110 4,467,243 751,418 9,475,032 585,248 86,297 351,518 313,046 32,505,330 957 5,715,377 11,174,950 8,147 21,631,030 19,579,706 30,138 5,063,294 9,130 111,747,861 32,985,521 5,065 4,401,272 928,090 41,898 45,496,423 1,907,621 2,284,131 165,956 9,843,838 22,096 14,984,100 6,702,288 48,805,298 54,282,007 222,855,604 8,228 0
0.04 0.03 0.08 0.41 0.01 0.10 0.01 0.00 0.05 0.02 0.34 0.00 0.08 0.43 0.88 0.31 0.37 0.00 0.08 0.00 3.09 0.55 0.01 0.21 0.01 0.00 0.19 0.11 0.04 0.01 0.18 0.03 0.13 0.38 0.10 1.51 3.45 0.00 0.00
0.05 (12.90) 0.01 464.98 0.06 48.51 0.06 673.32 0.01 36.19 0.13 (13.00) 0.01 2.30 0.00 140.19 0.00 1,195.99 0.00 494.03 0.44 (13.69) 0.00 4.49 0.08 12.67 0.15 217.53 0.00 895,820.98 0.29 20.11 0.26 57.52 0.00 (66.82) 0.07 33.95 0.00 (25.74) 1.51 130.54 0.44 38.17 0.00 14,032.52 0.06 290.29 0.01 (31.47) 0.00 123.49 0.61 (65.09) 0.03 379.17 0.03 59.67 0.00 510.51 0.13 51.52 0.00 10,400.31 0.20 (30.29) 0.09 369.42 0.66 (82.68) 0.73 131.40 3.00 28.82 0.00 (2.43) 0.00
PRODUCT GROUP
SUB GROUP Unrecorded
MEDIA /ENTERTAINMENT Total MEDICAL SUPPLY /DEVICE MEDICAL SUPPLY /DEVICE Total MEDICINAL PLANTS /SEEDS /FRUITS MEDICINAL PLANTS /SEEDS /FRUITS Total METAL MANUFACTURES
Aluminum Copper Iron /Steel /Alloy
SUB SUB GROUP Card /Disc Tape
Bolts /Nuts Misc
Misc Nickel Safes /Locks METAL MANUFACTURES Total MINERALS
Fuel Metallic
Non-Metallic MINERALS Total MISC. INDUSTRIAL PRODUCTS MISC. INDUSTRIAL PRODUCTS Total MUSICAL INSTRUMENTS MUSICAL INSTRUMENTS Total OILS /FATS /WAXES
Misc String Animal Coconut Essential
Inedible Vegetable
OILS /FATS /WAXES Total PACKAGING
Coal Gold /Silver Misc Nickel Milestone /Grindstone Misc
Land Citrus Misc Non-Citrus Misc Olive Palm /Palm Kernel /Babassu Soya
Fiber Textile Page 8 of 13
2013 VALUE % SHARE
2012 % CHANGE VALUE % SHARE
40,249 1,078,563 1,154,352 38,937,011 38,937,011 23,157 23,157 4,510,874 487,604 7,662,631 5,276,973 5,103,530 1,337 39,114,997 62,157,946 5,661,704 11,880 3,874,151 71,169,000 326,699 576,709 81,620,143 43,425,320 43,425,320 38,823 50,500 89,323 1,458,437 458,784,071 72,654 554,817 9,989 15,865,123 7,459,264 1,961 3,968,311 25,981,064 514,155,691 20,460
733 0 8,961 42,877,763 42,877,763 3,904 3,904 2,007,040 2,065,646 5,936,472 3,987,114 8,624,371 225 20,987,557 43,608,425 0 767,806 1,233,300 10,398,862 2,234,028 263 14,634,259 84,543,859 84,543,859 100,101 136,420 236,521 3,539,691 459,320,289 0 131,920 24,853 0 0 0 13,219,992 5,660,141 481,896,886 164,045
0.00 0.01 0.01 0.47 0.47 0.00 0.00 0.05 0.01 0.09 0.06 0.06 0.00 0.47 0.75 0.07 0.00 0.05 0.85 0.00 0.01 0.98 0.52 0.52 0.00 0.00 0.00 0.02 5.51 0.00 0.01 0.00 0.19 0.09 0.00 0.05 0.31 6.18 0.00
0.00 5,391.00 0.00 0.00 12,781.96 0.58 (9.19) 0.58 (9.19) 0.00 493.16 0.00 493.16 0.03 124.75 0.03 (76.39) 0.08 29.08 0.05 32.35 0.12 (40.82) 0.00 494.22 0.28 86.37 0.59 42.54 0.00 0.01 (98.45) 0.02 214.13 0.14 584.39 0.03 (85.38) 0.00 219,180.99 0.20 457.73 1.14 (48.64) 1.14 (48.64) 0.00 (61.22) 0.00 (62.98) 0.00 (62.23) 0.05 (58.80) 6.19 (0.12) 0.00 0.00 320.57 0.00 (59.81) 0.00 0.00 0.00 0.18 (69.98) 0.08 359.02 6.50 6.69 0.00 (87.53)
PRODUCT GROUP
SUB GROUP Glass Metal
SUB SUB GROUP
Aluminum Copper /Tin Iron /Steel
Paper Plastic Rubber Wood PACKAGING Total PAPER MANUFACTURES
PAPER MANUFACTURES Total PERSONAL CARE
PERSONAL CARE Total PET FOOD /ANIMAL FEEDS
PET FOOD /ANIMAL FEEDS Total PETROLEUM
PETROLEUM Total PHARMACEUTICALS
Coated Corrugated Graphic Misc Not Further Worked Beauty /Make-up Grooming Essentials Haircare Misc Perfume /Scent Animal Feeding Stuff Starch Residues Vegetable Fats /Oils /Oil Cake Residues Vegetable Materials Residues /Wastes Lubricant Misc Solvent Goods /Supplies Medicaments Therapeutic /Diagnostic Use Waste
PHARMACEUTICALS Total PHOTOGRAPHY
Supplies /Accessories
Bandage /Poultice /Dressing Suture /Reagent Specialised Vitamin Misc
Misc Paper /Plates /Films Page 9 of 13
2013 VALUE % SHARE 2,214,476 1,224,414 115,379 2,611,110 912,558 28,685,458 1,425 108,187 35,893,467 5,847,623 8,660 0 4,704,362 771,043 11,331,688 1,488,074 160,584 6,098,108 5,209,323 633,569 13,589,658 89,402 714,471 21,308,748 23,602 22,136,223 216,301 49,978,991 15,032,133 65,227,425 154,546 1,273,227 574,988 127,396 0 906,856 3,037,013 404,700 39,988
0.03 0.01 0.00 0.03 0.01 0.34 0.00 0.00 0.43 0.07 0.00 0.00 0.06 0.01 0.14 0.02 0.00 0.07 0.06 0.01 0.16 0.00 0.01 0.26 0.00 0.27 0.00 0.60 0.18 0.78 0.00 0.02 0.01 0.00 0.00 0.01 0.04 0.00 0.00
2012 % CHANGE VALUE % SHARE 216,907 3,232,915 14,236 354,183 845,810 15,843,029 0 978 20,672,103 8,145,958 210 768 3,330,215 1,386,108 12,863,259 942,853 120,977 626,656 6,087,169 395,025 8,172,680 42,030 443,079 0 0 485,109 0 0 0 0 527,497 778,516 59,333 57,512 600 277,490 1,700,948 132,040 2,041
0.00 0.04 0.00 0.00 0.01 0.21 0.00 0.00 0.28 0.11 0.00 0.00 0.04 0.02 0.17 0.01 0.00 0.01 0.08 0.01 0.11 0.00 0.01 0.00 0.00 0.01 0.00 0.00 0.00 0.00 0.01 0.01 0.00 0.00 0.00 0.00 0.02 0.00 0.00
920.93 (62.13) 710.47 637.22 7.89 81.06 10,962.07 73.63 (28.21) 4,023.81 (100.00) 41.26 (44.37) (11.91) 57.83 32.74 873.12 (14.42) 60.39 66.28 112.71 61.25
4,463.14
(70.70) 63.55 869.09 121.51 (100.00) 226.81 78.55 206.50 1,859.24
PRODUCT GROUP PHOTOGRAPHY Total PROCESSED FOOD
SUB GROUP
Cereals /Flours
Cocoa Coconut Coffee
Confectionery
Dairy
Food Ingredients Fruits & Extracts
Margarine /Coagulated Veg Oil Meat /Meat Preparation Nuts Roots & Tubers Sauce /Spread
SUB SUB GROUP
Biscuit /Waffle /Wafer Bread /Cake /Pastry Flour Malt /Starch /Wheat Gluten Meal /Powder /Flake /Pellet Misc Mixes /Dough Pasta /Noodle Bar /Block /Slab Misc Decaffeinated Extracts /Substitutes Instant Candy Chocolate Misc Butter Cheese /Curd Ice Cream Milk /Cream Whey Yogurt Drained /Glazed /Crystallized Dried Frozen Jam /Jellie /Marmalade Juices & Concentrates Prepared /Preserved Provisionally Preserved Puree Misc Sausage
Misc Page 10 of 13
2013 VALUE % SHARE
2012 % CHANGE VALUE % SHARE
444,688 547,882 2,708,695 314,975 4,228 4,347,879 12,940,325 22,000 8,198,333 1,522,468 796,354 55,260,615 0 42,056 117,986 701,475 4,168,765 2,880,148 66,456 384,727 1,492,829 17,435,285 8,881 0 709,956 1,770,498 22,276,814 2,800,787 5,214,595 74,004,528 182,558,417 71,108 1,699,305 7,205 82,571 100,608 820,716 1,423 5,139,691
134,081 1,226,894 2,888,800 8,835 3,184 2,116,872 6,969,070 216,067 7,662,057 44,357 903,799 75,313,734 691 176,834 19,521 501,958 215,577 741,152 58,505 126,295 667,320 744,948 0 64,689 682,346 41,802 30,153,941 792,536 4,948,102 58,834,717 156,170,985 158,110 1,560,153 63,307 493,211 400,489 888,438 0 4,988,123
0.01 0.01 0.03 0.00 0.00 0.05 0.16 0.00 0.10 0.02 0.01 0.66 0.00 0.00 0.00 0.01 0.05 0.03 0.00 0.00 0.02 0.21 0.00 0.00 0.01 0.02 0.27 0.03 0.06 0.89 2.19 0.00 0.02 0.00 0.00 0.00 0.01 0.00 0.06
0.00 0.02 0.04 0.00 0.00 0.03 0.09 0.00 0.10 0.00 0.01 1.02 0.00 0.00 0.00 0.01 0.00 0.01 0.00 0.00 0.01 0.01 0.00 0.00 0.01 0.00 0.41 0.01 0.07 0.79 2.11 0.00 0.02 0.00 0.01 0.01 0.01 0.00 0.07
231.66 (55.34) (6.23) 3,465.08 32.79 105.39 85.68 (89.82) 7.00 3,332.31 (11.89) (26.63) (100.00) (76.22) 504.41 39.75 1,833.77 288.60 13.59 204.63 123.71 2,240.47 (100.00) 4.05 4,135.44 (26.12) 253.40 5.39 25.78 16.90 (55.03) 8.92 (88.62) (83.26) (74.88) (7.62) 3.04
PRODUCT GROUP
SUB GROUP Seasonings /Condiments
Sherbet /Sorbet /Water Ice Soup /Broth Sugar /Sweeteners
Tea /Mate Vegetables
PROCESSED FOOD Total PULPS /FIBERS
Natural
SUB SUB GROUP Misc Mixed Seasonings & Condiments Table Salt Vinegar /Substitutes
Cane /Beet Sugar Misc Molasses Muscovado Dried Fresh /Chilled /Frozen Prepared /Preserved Provisionally Preserved Abaca Misc Pulp
Synthetic PULPS /FIBERS Total RUBBER RUBBER Total RUBBER MANUFACTURES RUBBER MANUFACTURES Total SEAWEEDS SEAWEEDS Total SEEDS /GRAINS SEEDS /GRAINS Total SOAP /DETERGENT SOAP /DETERGENT Total SPECIAL TRANSACTIONS
Natural
Misc Standard
Misc Tube /Pipe
Oleaginous Sowing
Consignment
Clothing Articles Footwear Jewellery Misc
Metal Page 11 of 13
2013 VALUE % SHARE
2012 % CHANGE VALUE % SHARE
1,443,262 1,040,912 14,316 566,611 0 682,596 86,179,977 1,994,110 196,495 27,008 196,945 105,690 701,522 43,699 1,159 504,414,886 5,446,342 2,248,627 0 45,325 7,740,294 2,575,534 1,142,391 3,717,925 4,965,555 3,825 4,969,380 9,803,137 9,803,137 0 10,877 10,877 32,097,876 32,097,876 14,038,703 0 378,343 185,940,951 2,594,639
2,702,640 2,739,548 241 1,070,736 54,922 540,280 61,052,765 878,468 0 51,801 62,289 67,442 766,624 327,672 27,413 431,190,260 4,330,027 275,808 348,554 47,887 5,002,276 1,709,285 0 1,709,285 2,537,504 241,308 2,778,812 4,463,026 4,463,026 20,399 9,646 30,045 807,646 807,646 66,017,867 33,709 27,327,428 453,991,022 7,365,235
0.02 0.01 0.00 0.01 0.00 0.01 1.04 0.02 0.00 0.00 0.00 0.00 0.01 0.00 0.00 6.06 0.07 0.03 0.00 0.00 0.09 0.03 0.01 0.04 0.06 0.00 0.06 0.12 0.12 0.00 0.00 0.00 0.39 0.39 0.17 0.00 0.00 2.23 0.03
0.04 0.04 0.00 0.01 0.00 0.01 0.82 0.01 0.00 0.00 0.00 0.00 0.01 0.00 0.00 5.81 0.06 0.00 0.00 0.00 0.07 0.02 0.00 0.02 0.03 0.00 0.04 0.06 0.06 0.00 0.00 0.00 0.01 0.01 0.89 0.00 0.37 6.12 0.10
(46.60) (62.00) 5,840.25 (47.08) (100.00) 26.34 41.16 127.00 (47.86) 216.18 56.71 (8.49) (86.66) (95.77) 16.98 25.78 715.29 (100.00) (5.35) 54.74 50.68 117.51 95.69 (98.41) 78.83 119.65 119.65 (100.00) 12.76 (63.80) 3,874.25 3,874.25 (78.73) (100.00) (98.62) (59.04) (64.77)
PRODUCT GROUP
SUB GROUP
SUB SUB GROUP
Misc Replacement/Returned Temporary Import /Export SPECIAL TRANSACTIONS Total STATIONERY
Misc Paper Pens /Pencils Printed Matter Publications
Pencils /Crayons Pens Books News /Magazines
Ribbons STATIONERY Total TIMEPIECES TIMEPIECES Total TOBACCO
Clock Watch Cigar /Cheroot /Cigarillo Leaves
Dried Misc Rolled
Misc TOBACCO Total TOYS
TOYS Total TRANSPORT
Dolls Misc Puzzle /Constructional Scale Models Wheeled Aviation /Aerospace Land
Bicycles /Parts Motor Vehicle Parts Motor Vehicles Motorcycle Parts Motorcycles Trailers /Parts Trains /Trams /Parts Work Trucks
Maritime TRANSPORT Total Page 12 of 13
2013 VALUE % SHARE
2012 % CHANGE VALUE % SHARE
2,067,107 28,928,937 3,752,981 237,701,661 130,112 691,327 1,270,021 250 330,048 184,651 34,210 7,674 2,648,293 34,681 88,272,887 88,307,568 5,682,666 1,072,860 3,243,954 5,032,391 2,029,208 17,061,079 2,023,881 1,346,128 390,236 4,278,125 0 8,038,370 57,930,249 1,471,666 672,422,154 125,609 3,122,796 700 283,432 2,247 0 7,696,219 743,055,072
10,916,117 27,187,089 8,499,214 601,337,681 2,112,878 2,743,360 630,655 0 55,830 202,062 33,064 311,358 6,089,207 2,794 87,906,214 87,909,008 427,807 7,102,771 2,053,117 3,285,587 57,239 12,926,521 1,198,678 756,302 765,886 3,555,164 2,058 6,278,088 3,545,277 34,381 603,822,848 35,701 2,572,900 100 136,443 8,000 400 3,524,899 613,680,949
0.02 0.35 0.05 2.86 0.00 0.01 0.02 0.00 0.00 0.00 0.00 0.00 0.03 0.00 1.06 1.06 0.07 0.01 0.04 0.06 0.02 0.20 0.02 0.02 0.00 0.05 0.00 0.10 0.70 0.02 8.08 0.00 0.04 0.00 0.00 0.00 0.00 0.09 8.93
0.15 0.37 0.11 8.11 0.03 0.04 0.01 0.00 0.00 0.00 0.00 0.00 0.08 0.00 1.19 1.19 0.01 0.10 0.03 0.04 0.00 0.17 0.02 0.01 0.01 0.05 0.00 0.08 0.05 0.00 8.14 0.00 0.03 0.00 0.00 0.00 0.00 0.05 8.27
(81.06) 6.41 (55.84) (60.47) (93.84) (74.80) 101.38 491.17 (8.62) 3.47 (97.54) (56.51) 1,141.27 0.42 0.45 1,228.32 (84.90) 58.00 53.17 3,445.15 31.99 68.84 77.99 (49.05) 20.34 (100.00) 28.04 1,534.01 4,180.46 11.36 251.84 21.37 600.00 107.73 (71.91) (100.00) 118.34 21.08
PRODUCT GROUP
SUB GROUP
SUB SUB GROUP
TWINES /CORDAGES /NETS TWINES /CORDAGES /NETS Total
2013 VALUE % SHARE 10,839,492 10,839,492
Page 13 of 13
0.13 0.13
2012 % CHANGE VALUE % SHARE 13,022,273 13,022,273
0.18 0.18
(16.76) (16.76)