ROLE
OF
AIR PRESSURE IN DRYING OF WEAKLY PERMEABLE MATERIALS
By Marc Mainguy,1 Olivier Coussy,2 and Ve´ronique Baroghel-Bouny3 ABSTRACT: Modeling of the drying of porous materials is often approached by assuming that the gas pressure of the vapor-air mixture remains constantly equal to the outer atmospheric pressure. Use of both experimental and theoretical results reveals that such an assumption is inadequate to account for the weight loss observed during the drying of weakly permeable materials. For such materials, the gas pressure cannot remain constant because no significant convective Darcean transport of the gas can actually occur. In contrast, the evaporation coupled with the diffusion of dry air generates a gas overpressure that propagates within the material and works actively toward a uniform vapor molar concentration. As a consequence, the diffusion of vapor becomes rapidly nonactive as a driving force of moisture transport. Paradoxically, the drying of weakly permeable materials is eventually achieved by the transport of moisture in its liquid form and its evaporation at the sample boundary in contact with the surrounding air. The analysis is carried out through a modeling of which the formulation is based upon macroscopic thermodynamic considerations. It involves a dry-air component and a water component, the liquid and the water-vapor phases being addressed separately.
INTRODUCTION In civil engineering, durability of cement-based materials and concrete structures mainly depends upon the evolution of their liquid-water and gaseous phases. The diffusion of aggressive agents does occur through the liquid-water phase. When their depths of penetration within the material is sufficient, aggressive agents such as chloride ions can induce a significant corrosion of the reinforcement of concrete structures, which can produce their failure [e.g., Hausmann (1967), Page and Treadaway (1982), and Raharinaivo et al. (1998)]. Aggressive agents can also diffuse through the gaseous phase as carbon dioxide, which causes carbonation of concrete [e.g., Papadakis et al. (1991), Saetta et al. (1993), and Chaussadent (1999)] and therefore increases risks of corrosion of the reinforcement. In addition, the decrease in liquid-water content is associated with strong capillary effects. The latter can induce a shrinkage or, alternatively, tensile stresses when this shrinkage is hindered [e.g., Bazˇant (1972), Wittmann (1973), and Lassabate`re (1994)]. These stresses can in turn provoke cracking and may modify significantly the material properties. Durability issues in civil engineering involve very long periods of time over which the main cause of change in liquidwater content is drying. The characterization of cement-based materials with respect to these issues requires a precise understanding of their drying processes and a good accuracy in the determination of their transport properties such as, in particular, their intrinsic permeability. However cement-based materials, and especially modern high-performance concrete, exhibit very low permeability values that are difficult to measure directly. Furthermore, the drying process of weakly permeable materials may strongly differ from that of more permeable materials and needs to be analyzed with adapted models. The aim of this paper is to analyze the drying process of materials exhibiting low permeability, such as cement-based materials. Therefore, this paper studies if the drying of weakly permeable 1 Res. Engr., Institut Franc¸ais du Pe´trole, 92852 Rueil-Malmaison Cedex, France. E-mail:
[email protected] 2 Res. Dir., Laboratoire Central des Ponts et Chausse´es, 75732 Paris Cedex 15, France. 3 Res. Engr., Laboratoire Central des Ponts et Chausse´es, 75732 Paris Cedex 15, France. Note. Associate Editor: Arup Maji. Discussion open until November 1, 2001. To extend the closing date one month, a written request must be filed with the ASCE Manager of Journals. The manuscript for this paper was submitted for review and possible publication on December 12, 1999; revised December 8, 2000. This paper is part of the Journal of Engineering Mechanics, Vol. 127, No. 6, June, 2001. 䉷ASCE, ISSN 0733-9399/01/0006-0582–0592/$8.00 ⫹ $.50 per page. Paper No. 22166.
582 / JOURNAL OF ENGINEERING MECHANICS / JUNE 2001
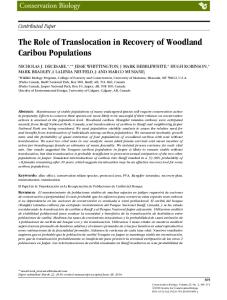
materials is mainly achieved by water evaporation within the sample followed by vapor diffusion toward the surrounding air (i.e., 1 ⫹ 2 in Fig. 1) or if the liquid water is transported to the boundary of the sample where it evaporates (i.e., 1⬘ ⫹ 2⬘ in Fig. 1). The analysis is carried out through a model involving dry-air and water-vapor components in gas phase and a pure liquid-water phase. The model is implemented in a finite-volume program, and the intrinsic permeability of cement-based materials is estimated from the comparison between experimental and numerical results of weight losses. The reliability of the analysis is based upon the ability of the model to accurately represent the experimental weight losses as well as moisture profiles. This paper also compares the model with a standard approach encountered for more permeable materials based on the assumption of a constant gas pressure. The difference between the two moisture transport modes associated to each approach (constant or nonconstant gas pressure) are underlined and explained. The drying of materials involves important heat transfers provided by the surrounding air to supply the latent heat of vaporization of water L required along the whole process. Consequently, isothermal drying can only occur when the process is mainly governed by the slowness of the humidity transport (Baggio et al. 1997). In fact, because of the high thermal conductivity of materials considered here compared with their low permeability, the characteristic time associated with the restoration of the initial temperature by heat exchange with the surrounding air is much smaller than the drying characteristic time d associated with isothermal transport of humidity. A rough linear approach (Coussy et al. 1998) yields an overestimation of the maximal decrease max of temperature, which
FIG. 1. Schematic Representation of Two Extreme Moisture Transport Mechanisms
can be expected during the drying process in the form max ⯝ ( /d) ⭈ (Ll /r C ), where r and C respectively stand for the overall mass density and specific heat of the material. Despite the high value of (Ll /r C ), the small value of ratio /d ensures that the decrease of temperature is actually negligible (<0.23 K, see Appendix I). In other words, isothermal drying means that the drying is only due to a thermodynamic imbalance between the external humidity and the humidity initially prevailing within the sample. The imbalance entails a diffusion process of the water vapor and of the dry air through the sample. Simultaneously, the liquid-vapor (isothermal) equilibrium in the surface zone, along with the lower external humidity, causes an evaporation of the liquid water at the boundary of the material. Consequently, this evaporation generates a liquid pressure gradient between the surface and the core of the sample, which induces an outgoing liquid-water flow. The process ends when the balance between the external and internal states within the whole sample is restored. For cement-based materials, the deformation of the solid skeleton does not significantly influence the drying process and will not be considered in what follows. This paper is organized in four parts. The first part derives the equations of isothermal drying from thermodynamic principles. The second part briefly describes drying tests and how the drying model can be numerically handled through the finite-volume method. Furthermore, material properties, as well as analytic expressions for the key parameters such as tortuosity, capillary pressure curve, and relative permeability, are provided for the tested cement-based materials. The intrinsic permeability is then evaluated from the analysis of the experimental weight-loss history. In the third part, the modeling reveals the existence of a gas overpressure, which plays an important role in the drying process of weakly permeable materials. Then, the moisture transport mechanisms are described and a simplified approach is proposed. In the last part, the modeling is compared with a standard diffusion equation based on the assumption of a constant gas pressure and the limits of the modeling are discussed. ISOTHERMAL DRYING MODEL
through which fluid flow occurs; and Sl = liquid-water saturation. Hence, l = Sl and g = (1 ⫺ Sl) represent the ratios of volume d⍀ occupied respectively by the liquid-water phase and the wet-air phase. Furthermore l→v denotes the rate of liquid-water mass changing into vapor per unit of volume d⍀ whereas vj is the velocity of component j = a or v of the gas phase; and vl is the velocity of the liquid phase. Finally note that the quantities mj ( j = a, v) and ml defined by mv = v (1 ⫺ Sl);
ma = a(1 ⫺ Sl);
ml = l Sl
represent the apparent volumetric mass of gaseous components j and of the liquid phase. Therefore (1) indicates that the change in water content in liquid or gaseous phase is due both to fluid flow and to possible phase change. Transparent Laws The law describing the transport of water vapor with respect to the air motion is Fick’s law, which first observed that the flux of a constituent through a liquid was experimentally proportional to the gradient of its concentration. The kinetics theory of gases has shown that an analogous law governs the free diffusion (i.e., out of any porous medium) of a constituent through a gaseous mixture. The reference velocities of a gaseous binary mixture may be either the molar-averaged velocity or the mass-averaged velocity. The molar-averaged velocity is defined by v cg = C1v1 ⫹ C2v2
(3)
where 1 = a and 2 = v in the present case; vj represents the velocity of constituent j (=1 or 2); and Cj represents its mole fraction (i.e., Cj = cj /cg, where cj = molar density of constituent j and cg = c1 ⫹ c2 = gas mixture molar density). According to the kinetics theory of gases, the diffusion of constituent j through the gaseous mixture is governed by Fick’s law as expressed by (de Groot and Mazur 1984; Taylor and Krishna 1993) cj(vj ⫺ v cg) = ⫺Dcg grad Cj
Mass Balance in Partially Saturated Porous Media
(2)
(4)
Alternatively the mass-averaged velocity is defined by
In this paper, the developments are implicitly based upon the existence of a representative elementary volume (Bear 1991) that makes possible an averaged macroscopic representation of the main phenomena involved in the drying process. Supposing the existence of such a representative elementary volume denoted by the macroscopic infinitesimal volume d⍀, the porous medium is viewed at the macroscopic level as the superposition of three continua, namely, a solid skeleton, assumed here to be rigid, a liquid-water phase (index l ), and a gas phase (index g). The latter is wet air and is constituted by water vapor (index v) and dry air (index a). At the macroscopic level, drying can then be described continuously in time and space by a set of partial differential equations. The mass balance equations for the liquid-water phase, water vapor, and dry air, respectively are
v g = E1v1 ⫹ E2v2
(5)
where Ej represents the mass fraction of constituent j in the gas mixture; i.e., Ej = j /g, where g = 1 ⫹ 2 stands for the mass density of the gas mixture. Analogously to (4), the diffusion of constituent j is governed by j (vj ⫺ v g) = ⫺Dg grad Ej
(6)
Eqs. (4) and (6) can be shown to be strictly equivalent when using the definitions of the molar- or the mass-averaged velocity. In fact, the diffusion process is obviously independent of any particular reference velocity and (4) for j = 1 or 2 reduces to the same equation reading (Taylor and Krishna 1993)
冉
冊
⭸ (l Sl) = ⫺div(Sl l vl) ⫺ l→v ⭸t
(1a)
D v2 ⫺ v1 = ⫺ grad C2 ⇔ C1C2
⭸ (v(1 ⫺ Sl)) = ⫺div((1 ⫺ Sl)vvv) ⫹ l→v ⭸t
(1b)
⭸ (a(1 ⫺ Sl)) = ⫺div((1 ⫺ Sl)ava) ⭸t
(1c)
which symmetrically describes the diffusion of one constituent through the other. The expression of the diffusion coefficient D can be derived from the kinetics theory of gases [see for instance Reid et al. (1987)]. For a mixture formed by water vapor and dry air, one adopts here the well-known expression derived by de Vries and Kruger (1966) and based upon both kinetics theory and experimental results
in which j = mass density of component j = a or v of the gas phase; cl = mass density of the liquid phase; = total porosity
D v1 ⫺ v2 = ⫺ grad C1 C1C2
(7)
JOURNAL OF ENGINEERING MECHANICS / JUNE 2001 / 583
D=
Dva pg
with Dva = 0.217patm
冉冊 T T0
1.88
(8)
in which D = diffusion coefficient of water vapor or dry air in wet air (cm2/s); T = temperature (K) (T0 = 273 K); and pg = gas pressure (Pa) ( patm = 101,325 Pa). Unlike Fick’s law, Darcy’s law describes the transport of wet air considered as a single component. Assume that Darcy’s law applies to the transport of wet air and water in liquid form and that gravity, inertia, or anisotropic effects can be disregarded. Therefore, Darcy’s law reads, for i = l and g K ivi = ⫺ kri (Sl)grad pi i
(9)
in which K denotes the intrinsic permeability of the porous material independent of the saturating phases; and i, kri (Sl) and pi = dynamic viscosity, relative permeability, and pressure respectively associated with phase i. Furthermore, assuming that wet air is an ideal mixture, pressure pg is simply the sum of the pressure of its constituents with the following relations: pg = pv ⫹ pa;
pv = Cv pg;
pa = Ca pg
(10)
When applying (9) for i = g, the velocity vg of the gas phase, as the velocity of a mixture formed of two distinct constituents, remains to be specified. The choice between a mass-averaged velocity [e.g., Perre´ and Degiovanni (1990), Lichtner (1996), and Wang and Cheng (1996)] or a molar-averaged velocity [e.g., Adenekan et al. (1993), and Sleep and Sykes (1993)] is not obvious and needs to be argued. To this aim, a thermodynamic argument to support the choice of a molaraveraged velocity (i.e., vg = vcg) to be used in Darcy’s law [(9)] is developed in Appendix II, which also introduces Fick’s law in the porous media as a linear law of transport given by (39). When used with (3), (39) provides the expression of the total mass velocity of constituent j = a or v of the gas mixture in the form g jvj = g jvg ⫺ j
D f (Sl, )grad Cj Cj
(11)
where vg = gas molar-averaged velocity satisfying (9) for i = g; D is given by (8); and f = resistance factor accounting for both the tortuosity effect and the reduction of space offered to the diffusion of gaseous constituents (Degiovanni and Moyne 1987). The limiting case of free diffusion represented by (4) is recovered by letting g = = 1 and f (Sl = 0, = 1) = 1. Note that • Dispersion effects caused by the heterogeneity of the velocity distribution at the microscopic scale upon the transport of gaseous constituents have been disregarded in (11). At the macroscopic scale, they can, to a certain extent, be accounted for by considering a modified diffusion coefficient in the right-hand side of (11) [e.g., Bear (1991) and Plumb and Whitaker (1988)]. However, in the case of weakly permeable materials considered here and due to a sufficiently high diffusion coefficient, the mixture velocity is sufficiently low to neglect dispersion effects compared with diffusion ones. • Eq. (11) does not account for Knudsen flow that may occur in weakly permeable materials with pore diameters smaller than the mean-free path of the gas molecules. This phenomenon can reduce the diffusion process due to the collisions between molecules as well as against pore walls (Daı¨an 1988) and affect the Darcean transport of the whole gas by sliding effects on pore walls (Dullien 1979). The significance of these effects (not considered in the present modeling) on the drying process of weakly permeable materials will be discussed in the last section. 584 / JOURNAL OF ENGINEERING MECHANICS / JUNE 2001
State Equations Eqs. (1), (9), and (11) have to be completed to form a constant set of equations. On the ‘‘gas side,’’ water vapor and dry air are assumed to be ideal gases and the state equation [(33)] is specified in the standard form, for j = a or v pj Mj = RTj ;
(cj Mj = j)
(12)
where Mj, R, and T respectively stand for the molar mass of constituent j, ideal gas constant, and temperature. On the ‘‘liquid side,’’ l is supposed constant in (33) for k = l (i.e., weakly compressible liquid water). A careful inspection of the set of equations shows that two equations are still missing, one linking the water saturation Sl to the other state variables and one governing the liquid-water phase change. For reversible and isothermal processes and rigid porous medium, a standard application of the first two laws of thermodynamics to the open system d⍀ yields gl dml ⫹ gv dmv ⫹ gadma ⫺ d ⌿ = 0
(13)
where ⌿ = free Helmholtz potential per unit of volume of the porous space d ⍀. Eq. (13) stipulates that the external energy gl dml ⫹ gv dmv ⫹ gadma provided to the open system between times t and t ⫹ dt is entirely stored by the porous system d⍀ in the form of the free energy d ⌿ and can be released in its totality later on. With the help of (2), (10), and (33) and recalling that d = 0 on account of the assumed rigidity of the porous medium, (13) and some straightforward derivations lead to pc dSl ⫺ d ⌿␥ = 0
with pc = pg ⫺ pl ; ⌿ = ⌿␥ ⫹ mk⌿k
(14)
in which pc appears as the macroscopic capillary pressure defined as the difference between the macroscopic pressure of the gaseous phase and that of the liquid one. This definition agrees with that found in a more fundamental way by Hassanizadeh and Gray (1993) and Nitao and Bear (1996) through averaging procedures. At the macroscopic level, the relevant capillary pressure is indeed the difference of the averaged pressures and not the average of their difference. Similar results to (13) have been derived by Dangla and Coussy (1997, 1998) for nonrigid porous materials. In addition, owing to its definition [(14)], ⌿␥ appears as the energy stored in the interfaces between the phases per unit of volume of the porous space and, consequently, is proportional to the surface energy ␥ of this interface. Moreover, ⌿␥ can be interpreted as the capillary potential, because, in the absence of hysteresis, (14) implies that the capillary pressure only depends on the liquid-water saturation through the derivation of ⌿␥ with respect to Sl pg ⫺ pl = pc(Sl) =
⭸⌿␥ ⭸Sl
(15)
Finally, assume that no dissipation occurs during the phase change. This is equivalent to assuming that the liquid water and its vapor remain in permanent local thermodynamic equilibrium. The rate of evaporation l→v is then governed by the equality of their Gibbs potentials at any time. Differentiating this equality and using (33), one obtains Clapeyron’s law in its isothermal form dpv dpl ⫺ =0 v l
(16)
Assuming incompressibility of water and integrating the previous equations, one obtains l
RT ln hr = pl ⫺ patm Mv
with hr =
pv pv s
(17)
where pv s = saturating vapor pressure when pl is equal to the
atmospheric pressure at the temperature corresponding to the drying; consequently, hr = relative humidity. When, in addition, the mixture pressure pg is assumed to remain constantly equal to the atmospheric pressure patm, (17) reduces to the celebrated Kelvin law RT l ln hr = ⫺pc Mv
(18)
ISOTHERMAL DRYING PROBLEM Provided that l is a given constant, it can easily be checked that (1), (9), (11), (12), (15), and (17) constitute a closed set of equations. The isothermal drying problem consists in solving this set once the boundary and the initial conditions have been specified. The variables finally retained for the numerical formulation of the problem are Sl, pv , pa, and the evaporation rate l→v. In fact, a careful examination shows that there are only two independent variables whose evolution depends upon the particular drying problem under consideration. Indeed two independent boundary conditions are actually needed at the boundary of the sample; namely, the relative humidity and the mixture pressure, the latter being equal to the external atmospheric pressure. Pressures pv and pa are related to relative humidity and mixture pressure through (10) and (17). In addition, assume that the Kelvin law [(18)] holds at the boundary of the sample where pg = patm. Therefore the liquid saturation is fixed there through (15). Consequently, there is no need for an extra boundary condition for the liquid-water outgoing flux. In fact, it is not possible to separately determine the liquidwater flow and the water-vapor flow through the sample boundary. Only the total water flux can be calculated as a result of fixing the liquid-water saturation at the boundary of the sample. The three continuity equations [(1)] are simultaneously solved using the finite-volume method [for a complete description of this method, see Eymard et al. (2000)]. Because of the geometry of the sample involved in the experiments on which the comparison will be based, only a 1D case of drying is considered. From the numerical point of view, the spatial derivatives in the mass conservation equation are discretized according to the finite-volume approximation. These approximations ensure a local conservation of mass that is of major interest for this problem. Furthermore, one adopts an Euler discretization for the time derivatives in (1) and an implicit approximation in time for a better stability of the scheme. The resulting nonlinear system is solved through a standard Newton-Raphson method. Time-step size is computed, according to predictor-corrector criteria; this leads to a numerical control of the time discretization error. The complete scheme is presented in Mainguy (1999), and the missing data are given in Appendix III. The results given in the following parts have been obtained for a sample length of 10 cm with a 200-grid block mesh. The drying experiments that are referred to in this work have been performed on hardened cement paste cylindrical samples (ø 16 ⫻ 10 cm), referred to as CO, and hardened concrete samples of the same dimensions, referred to as BO. The cylindrical boundary of the samples were prevented from moisture exchange in order to perform a 1D drying test. Experimental procedures and results are presented in detail in Baroghel-Bouny (1994) and Baroghel-Bouny et al. (1999), where the composition of the mixes and the mineral composition of the cement used can also be found. At the beginning of the drying process, the samples were 2-years old to avoid the influence of the hydration process and the associated selfdesiccation. The initial internal relative humidity measured with a relative humidity probe was 93% for BO and 87% for CO. The two samples were submitted to drying at a relative
humidity of 50% and at a constant temperature of 20⬚C. Consequently, the conclusions about moisture transport mechanisms, which will be drawn later, are strictly related to the external value of the relative humidity. Material Properties The porosity and the apparent mass density of the two mixes are reported in Table 1. The values correspond to the total porosity available for liquid and gaseous transports. They have been obtained using both water-vapor sorption (well suited for small pores) and mercury intrusion porosimetry (well suited for capillary pores) (Baroghel-Bouny 1994). One of the key material properties is the capillary curve [i.e., the curve pg ⫺ pl = pc(Sl)]. The equilibrium value of pc as a function of Sl depends upon the process corresponding to either material drainage or imbibition. However, such hysteretic effects are not involved here because only the first desorption of the material is considered. For giving saturating fluids and temperature, the capillary-pressure curve is experimentally determined from the desorption isotherm; i.e., the equilibrium value of mass water content is measured as a function of the relative humidity and, therefore, of the capillary pressure using Kelvin’s law [(18)]. The experimental capillary curve is well fitted through the expression (Fig. 2) pc(Sl) = ␣(S ⫺ ⫺ 1)1⫺1/ l
(19)
whose general form has been proposed by van Genuchten (1980). Table 2 gives, for BO and CO, the parameter values ␣ and  evaluated with a least-squares fit on experimental results. The parameter values do not intend to account for the experimental points associated with low capillary pressure values, and thus with high relative humidity values, due to their weak reliability. In fact, even for an external relative humidity of 100%, the samples used for the desorption experiment are not saturated, which cannot be described by (18) and (19). As TABLE 1.
Porosity and Mass Density for Tested Materials
Mix Total porosity (%) Apparent mass density (kg/m3)
FIG. 2. TABLE 2. Mix ␣ (MPa)  (⫺)
BO
CO
12.2 2,285
30.3 1,717
Capillary Pressure Curves for CO and BO Parameters ␣ and  for Tested Materials BO
CO
18.6237 2.2748
37.5479 2.1684
JOURNAL OF ENGINEERING MECHANICS / JUNE 2001 / 585
mentioned above, the capillary pressure curve [(19)] together with Kelvin’s law [(18)] allows the determination of the liquidwater saturation Sl on the sample boundary where the relative humidity is fixed and where the mixture pressure is equal to the atmospheric pressure. Mass Transfer Parameters Few experimental results exist concerning the relative permeability of cement-based materials to gas and even less concerning the relative permeability to liquid. To overcome this difficulty, analytic expressions can be derived using Mualem’s model [e.g., van Genuchten (1980)], which predicts the hydraulic conductivity from the statistical pore-size distribution. When using fitted expression (19), van Genuchten (1980) derived the following expression for the relative permeability of soils to water: m 2 krl (Sl) = 兹Sl (1 ⫺ (1 ⫺ S 1/m l ) )
(20)
with m = 1/, where  = exponent appearing in the capillary pressure curve [(19)]. In the particular case of cement-based materials, Savage and Janssen (1997) have shown the relevancy of (20) to account for the liquid-water movement in unsaturated portland-cement concrete. For the relative permeability to gas, the result derived in Parker et al. (1987) and Luckner et al. (1989) is used 2m krg(Sl) = 兹1 ⫺ Sl (1 ⫺ S 1/m l )
(21)
Using expressions (20) and (21) and the values of parameter  given in Table 2, the relative permeability to water and to gas are plotted in Fig. 3. For both materials under consideration, the relative permeability to water becomes negligible for liquid-water saturation Sl lying in a range <0.4. This saturation value can be interpreted as the saturation threshold below which the liquid phase becomes discontinuous so that the liquid-water transport can only occur through evaporationcondensation between liquid ‘‘clusters.’’ It is worthwhile to note that the relative humidity corresponding through Kelvin’s law [(18)] and the capillary pressure relationship [(19)] to a liquid-water saturation of 0.4 is nearly equal to 50% (i.e., the environmental relative humidity imposed here for drying). Because of the lack of experimental results, the resistance factor involved in (11) is approached through the expression derived by Millington (1959) for variably saturated porous media and used by several authors [e.g., Adenekan et al. (1993), and Sleep and Sykes (1993)]. This expression relies on a theoretical evaluation of the tortuous effect and reads
FIG. 3.
Relative Permeability to Water and Gas for CO and BO
586 / JOURNAL OF ENGINEERING MECHANICS / JUNE 2001
f (Sl , ) = 4/3(1 ⫺ Sl)10/3
(22)
Evaluation of Intrinsic Permeability The material property remaining to be specified is the intrinsic permeability K involved in (9). For weakly permeable materials such as cement-based materials, a direct measurement of K is not well suited to water since liquid-water flows, which are actually measurable with a good accuracy, require very high pressure gradients. In fact, for weakly permeable materials, the drying process itself can provide a more reliable test for evaluating the intrinsic permeability. This evaluation is achieved by determining the value of K for which the modeling best accounts for the mass-loss history of samples recorded during their drying. Values obtained following such a procedure from the experimental data given by BaroghelBouny (1994) are summarized in Table 3. The experimental and the predicted relative weight loss are plotted in Fig. 4. It can be noted that the intrinsic permeability estimated by the proposed model (Table 3) for the cement paste CO lies in the same range as the value 3.10⫺21 m2 obtained when using the Katz-Thompson model [e.g., Garboczi (1990)] for the same material (Baroghel-Bouny 1994). The relevance of the whole modeling can be checked through its ability to account for many experimental points, whereas the value of only one material property, namely, the intrinsic permeability K, has to actually be adjusted. Moisture profiles predicted by the model can also be compared with the profiles evaluated through gamma-ray attenuation measurements. Such measurements provide an evaluation of the mass density of the materials and allow a follow-up of the moisture profile for different values of drying time. Predicted and experimental relative density variation profiles are compared in Figs. 5 and 6, where very similar evolutions can be observed. MODELING ANALYSIS Existence of Gas Overpressure Unexpectedly, numerical calculations have shown that the gas pressure does not remain constant during the drying process. As can be observed on the gas pressure profiles repreTABLE 3. Values of Intrinsic Permeability Determined from Experimental Weight Loss Mix Intrinsic permeability (m2)
FIG. 4.
BO
CO
3.10⫺21
1.10⫺21
Experimental and Predicted Weight Losses during Drying
FIG. 5. Times
Experimental and Predicted Moisture Profiles at Different
sented in Fig. 7, a significant gas overpressure arises at the sample boundary and progressively moves toward the interior of the sample. This phenomenon is rather unusual because the conductivity to gas of materials is generally so high that any change in the gas pressure vanishes quasi-instantaneously (at the timescale of drying) on account of Darcean convective flow. By contrast, in the drying process of weakly permeable materials (Table 3), numerical simulations have shown that this convective Darcean transport of gas is actually negligible. The predicted gas overpressure can reach up to 60% of the initial value of the gas pressure (i.e., of the atmospheric pressure) (cf. Fig. 7). It cannot be attributed to significant local storages of water vapor due to evaporation, because the vapor pressure is upperly bounded by the saturating vapor pressure, which is actually much lower than the observed gas overpressure. Consequently, the evaporated water is forced to diffuse toward the surrounding air. In fact, according to Fick’s law [i.e., (11)] applied to dry air, a symmetric diffusion of dry air occurs within the sample simultaneously to the diffusion of vapor toward the surrounding air. Owing to the absence of Darcean overall movement of the gas phase [i.e., the first term of the right-hand side of (11) is actually negligible], this symmetric diffusion process provokes a net arrival of fresh dry air. This arrival of dry air balances the departure of the evaporated water and causes an overpressure that propagates through the material. The evaporation as the actual cause of the gas overpressure appears when inspecting the molar balance equation of the gas mixture as a whole ⭸ l→v (gcg) = ⫺div(gcgvg) ⫹ ⭸t Mv
(23)
Eq. (23) has been derived from (1), (3), and (12) by adding the mass balance equations of water vapor and dry air previously divided by their respective molar masses. Because vg is nearly equal to zero on account of negligible overall Darcean movement, the local increase of molar concentration cg of the gas phase (and consequently of gas pressure pg) is only due to evaporation and is supplied by the movement of dry air. Moisture Transport Mechanisms
FIG. 6. Times
Experimental and Predicted Moisture Profiles at Different
FIG. 7.
Predicted Gas Pressure at Different Times within CO Material
Two extreme processes can be considered for the transport of moisture through drying materials. The first process corresponds to the diffusion toward the surrounding air of the vapor continuously formed by evaporation within the sample (cf. 1 ⫹ 2 in Fig. 1). The second process corresponds to the Darcean convective transport of the liquid water due to the liquid pressure gradient generated by the intense evaporation occurring at the sample boundary, to maintain the thermodynamic equilibrium of the water component (cf. 1⬘ ⫹ 2⬘ in Fig. 1). To identify the main mode of moisture transport responsible for the drying of weakly permeable materials considered here, the ratio of the liquid-water mass flow (i.e., l lvl) and the total moisture mass flow (i.e., l lvl ⫹ g vvv) is plotted as a function of depth in Fig. 8. As can be noted on this figure, this ratio remains equal to 1 at the boundary of the sample, implying that the weight loss is mainly achieved by the final transport of humidity in its liquid form toward the boundary and its subsequent evaporation. In addition, after 12 days of drying, the transport of humidity within the whole sample corresponds in its major part to the transport of liquid. The effect of the gas overpressure and its associated gradient on liquidwater motion can be observed in Fig. 8 with the negative sign of the ratio corresponding to liquid water moving at some intermediary depth toward the center of the sample. Inversely, it can be inferred here that the vapor diffusion within the sample very quickly does not participate significantly to the moisture transport and to the weight loss due to JOURNAL OF ENGINEERING MECHANICS / JUNE 2001 / 587
FIG. 8. Predicted Ratio of Liquid-Water Mass Flow onto Total Moisture Mass Flow at Different Times
FIG. 10. Comparison of Experimental Weight Loss with That Predicted from Only Liquid Moisture Transport [i.e., Eq. (24)]
Because the relative humidity is imposed on the sample boundary, the liquid-water saturation is also imposed there through Kelvin’s equation [(18)] and the capillary curve [(15)]. Fig. 10 shows that the whole history of the experimental weight loss is accurately accounted for by the weight loss involving only the transport of water in its liquid form and its evaporation at the sample boundary in contact with the surrounding air [i.e., (24)]. The comparison has been carried out in choosing, for the intrinsic permeability K, the value previously evaluated (Table 3). As a conclusion of the whole analysis, the intrinsic permeability to liquid of weakly permeable materials can be eventually estimated by fitting the experimental weight loss through only (24) (Baroghel-Bouny et al. 2001). DISCUSSIONS Constant Gas Pressure Hypothesis FIG. 9. Times
Predicted Molar Fraction Profiles of Water Vapor at Different
drying. Effectively, for weakly permeable materials for which convective Darcean transport of the gas can be disregarded, the combined and opposite diffusion of dry air and water vapor makes the molar concentrations rapidly uniform and, thus, later renders the diffusion process inactive as a motor of the drying process. As can be observed in Fig. 9, the mole fractions of water vapor and dry air are quite uniform at the end of the first week, which corresponds to the period required for the pick of gas overpressure to reach the center of the sample (cf. Fig. 7). Simplified Model It is quite paradoxical that the drying of weakly permeable materials is mainly achieved by the transport of moisture in its liquid form. Ignoring the gas phase, in particular the effect of its pressure (i.e., pc ⬅ pl) and the vapor diffusion, as also the evaporation within the sample, the approach turns to consider a single diffusion equation given by
⭸Sl ⫹ div(Dl grad Sl) = 0 ⭸t
with Dl = p⬘(S c l)
Kkrl (Sl) l
588 / JOURNAL OF ENGINEERING MECHANICS / JUNE 2001
(24)
Most of the standard models of drying [e.g., Philip (1958), Bazˇant and Najjar (1972), Daı¨an (1986), and Xi et al. (1994a)] are based on the assumption of a constant gas pressure. This assumption is common in soil mechanics and relies upon a familiar idea. Because of the assumed high conductivity of the vapor-air phase, any changes in its pressure, whatever its origin, vanishes quasi-immediately on account of Darcean air transport that occurs quasi-instantaneously when compared with the timescale of all the other phenomena. With this assumption, the drying process can be modeled with a standard diffusion equation involving either the liquid-water content (or the liquid-water saturation) or the vapor pressure (or the relative humidity). A standard diffusion equation is used by several authors [e.g., Sakata (1983), Daı¨an (1986), Xi et al. (1994b), Xin et al. (1995), and Perrin et al. (1998)] to identify the material moisture diffusivity with experimental data. This section studies if a standard diffusion equation at constant atmospheric pressure can account for the experimental weight loss of materials BO and CO. For that purpose, one first recalls the two assumptions generally introduced to derive a standard diffusion equation: • The gas pressure remains constantly equal to the atmospheric pressure. • The vapor transport is governed by a pure diffusion process.
As previously mentioned, the first assumption can be achieved by a high gas conductivity that allows the dry-air Darcean movements to exhaust quasi-instantaneously (i.e., at the timescale of drying) any gas overpressure induced by evaporation. Therefore, the assumption relies on the fact that the first term (i.e., convective) of the right-hand side of (11) for j = a is much greater than the second one (i.e., diffusive). By contrast, the second hypothesis states that the first term of the right-hand side of (11), which represents the Darcean convective transport term, is negligible with respect to the second one for j = v. The disparity between the two transport modes of the gaseous components can be explained by the small amount (<2%) of water vapor in the wet air at 293 K (Mainguy 1999). Therefore, under the two previous assumptions the drying process is modeled with a diffusion equation whose diffusion coefficient simultaneously accounts for the liquid-water movement [as in (24)] and the water-vapor diffusion (Mainguy 1999)
⭸Sl ⫹ div[(Dl ⫹ Dv)grad Sl] = 0 ⭸t with Dv =
D pv
冉冊 v l
2
p⬘(S c l) f (Sl, )
(25)
where Dl = liquid-water contribution to the moisture diffusivity as given in (24). The weight loss predicted with the standard diffusion equation [(25)] in choosing the value previously evaluated for K and CO material (Table 3) is compared in Fig. 11 with the one given by the complete modeling for different values of the gas conductivity kg = K/g (m3 ⭈ s/kg). The value kg = 5.6 10⫺17 m3 ⭈ s/kg of the gas conductivity corresponds to the intrinsic permeability K = 10⫺21 m2 for which the gas overpressure was numerically observed in Fig. 7. Fig. 11 shows that increasing the gas conductivity kg leads to similar weight loss at those predicted with (25) because any gas overpressure can more easily be exhausted owing to the high gas conductivity. However, the high value of the gas conductivity required to recover an atmospheric gas pressure (i.e., kg = 10⫺12 m3 ⭈ s/kg) strongly differs from the value previously estimated from the real value of the gas viscosity (i.e., kg = 5.6 10⫺17 m3 ⭈ s/kg). The ratio between the two values (i.e., 10⫺12/10⫺17 = 105) appears to be too important to attribute the high value (i.e., kg = 10⫺12 m3 ⭈ s/kg) to sliding effects occurring on the pore walls (Knudsen’s
FIG. 11. Comparison of Experimental Weight Loss with Predicted Ones from Complete Model for Different Values of Gas Conductivity kg and from Standard Diffusion Equation at Constant Gas Pressure [i.e., Eq. (25)]
effect). As a result, the air pressure cannot remain constant during the drying of weakly permeable materials such as those considered here. It is possible to fit the experimental weight loss with a standard diffusion equation when dividing the value of the resistance factor f(Sl, ) by 100. This reduction could have been explained by the Knudsen flow that leads to a reduced effective diffusion coefficient of water vapor Dv [for a straight cylindrical pore; Daı¨an (1988)]. However, using Daı¨an’s expression, a division by 100 of the diffusion coefficient is related ˚ , which to a pore diameter of the order of magnitude of 10 A is not expected for CO material (Baroghel-Bouny 1994). Consequently, the effect of the Knudsen flow on the diffusion process cannot explain the overestimation associated with the modeling at constant gas pressure. Moisture Transport Mechanisms at Constant Gas Pressure It is clear in Fig. 11, that, at any time of drying, the weight loss predicted with the standard diffusion equation largely overestimates the experimental weight loss. This still holds even in the limit case where K is set equal to zero and no liquid-water movement is allowed. The predicted drying process of weakly permeable materials based on the assumption of a constant gas pressure [i.e., (25)] definitely occurs too fast with respect to the observed drying. The associated overestimation of the weight loss can be explained by the expression of the diffusion coefficient (25), which supposes that the Darcean transport of liquid water and the diffusive transport of water vapor necessarily occur simultaneously. Indeed, because of the liquid-vapor equilibrium governed by (17), a gradient of liquid-water pressure pl, which is the motor of the liquidwater movement, is simultaneous to a gradient of the vapor pressure. In the case of a constant gas pressure pg, because the vapor pressure is given by pv = Cv pg, a gradient in vapor pressure pv is equivalent to a gradient in molar concentration Cv . Finally, according to Fick’s law [(39)], the motor of the vapor diffusion is the gradient of molar concentration Cv . Therefore the Darcean transport of liquid water and the vapor diffusion will both stop when the molar concentration, or equivalently the vapor pressure, is uniform within the sample. This result implies that the two modes of moisture transport participate simultaneously and actively until the end of the drying process, as can be shown in Fig. 12, where the molar fraction
FIG. 12. Predicted Molar Fraction Profiles of Water Vapor from Standard Diffusion Equation at Constant Gas Pressure [i.e., Eq. (25)] at Different Times JOURNAL OF ENGINEERING MECHANICS / JUNE 2001 / 589
profile is still nonuniform after 1 year of drying for the standard diffusion equation based on the assumption of a constant gas pressure [i.e., (25)]. By contrast, in the case of the model developed in this paper, which does not assume a constant gas pressure, the previous result does not apply and a kind of uncoupling occurs between the two modes of moisture transport. The vapor diffusion can rapidly be nonactive independently of the Darcean transport of liquid water. This is mainly due to the diffusion of gaseous constituents working actively toward a uniform water-vapor mole fraction Cv while the vapor pressure pv remains nonuniform. After 1 week, the molar concentration Cv is effectively quasi-uniform (Fig. 9) and the only active motor left for moisture transport is the Darcean transport of liquid water. This explains the slowness of the drying process observed for weakly permeable materials in contrast to the quickness predicted by models based on the assumption of a constant gas pressure. Interpretation of Permeability Estimated with Nonconstant Gas Pressure Model Because the permeability is an intrinsic property, its value K is the same for i = l or g in (9) and can be alternatively determined by imposing gas pressure gradients on dried samples (i.e., Sl = 0). For cementitious materials, the value obtained in following such a procedure has an order of magnitude of 10⫺18 m2 (Baroghel-Bouny et al. 2001). This value is 103 times greater than the value previously determined from the analysis of the weight loss (Table 3). In fact, contrary to gas, physical forces arise between the liquid-water molecules and the cementitious matrix. These forces significantly reduce the velocity of the water molecules near the internal walls of the porous space. This phenomenon can be captured through an effective permeability Kl to liquid water much lower than the intrinsic one K. This effective permeability has to be used in (9) for i = l. For material CO, letting K equal to 10⫺18 m2 in (9) for i = g, the analysis of the weight loss yields a value of 4.10⫺22 m2 for Kl instead of 10⫺21 m2 (Table 3). In fact such low values of permeability cannot be evaluated by liquid-water permeameters for which the allowed liquid-water pressure gradients are much lower than those occurring during the drying of cement-based materials. Furthermore, the bigger value of K (i.e., 10⫺18 m2) used in the expression [(9)] of the permeability to gas authorizes Darcean convective flows of the gas mixture. Consequently, the gas overpressure falls to a more realistic value of 20% of the atmospheric pressure, instead of the value of 60% estimated in the previous analysis. In turn, the moisture transport through vapor diffusion becomes more active in the drying process and contributes to the weight loss in a greater proportion than previously expected. The liquid-water permeability Kl has to be reduced accordingly (i.e., down to a 4.10⫺22 m2) to meet the experimental values. CONCLUSIONS This paper analyzes drying tests of weakly permeable cement-based materials with a model involving dry-air and water-vapor components in gas phase and a pure liquid-water phase. A comparison between experimental weight losses and their modeling allows one to estimate the intrinsic permeability of the weakly permeable materials and to analyze the moisture transport mechanisms. It is found that the gas pressure cannot be assumed to remain constantly equal to the atmospheric pressure because no significant convective Darcean transport of the gas occurs. The modeling shows that a gas overpressure supplied by the diffusion of dry air works actively toward a uniform vapor molar concentration. Therefore, the diffusion of vapor becomes rapidly nonactive as a motor of moisture trans590 / JOURNAL OF ENGINEERING MECHANICS / JUNE 2001
port. In fact, it is shown that the drying of weakly permeable materials is eventually achieved by the transport of moisture in its liquid form and its evaporation at the sample boundary in contact with the surrounding air. This paper also compares the modeling with a standard diffusion equation based on the assumptions that the gas pressure remains constantly equal to the atmospheric pressure and that the water vapor is only transported by diffusion in the gas phase. The comparison points out that the standard diffusion equation largely overestimates the material weight losses. This overestimation is attributed to the constant gas pressure hypothesis, which necessarily implies that the liquid-water movement and the water-vapor diffusion are active simultaneously. This coupling is not necessarily active when the assumption of the constant gas pressure is relaxed, as can be observed with the model developed in this paper. The effective permeability Kl to liquid water is a key parameter generally involved in different mass transport processes and, thus, plays an important role in the predictions of the service lives of civil engineering structures. However, only a few methods allow the evaluation of its value for weakly permeable materials as high-performance materials and even for good-quality ordinary concretes. Consequently, the results presented in this paper can be used to provide a new method for the estimation of the effective permeability Kl to liquid water, when comparing experimental weight loss during drying tests with those predicted with the simplified model given by (24). Estimations obtained in this way provide at least a way of comparison between low permeable materials when classical methods to not apply. APPENDIX I. EVALUATION OF TEMPERATURE DECREASE DURING DRYING PROCESS A rough linear approach derived in Coussy et al. (1998) yields an overestimation of the maximal decrease max of temperature in the form max =
Lml⬁ d rC
冉 冊 1⫺
d
⫺1
(26)
where the local characteristic time of thermal transfer is given by =
rCx 2
(27)
In (26) and (27), ml⬁ stands for the asymptotic variation of liquid-mass content; denotes the effective thermal conductivity of the material; and x denotes the local transfer depth considered. Assuming only a transport of water in its liquid form with evaporation at the boundary of the sample, an estimation of a local drying characteristic time d can be deduced from (24) in the form l x 2 d = ⫺ Kkrl (Sl)p⬘(S c l)
(28)
Eqs. (27) and (28) lead to an upper bound of the ratio of the two characteristic times /d independently of the local depth x rC Kp⬘(S c l) =⫺ d l
(29)
An upper bound of this ratio can be evaluated during the drying of material CO, using = 0.3, rC = 0.7 ⫻ 1,700 ⫻ 1,000 ⫹ 0.3 ⫻ 1,000 ⫻ 4,180 = 2,444 kJ/(m3 ⭈ K), = 1 w/m ⭈ K, 8 K = 10⫺21 m2, and ⫺p⬘(S c l) < 3.10 Pa = 7.410⫺4 d
(30)
Finally, an overestimation of the decrease of temperature can be deduced from (26) with ml⬁ < l and the value of the latent heat of vaporization at 20⬚C (i.e., 2,450 kJ/kg)
With respect to dissipation ⌬TF , associated with the diffusion process, Fick’s law appears as the linear relation linking the flux g(vv ⫺ va) and the associated force ⫺pg grad Cv , reading
max ⱕ 0.23K
D g(vv ⫺ va) = ⫺ f (Sl, )grad Cv CvCa
(31)
This small decrease ensures the hypothesis of a constant temperature during the drying. Estimation (31) may not hold at the beginning of the drying process during which the humidity is also transported by vapor diffusion (Baggio et al. 1997). However, it has been found that vapor diffusion does not significantly contribute to the weight loss. In addition Lml⬁ in (26) largely overestimates the latent heat effect on the temperature decrease. More generally, the character well separated in time of the transfers of humidity and heat of weakly permeable materials indicates that the major role of temperature variations on the drying process will be its influence on the saturating vapor pressure. APPENDIX II. THERMODYNAMIC ARGUMENT FOR MOLAR-AVERAGED VELOCITY OF GAS PHASE When applying (9) for i = g, the velocity vg of the gas phase, as the velocity of a mixture formed of two distinct constituents, remains to be specified. To this aim, macroscopic thermodynamic considerations are developed below. The dissipation ⌬T associated with mass transport, which has to be nonnegative according to the second law of thermodynamics, reads in the isothermal case [e.g., de Groot and Mazur (1984) and Coussy (1995)] ⌬T = ⫺l lvl ⭈ grad gl ⫺ vgvv ⭈ grad gv ⫺ agva ⭈ grad ga ⱖ 0
(32)
In (32) gj (respectively gl) stands for the Gibbs potential per mass unit of component j = a or v (respectively of the liquid phase). In this case of isothermal drying, gk depends only on pk and satisfies for k = a, v, and l ⭸gk 1 = ; ⭸pk k
pk gk = ⌿k ⫹ k
(33)
where ⌿k = Helmholtz free energy per mas unit of fluid k. A substitution of (33) into (32) yields ⌬T = ⫺lvl ⭈ grad pl ⫺ gvv ⭈ grad pv ⫺ gva ⭈ grad pa ⱖ 0
(34)
which can be shown to hold also in the nonisothermal case (Coussy 1995). Now, express the gas mixture velocity as the sum of the water vapor and the dry-air velocity multiplied by not yet specified weighting factors aj vg = avvv ⫹ aava
with av ⫹ aa = 1
(35)
Substituting (35) into (34), dissipation ⌬T = ⌬TD ⫹ ⌬TF can be split into two terms, a dissipation ⌬TD associated with the flows of the liquid-water phase and of the mixture as a whole and a dissipation ⌬TF associated with the diffusion of a gaseous constituent through the other. Because of their different physical nature, they can be assumed to be separately positive, reading ⌬TD = ⫺lvl ⭈ grad pl ⫺ gvg ⭈ grad pg ⱖ 0
(36)
⌬TF = ⫺g(vv ⫺ va) ⭈ (aa grad pv ⫺ av grad pa) ⱖ 0
(37)
Dissipations ⌬TD and ⌬TF appear as the sum of products of a flux [for instance lvl in (36)] by its associated force [for instance ⫺grad pl in (36)]. Linear laws of transport consist in adopting linear relations between the force and the flux as in Darcy’s law [(9)] for i = l or g. When a molar-averaged reference velocity is adopted (i.e., aj = Cj), (10) and (37) yield ⌬TF = ⫺g pg(vv ⫺ va) ⭈ grad Cv ⱖ 0
(38)
(39)
where the resistance factor f (Sl, ) accounts for both the tortuosity effect and the reduction of space offered to the diffusion of gaseous constituents. On the contrary, when a mass-averaged velocity is adopted, the Darcy’s law of the gas phase and a diffusion law based upon an associated force of the form ⫺pg grad Cv cannot be simultaneously recovered with the linear theory of irreversible thermodynamics. Based upon this argument, a molar-averaged reference velocity is therefore selected in the paper. APPENDIX III. l Mv Ma R T pvs patm g l
= = = = = = = = =
NUMERICAL DATA
1,000 kg/mol 0.018kg/mol 0.029 kg/mol 8.315 J/K ⭈ mol 293 K 2,333 Pa 101,325 Pa 1.8 10⫺5 kg/m ⭈ s 1.10⫺3 kg/m ⭈ s
ACKNOWLEDGMENTS The writers thank P. Dangla of Laboratoire Central des Ponts et Chausse´es, Paris, and R. Eymard from Ecole Nationale des Ponts et Chausse´es, Paris, for their contribution to this work. The first writer also acknowledges the support of Laboratoire Central des Ponts et Chausse´es, where this work was realized.
REFERENCES Adenekan, A. E., Patzek, T., and Pruess, K. (1993). ‘‘Modeling of multiphase transport of multicomponent organic contaminants and heat in the subsurface: Numerical model formulation.’’ Water Resour. Res., 29(11), 3727–3740. Baggio, P., Bonacina, C., and Schrefler, B. A. (1997). ‘‘Some considerations on modeling heat and mass transfer in porous media.’’ Transport in Porous Media, 28, 233–251. Baroghel-Bouny, V. (1994). ‘‘Caracte´risation des paˆtes de ciment. Me´thodes, analyse, interpre´tation.’’ PhD thesis, Ecole Nationale des Ponts et Chausse´es, Paris (in French). Baroghel-Bouny, V., Mainguy, M., and Coussy, O. (2001). ‘‘Isothermal drying process in weakly permeable cementitious materials. Assessment of water permeability.’’ ACI Mat. J. Baroghel-Bouny, V., Mainguy, M., Lassabate`re, T., and Coussy, O. (1999). ‘‘Characterization and identification of equilibrium and transfer moisture properties for ordinary and high-performance cementitious materials.’’ Cement and Concrete Res., 29(8), 1225–1238. Bazˇant, Z. P. (1972). ‘‘Thermodynamics of hindered adsorption and its implications for hardened cement paste and concrete.’’ Cement and Concrete Res., 2(1), 1–16. Bazˇant, Z. P., and Najjar, L. N. (1972). ‘‘Nonlinear water diffusion in nonsaturated concrete.’’ Mate´riaux et Constructions, 5(25), 3–20. Bear, J. (1991). ‘‘Mathematical modelling of transport in porous media.’’ Modelling and applications of transport phenomena in porous media, J. Bear and J.-M. Buchlin, eds., Kluwer Academic, Boston, 1–190. Chaussadent, T. (1999). ‘‘Etat des lieux et re´flexions sur la carbonatation du be´ton arme´.’’ Rapport Etudes et Recherches LCPC, Laboratoire Central des Ponts et Chausse´es, Paris (in French). Coussy, O. (1995). Mechanics of porous continua, Wiley, New York. Coussy, O., Eymard, R., and Lassabate`re, T. (1998). ‘‘Constitutive modelling of unsaturated drying deformable materials.’’ J. Engrg. Mech., ASCE, 124(6), 658–667. Daı¨an, J.-F. (1986). ‘‘Processus de condensation et de transfert d’eau dans un mate´riau meso et macro-poreux. Etude expe´rimentale du mortier de ciment.’’ PhD thesis, Institut National Polytechnique de Grenoble, Grenoble, France (in French). Daı¨an, J.-F. (1986). ‘‘Condensation and isothermal water transfer in ceJOURNAL OF ENGINEERING MECHANICS / JUNE 2001 / 591
ment mortar. Part I. Pore size distribution, equilibrium water condensation and imbibition.’’ Transport in Porous Media, 3, 563–589. Dangla, P., and Coussy, O. (1997). ‘‘Drainage and drying of deformable porous materials: One dimensional case study.’’ Proc., IUTAM, Symp. on Mech. of Granular and Porous Mat., N. A. Fleck and A. C. F. Cocks, eds., Kluwer, Dordrecht, The Netherlands. Dangla, P., and Coussy, O. (1998). ‘‘Non-linear poroelasticity for unsaturated porous materials: An energy approach.’’ Proc., Biot Conf. on Poromechanics, Balkema, Louvain-la Neuve, Belgium, 53–64. Degiovanni, A., and Moyne, C. (1987). ‘‘Conductivite´ thermique de mate´riaux poreux humides: E´valuation the´orique et possibilite´ de mesure.’’ Int. J. Heat Mass Transfer, 30(11), 2225–2245 (in French). de Groot, S. R., and Mazur, P. (1984). Non-equilibrium thermodynamics, Dover, New York. de Vries, D. A., and Kruger, A. J. (1966). ‘‘On the value of the diffusion coefficient of water vapour in air.’’ Proc., Colloque Int. du CNRS no 160: Phe´nome`nes de transport avec changement de phase dans les milieux poreux ou colloı¨daux, CNRS, Paris, 61–72. Dullien, F. A. L. (1979). Porous media: Fluid transport and pore structure, Academic, San Diego. Eymard, R., Galloue¨t, T., and Herbin, R. (2000). ‘‘The finite volume methods.’’ Handbook of numerical analysis, P. G. Ciarlet and J. L. Lions, eds., North-Holland, Amsterdam. Garboczi, E. J. (1990). ‘‘Permeability, diffusivity and microstructural parameters: A critical review.’’ Cement and Concrete Res., 20(4), 591– 601. Hassanizadeh, S. M., and Gray, W. H. (1993). ‘‘Thermodynamic basis of capillary pressure in porous media.’’ Water Resour. Res., 29(10), 3389– 3405. Hausmann, D. A. (1967). ‘‘Steel corrosion in concrete: How does it occur?’’ Mat. Protection, 4(11), 19–22. Lassabate`re, T. (1994). ‘‘Couplages hydrome´caniques en milieux poreux non sature´s avec changement de phase. Application au retrait de dessiccation.’’ PhD thesis, Ecole Nationale des Ponts et Chausse´es, Paris (in French). Lichtner, P. C. (1996). ‘‘Continuum formulation of multicomponent-multiphase reactive transport.’’ Reactive Transport in Porous Media, Rev. in Mineralogy, P. C. Lichtner, C. I. Sveelep, and E. H. Oepkers, eds., 34, 1–81. Luckner, L., van Genuchten, M. Th., and Nielsen, D. R. (1989). ‘‘A consistent set of parametric models for the two-phase-flow of immiscible fluids in the subsurface.’’ Water Resour. Res., 25(10), 2187–2193. Mainguy, M. (1999). ‘‘Mode`les de diffusion non-line´aires en milieux poreux. Applications a` la dissolution et au se´chage des mate´riaux cimentaires.’’ PhD thesis, Ecole Nationale des Ponts et Chausse´es, Paris (in French). Millington, R. J. (1959). ‘‘Gas diffusion in porous media.’’ Sci, 130, 100– 102. Nitao J. J., and Bear, J. (1996). ‘‘Potentials and their role in transport in porous media.’’ Water Resour. Res., 32(2), 225–250. Page, C. L., and Treadaway, K. W. J. (1982). ‘‘Aspect of the electrochemistry of steel in concrete.’’ Nature, 297(5), 109–115. Papadakis, V. G., Vayenas, C. G., and Fardis, M. N. (1991). ‘‘Fundamental modeling and experimental investigation of concrete carbonation.’’ ACI Mat. J., 88(4), 363–373. Parker, J. C., Lenhard, R. J., and Kuppusamy, T. (1987). ‘‘A parametric model for constitutive properties governing multiphase flow in porous media.’’ Water Resour. Res., 23(4), 618–624. Perre´, P., and Degiovanni, A. (1990). ‘‘Simulation par volumes finis des transferts couple´s en milieux poreux anisotropes: Se´chage du bois a` basse et a` haute tempe´rature.’’ Int. J. Heat Mass Transfer, 33(11), 2463–2478. Perrin, B., Baroghel-Bouny, V., and Chemloul, L. (1998). ‘‘Methods of determination of the hydric diffusivity of hardened cement pastes.’’ Mat. and Struct., Paris, 31, 235–241. Philip, J. R. (1958). ‘‘Physics of water movement in porous solids.’’ Spec. Rep. No. 40, Highway Research Board, Washington, D.C., 147–163. Plumb, O. A., and Whitaker, S. (1988). ‘‘Dispersion in heterogeneous porous media. I. Local volume averaging and large-scale averaging.’’ Water Resour. Res., 24(7), 913–926. Raharinaivo, R., Arliguie, G., Chaussadent, T., Grimaldi, G., Pollet, V., and Tache´, G. (1998). La corrosion et la protection des aciers dans le be´ton, Presses de l’Ecole Nationale de Ponts et Chausse´es, Paris (in French). Reid, R. C., Prausnitz, J. M., and Poling, B. E. (1987). The properties of gases and liquids, 4th Ed., McGraw-Hill International Editions, New York. Saetta, A. V., Schrefler, B. A., and Vitaliani, R. V. (1993). ‘‘The carbonation of concrete and the mechanism of moisture, heat and carbon dioxide flow through porous materials.’’ Cement and Concrete Res., 23(4), 761–772. 592 / JOURNAL OF ENGINEERING MECHANICS / JUNE 2001
Sakata, K. (1983). ‘‘A study on moisture diffusion in drying and drying shrinkage of concrete.’’ Cement and Concrete Res., 13(2), 216–224. Savage, B. M., and Janssen, D. J. (1997). ‘‘Soil physics principles validated for use in predicting unsaturated moisture movement in Portland cement concrete.’’ ACI Mat. J., 94(1), 63–70. Sleep, B. E., and Sykes, J. F. (1993). ‘‘Compositional simulation of groundwater contamination by organic compounds. 1. Model development and verification.’’ Water Resour. Res., 29(6), 1697–1708. Taylor, R., and Krishna, R. (1993). Multicomponent mass transfer, Wiley, New York. van Genuchten, M. Th. (1980). ‘‘A closed-form equation for predicting the hydraulic conductivity of unsaturated soils.’’ Soil Sci. Soc. Am. Proc., 44, 892–898. Wang, C. Y., and Cheng, P. (1996). ‘‘A multiphase mixture model for multiphase, multicomponent transport in capillary porous media. I. Model development.’’ Int. J. Heat Mass Transfer, 39(17), 3607–3618. Wittmann, F. H. (1973). ‘‘Interaction of hardened cement paste and water.’’ J. Am. Ceramic Soc., 56(8), 409–415. Xi, Y., Bazˇant, Z. P., and Jennings, H. M. (1994a). ‘‘Moisture diffusion in cementitious materials. Moisture capacity and diffusivity.’’ Advanced Cement Based Mat., 1, 258–266. Xi, Y., Bazˇant, Z. P., Molina, L., and Jennings, H. M. (1994b). ‘‘Moisture diffusion in cementitious materials. Adsorption isotherms.’’ Advanced Cement Based Mat., 1, 248–257. Xin, D., Zollinger, D. G., and Allen, G. D. (1995). ‘‘An approach to determine diffusivity in hardening concrete based on measured humidity profiles.’’ Advanced Cement Based Mat., 2, 138–144.
NOTATION The following symbols are used in this paper: ai C Ci ci D Dl Dv d⍀ Ei f gi hr K kri L Mi mi ml⬁ patm pc pi pvs R r Sl T vi ␣,  ⌬ i max l→v i ⌿
= = = = = = = = = = = = = = = = = = = = = = = = = = = = = = = = = = = = =
gas reference velocity weighting factor; specific heat; mole fraction; molar density; diffusion coefficient of water vapor in wet air; liquid-water diffusivity; water-vapor diffusivity; macroscopic infinitesimal volume; mass fraction; resistance factor to diffusion; Gibbs potential per mass unit; relative humidity; intrinsic permeability; relative permeability; latent heat of water vaporization; molar mass; mass content per unit of volume d ⍀; asymptotic mass content of liquid phase; atmospheric gas pressure; capillary pressure; pressure; saturating vapor pressure; ideal gas constant; mass density; liquid-water saturation; temperature; velocity; capillary pressure-saturation relationship parameters; mass transport dissipation; dynamic viscosity; maximum decrease of temperature; effective thermal conductivity; water vaporization rate per unit of volume d ⍀; mass density; characteristic time; porosity; and free Helmholtz potential per unit of volume d ⍀.
Subscripts a c g l v
= = = = = =
dry air; molar-averaged velocity; gas; liquid; water vapor; and mass-averaged velocity.