Staten Island Community District 3
See SI 3's profile online
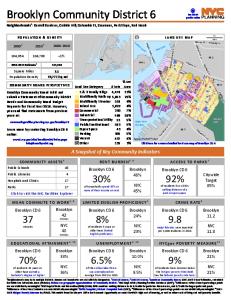
Neighborhoods1: Annadale, Arden Heights, Bay Terrace, Butler Manor, Charleston, Eltingville, Fresh Kills, Great Kills, Greenridge, Huguenot, Oakwood, Oakwood Beach, Oakwood Heights, Pleasant Plains, Prince's Bay, Richmond Town, Richmond Valley, Rossville, Sandy Ground, Tottenville, Woodrow
[
21.5 7,452/sq mi
A rt h
Land Use Category
Av Page
Website: www.nyc.gov/sicb3 Email:
[email protected]
Rd
Miller Field
Fort Wadsworth
Outerbridge Cg
St
To learn more, please read Staten Island CD 3's Statements of Community District Needs and Community Board Budget Requests for Fiscal Year 2018.
39% 1% <1% <1% 2% 3% 5% 5% 24% 1% 18% 1%
in Ma
1. Street conditions 2. Traffic 3. Transit (buses & subways)
1 & 2 Family Bldgs 44,049 Multifamily Walk-up 197 Multifamily Elevator 4 Mixed Use 254 Commercial 504 Industrial 127 Transportation/Utility 195 Public/Institutional 160 Open Space 1,469 Parking 197 Vacant 2,848 Other 116
Ki
Av
Top 3 pressing issues identified by Staten Island Community Board 3 in 2017:
Rd
d yR bo m A
ot uen Hug
COMMUNITY BOARD PERSPECTIVES
% Lot # Lots Area
ur
d on m h c Ri
Bl v d
Square Miles Population Density
SI 2
Rd
166,591
ll Hi
2011-2015 Estimate4
Richmond Av
+5%
Rock land Av
d on m
160,209
vd
ch Ri
152,908
Bl
Hy lan
V
y or i ct
Man or
2000-2010
d
20103
Mile
ll R
20002
1
LA N D U S E M A P W Shor eE xw y
PO P U L ATI O N & D E N S I T Y
Lower New York Bay
Click here for a more detailed land use map of Staten Island CD 3
A Snapshot of Key Community Indicators CO M M U N I T Y A S S E T S 5
R E N T B U R D E N 4, 6
Public Schools
46
Public Libraries
5
Hospitals and Clinics
1
Parks
62
Click to visit the NYC Facilities Explorer
M E A N C O M M U T E T O W O R K 4, 8
Staten Island CD 3
45 minutes
Staten Island 43 minutes
NYC 40
minutes
E D U C AT I O N A L AT TA I N M E N T 4 , 1 0
Staten Island CD 3
32%
of residents 25 years or older have earned a bachelor's degree or higher 1
Staten Island 31% NYC 36%
Staten Island CD 3
41%
of households spend 35% or more of their income on rent
Staten Island 46%
Staten Island CD 3
NYC 45%
of residents live within walking distance of a park or open space
LI M I T E D EN GL I S H P RO FI CI EN C Y 4
Staten Island CD 3
6.8%
of residents 5 years or older have limited English proficiency
Staten Island 10.9% NYC 23.1%
U N E M P L OY M E N T 4 , 1 0
Staten Island CD 3
6.5%
of the civilian labor force was unemployed on average from 2011 to 2015
A C C E S S TO PA R KS 7
Staten Island 6.9% NYC 9.5%
Citywide Target 85%
56%
C R I M E R AT E 9
Staten Island CD 3
3.1
Staten Island 6.5 NYC 11.8
major felonies were reported per 1,000 residents in 2016
P O V E R T Y 4, 1 0
Staten Island CD 3
7%
of residents had incomes below the poverty level
Staten Island 13% NYC 21%
Neighborhoods may be in multiple districts. Names and boundaries are not officially designated. 22000 US Census; 32010 US Census; 4American Community Survey 2011-2015 5-Year Estimates, calculated for Public Use Microdata Areas (PUMAs). PUMAs are geographic approximations of community districts. 5NYC Dept of City Planning Facilites Database (2017); 6 Differences of less than 3 percentage points are not statistically meaningful. 7NYC Dept of Parks and Recreation (DPR) (2016). DPR considers walking distance to be 1/4 mile for parks less than 6 acres, and 1/2 mile for larger parks and pools. 8 Differences of less than 2 minutes are not statistically meaningful. 9NYPD CompStat, Historic Complaint Data (2017); 10 Differences of less than 2 percentage points are not statistically meaningful.