Subjective Evaluation of State=of=the-Art 2-Channel Audio Codecs GILBERT A. SOULODRE,
THEODORE GRUSEC, MICHEL LAVOIE, AND LOUIS THIBAULT
Signal Processing and Psychoacoustics, Communications Research Centre, Ottawa, Ont., Canada K2H 8S2 This paper reports the results of double-blind subjective tests conducted to examine the audio quality of several state-of-the-art 2-channel audio codecs against a CD-quality reference. Implementations of the MPEG Layer 2, MPEG Layer 3, MPEG AAC, Dolby AC-3, and Lucent PAC codecs were evaluated at the Communications Research Centre in Ottawa, Canada in accordance with the subjective testing procedures outlined in ITUR Recommendation BS. 1116. The bhrates varied between 64 and 192 kdobhs per second per stereo pair. The study is unique in that this is the first time in which these codecs have been compared in a single test. Clear results were obtained for comparing the subjective performance of the codecs at each bitrate. All codecs were software based and constituted the most current implementations at the time of testing. An additional hardware based MPEG Layer 2 codec was included in the tests as a benchmark.
o
INTRODUCTION
The use of perceptual audio coding systems has increased dramatically over the past several years. These lossy coding schemes have found applications in numerous areas including: home recording studios, motion picture soundtracks, home entertainment systems, and the internet. As well, future digital television and radio broadcast systems will rely on the use of these systems [14], Several groups are currently developing and improving perceptual audio codecs and the performance of these codecs can vary widely. As well, several perceptual audio coding schemes have been standardized within international standards organizations such as the ISO/MPEG1 [5-7] and the ITU-R2 [8]. With the proliferation of perceptual audio codecs, there is a growing need for manufacturers, broadcasters, and organizations to make important decisions regarding which coding scheme is best suited to their specflc applications. This is particularly true given the lossy nature of these codecs. Unfortunately, there is a dearth of formal subjective data evaluating and comparing the performance of these codecs. Moreover, some of the findings from formal subjective tests are not readily available to the audio community. In this paper the methods, results and conclusions of double-blind subjective tests conducted at the Audio Perception Lab of the Communications Research Centre (CRC) are presented. The tests evaluated the subjective audio quality of 6 state-of-the-art codec families against a CDquality reference. The study is unique in that this constitutes the fiist formal comparison of all of these codecs in a single test. The codecs included in the tests are either currently standardized, 1International Organization for Standardization /Moving Picture Experts Group z Internationat Telecommunication Union - Radiocommunication Bureau
1
I
widely used, or are considered as strong contenders for future use. The goal of the tests was to obtain a reliable indication of the subjective quality of these codecs at bitrates ranging from 64 to 192 kbps (kilobits per second) per stereo pair. More specitlcally, the tests were intended to evaluate the “worst case” quality of these codecs under the most scrutinizing conditions. The wide range of low bitrates represented in the tests meant that a wider range of qualities were represented in this experiment than in any previous experiment conducted at the CRC [9-12]. 1
DESCRIPTION
OF CODECS TESTED
In this paper, the term codec family is used to identify the various codec proponents (e.g., AAC, AC-3, PAC, Layer 2, etc.), while the term codec represents a specific codec family/bitrate combination (e.g., AAC at 128 kbps, etc.). A total of 17 codecs were examined in the subjective tests. These consisted of 6 codec families operating at various bitrates to yield 17 codecs as shown in Table 1. Since the performance of these codecs is continuously evolving over time (within the limitations imposed by the bitstream syntax and the decoder), we wanted to ensure that each codec represented the best possible implementation at the time of the tests. To this end, software implementations of the codecs were obtained from the codec proponents. Moreover, the codec proponents were asked to submit the codecs by a speciiic date (February 22, 1997), and thus, the results of these tests provide an evaluation of the best performance that these codecs could offer at that time. Also included in the tests was a hardware implementation of an MPEG Layer 2 codec. This device is available commercially and was included to provide a comparison of the current state-of-the-art codecs to a relatively mature implementation. Codec Family
Label
Source
Bitrates (kbps) 96, 128, 160, 192
ITIS Itis ML 2000 (hardware codec) L II 128T, 160t, 192 IRT, CCEIT, & Philips consortium L III 128 FhG-IIS AAC MPEG AAC FhG-IIS 96+, 128 AC-3 AC3 128, 160, 192 Dolby Laboratories PAC PAC Lucent Technologies 64+, 96, 128, 160 All bitrates are for a stereo pair. HW indicates a hardware implementation, while SW indicates a software implementation. t These codecs operated at a sampling rate of ~, = 32kHz. All other codecs operated at a sampling rate of ~,= 48kHz. For a codec operating at a fixed audio bandwidth and a fixed block length, a lower fi can provide better audio quality for signals requiring high frequency resolution, but can degrade the quality of signals requiring high temporal resolution. MPEG Layer 2 HW MPEG Layer 2 SW MPEG Layer 3
Table 1 Description of codec families and bitrates used in the tests. Unfortunately, codecs were not available at all bitrates for each codec family. The codecs listed in Table 1 were tested. The hardware implementation of the MPEG Layer 2 codec family was an Itis ML 2000. The software implementation of the MPEG Layer 2 codec family was developed through a combined effort of researchers at the Institut fiir Rundfunktechnik (IRT), the Centre Commun d’Etudes de T61t$diffusion et Tt%$communications (CCETT), and Philips. The Fraunhofer Institute for Integrated Circuits (FhG-IIS) provided both the MPEG Layer 3 and MPEG AAC codecs. The AAC codecs, which were main profile versions, did not have the intensity stereo and dynamic window shape switching components implemented. The AC-3 codecs were developed by Dolby Laboratories. The PAC codecs were provided by Lucent
2
Technologies. Technical descriptions of these codecs and perceptual audio codecs in general can be found in the literature [13-19]. In our request for codecs from the various proponents, we asked that codecs operating at bitrates of 128 kbps and above have a sampling rate of 48 kHz. This was done since it was felt that codecs operating at these bitrates would tend to be used in professional applications where a sampling rate of 48 kHz is commonly used for perceptual audio codecs. For lower bitrates, a sampling rate of either 32 or 48 kHz was requested since it is less clear how codecs operating at these bitrates will be used. Unfortunately, not all proponents were able to provide codecs which met this criterion. The actual sampling rates of the various codecs are given in Table 1. Since all of the codecs submitted by the proponents were software based, steps were taken to ensure that they were operating correctly at the CRC Audio Perception lab, A short audio sequence was encoded and decoded through each of the codecs by CRC staff. The reference audio sequence, the encoded bitstreams, and the decoded PCM files were then sent to the proponents. The proponents encoded and decoded the reference audio sequence and performed sample-by-sample comparisons of the fdes generated in their lab with the fdes supplied by the CRC lab. The files provided by the CRC lab were shown to be identical to those generated by the proponents, thus confirming that the software codecs were operating correctly.
2
TEST METHODS AND PROCEDURES
The procedures and methods detailed in the ITU-R recommendation for subjective testing of audio systems with small impairments (ITU-R Rec. BS.1116 [20]) were followed. This recommendation addresses the selection of critical audio test materials, the performance of the playback system (amplitlers, loudspeakers, etc.), the acoustic characteristics of the listening environment (reverberation and background noise), assessment of listener expertise, the grading scale used to indicate subjective evaluations, and the methods of data analysis. Further description of the implementation and the use of Rec. BS.1116 at the CRC Audio Perception Lab are outlined in several publications (e.g., [21-23]). 2.1
Selection
of Critical Materials
The selection of critical audio test materials is an important step in the process of evaluating perceptual audio codecs since codecs do not perform uniformly for all audio materials. That is, while a given codec may be effective at coding some audio materials, it may perform poorly for other materials. Therefore, since the goal of these tests was to evaluate the performance of the codecs under “worst case” conditions, an effort was made to fmd materials which would best reveal the limitations of each codec. The selection of critical materials was made by a panel of 3 expert listeners over a period of 3 months, The f~st step in the process was to collect potentially critical materials (i,e., materials which were expected to audibly stress the codecs). Sources of materials included items found to be critical in previous listening tests, the CRC’s compact disc collection and the personal CD collections of the members of the selection panel. Also, all of the proponents who provided codecs for the tests were invited to submit materials which they felt to be potentially critical. In order to limit the number of materials to be auditioned by the selection panel, an educated pre-selection was made regarding which materials were most likely to stress the codecs. This pre-
3
selection was based on our knowledge of the types of materials which have proven to be critical in previous tests, as well as an understanding of the workings of the codecs and thus their potential limitations. Also, consideration was given to providing a reasonable variety of musical contexts and instrumentations, A total of 80 pre-selected audio sequences were processed through each of the 17 codecs, giving the selection panel 1360 items to audition. The selection panel listened together to all 1360 items to find at least two stressful materials for each codec. The panel agreed on a subset of 20 materials (of the 80) which were the most critical ones and which provided a balance of the types of artifacts created by the codecs. A semi-formal blind rating test was then conducted by the members of the selection panel on these 340 items (20 materials x 17 codecs). These tests differed from the formal tests described in Section 2,3 in that the 3 members of the selection panel conducted the test at the same time, rather than individually. However, they did not discuss their ratings with the other panel members and thus they provided independent judgments. The results of the semi-formal tests were used to choose the final 8 critical materials used in the tests (see Table 2). In selecting the critical materials, consideration was given to highlighting various types of coding artifacts, The two most critical materials for each codec were included in these 8 materials. Code bascl
Description Bass clarinet arpeggio
Duration
Source
20 s EBU SQAM CD (track 17/Index 1)7 Bowed double bass EBU SQAM CD (track 1l/Index 1)+ 31 s Dire Straits dires Warner Bros. CD 7599-25264-2 (track 6) 30 s hpscd Harpsichord arpeggio 10 s EBU SQAM CD (track 40/Index 1) mrain Music and rain 11s AT&T mix pitchp Pitch pipe 30 s Recording from Dolby Laboratories trump Muted trumpet 10 s Original DAT recording, Univetxity of Miami vegla Susan Vega with glass 11s AT&T mix +Processing chain used Aphex Compellor Model 300 (set for leveling only) Dolby Spectral Processor Model 740 Aphex Dominator II Model 720 dbass
Table 2 List of audio test materials used in the subjective tests. 2.2
Experimental
Design and Stimulus Sequences
The eight critical audio materials were processed through each of the 17 codecs to yield 136 test items. The experiment used the highly efficient, within-subject (or repeated measures) design, which is known to eliminate the differential effects of individual differences among subjects. This meant that each subject was exposed to all 136 test items with the task of identifying coded from reference versions and assigning subjective ratings. Previous experience has established that about 45 trials per day, in 3 blocks of 15 trials with a substantial rest between blocks, is about the maximum that a subject can undergo without encountering fatigue problems that could detract from reliable subjective ratings. As a result, three days were required for each subject to rate the 136 test items (in 8 blocks of 15 trials and one block of 16 trials) included in the experiment. The distribution of codecs and audio materials within the blocks was such that any possible systematic temporal effects (e.g., fatigue, warm-up effects, etc.) were eliminated statistically. This
4
ensured that the sequences as arranged yielded equally fair exposure of all the codecs to the subjects so that no codec or codec-material combination in the experiment was advantaged or disadvantaged. Moreover, as stated earlier, part of the process of selecting critical materials included a blind rating by the selection panel of the 20 most critical items. This provided an estimate of the dfilculty of each of the 136 trials. This knowledge was used in the derivation of the 9 blocks of trials so that, as much as possible, the blocks were equally difficult. Further details regarding the ordering of test items are provided in Appendix 1. 2.3
Experimental
Subjects and Procedures
A total of 24 subjects (20 male and 4 female) participated in the tests, Subjects were sought mostly from groups where it was expected that listeners with high expertise would be found. For the present experiment, the subjects included 7 musicians of various kinds (performers, composers, students), 6 recording and broadcast engineers, 3 piano tuners, 2 audio codec developers, 3 other types of audio professionals, and 3 persons from the general public. The basic experimental procedures used in the tests have been discussed in detail elsewhere [21-23]. These consisted of (i) a thorough initial training process in groups of 2 subjects, conducted on the morning of each day, which included familiarization with all the materials that would be blind rated in the afternoon of that day; (ii) individual double-blind rating sessions of 3 blocks of trials during the afternoon of each day. Trials were completely subject-paced and long rest breaks were provided between blocks; (iii) the use of a 5 category, 41 grade continuous scale for quantitative expression of perceived subjective quality. (see Fig. A2.2) Both loudspeakers and headphones were available to listeners and they were free to use either, alternating among them as often as they wished, within or between trials. The playback level was held relatively fried with subjects being allowed only a 6 dB range within which to vary the level. A more detailed description of the grading scale and experimental procedures is provided in Appendix 2. 3
RESULTS
In this section the results of the subjective tests are examined, The discussion begins with an assessment of subject expertise and is followed by an analysis of the performance of the 17 codecs. 3.1
Subject Expertise
The adequacy of each subject to provide reliable ratings was assessed using the method outlined in ITU-R Recommendation BS.1116 as well as in several previous publications (e.g., [21-23]). In the tests, subjects were required to identify the hidden reference and to provide a grade for the coded test item. The subject expertise assessment used the statistical t-test to compare the distribution of a subject’s grades for the actual coded versions, with his or her grades for the actual reference versions. If these two distributions of grades for a subject are not
5
significantly different from each other, then it is assumed that the subject was guessing rather than adequately discriminating correctly between coded and hidden reference versions across all trials. In this case, the subject’s data are discarded since that data would contribute noise rather than meaningful results. With this criterion, the data from 3 subjects were discarded leaving 21 subjects for the fiial analysis. See Appendix 3 for further details regarding assessing subject expertise.
3.2
Codec Performance
Outcomes of the experiment are shown in the following seven graphs. The error bar magnitudes in the figures are based on an ANOVA (analysis-of-variance) which evaluated the main effect of codecs and the interaction between codecs and audio materials. (The main effect of audio materials is of no interest and is not presented here.) Any two data points are statistically different (p < 0.05) if their error bars do not overlap, while overlapping error bars indicate that the data points must be considered statistically identical. The ANOVA corrects for sampling fluctuations which yield variance differences among the individual data points in the raw, unanalyzed data. Hence, unlike the misleading descriptive picture which would emerge if error bars were based on raw data rather than on the ANOVA outcomes, the analytic error bars for codecs (averaged across all 8 test materials) are constant (* O.111) throughout the graphs, as are those for audio-material/codec combinations (~ 0.237). In other words, our data resolution is 0.222 (i.e., O.111 x 2) of a diffgrade for codecs, and 0.47 (i.e., 0.237 x 2) for audio material/codec combinations.
3.2.1
Overall Quality by Codec Family
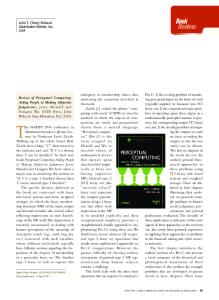
In this section, the results of the subjective tests are analyzed with respect to the overall quality of the codec families. The overall codec performance is examined in Fig. 1 and Fig. 2. Whereas the graph in Fig. 1 focuses on codec families, the graph-table of Fig, 2 allows the statistical differences among individual codecs to be seen more clearly. In Fig. 1, the horizontal axis indicates the bitrate while the vertical axis indicates the overall mean rating (averaged across all 21 subjects for all 8 audio materials) from the subjective tests. The unit of measure for the vertical scale is the diffgrade which is equal to the subject rating given to the coded test item minus the rating given to the hidden reference. Therefore, a diffgrade near 0.00 indicates a high level of quality, while a diffgrade near -4.00 indicates very poor quality. The diffgrade scale is partitioned into 4 ranges, “not annoying”, “slightly annoying”, “annoying”, and “very annoying”. Further discussion regarding the use of diffgrades is found in Appendix 2. It is apparent from the figure that, as expected, the performance of each codec family improves monotonically with increasing bitrate. It is also apparent that the codec families are clearly delineated with respect to quality, The ranking of the codec families with respect to quality is: AAC, PAC, L III, AC-3, L II, and ITIS. It must be noted however, that the ranking of (Further the L III family is somewhat speculative since it was tested at only one bitrate. information regarding the performance of the PAC codec family is found in Appendix 4.) The results at the 128 kbps bitrate allow a direct comparison of all of the codec families since each was tested at this bitrate. At this bitrate, the AAC codec outperforms the rest of the codecs.
6
The PACcodec isnext, fahgonthe boundary between ``not anno~g'' and``anno@g''. The L III codec is near the bottom of the “slightly annoying” range. The AC-3, L II, and ITIS codecs perform identically at this bitrate and are in the “annoying” range. It is also interesting to note the consistent improvement in quality of the three generations of MPEG codecs. The MPEG Layer II codec family has the poorest performance, but is the least computationally demanding. The MPEG Layer III codec has intermediate performance and an intermediate level of computational complexity. Finally, the AAC codec family, which has only recently become an MPEG standard [7], offers the best audio quality but at the expense of a signflcant increase in computational complexity. While there is a clear tendency for the software L II codec family to rate higher than the hardware based ITIS codec family, they are in fact not statistically different in their ratings.
3.2.2
Overall Quality by Individual Codec
In this section, the results of the subjective tests are examined with respect to the overall quality of each of the individual codecs. The results are summarized in a novel graph-table (Fig. 2) which simultaneously allows the reader to compare codecs in terms of quality and bitrate. The graph-table also summarizes other aspects of codec performance across audio materials as discussed below. The rows of the graph-table are used to place the codecs into statistical groups. Therefore, codecs which are virtually identical to each other in overall subjective quality appear together within a horizontal grouping (row). The columns of the graph group the codecs according to bitrate, thus making it easy to compare codec audio qualities for a given bitrate, or the bitrates required for a given level of audio quality. The fourth and ftith columns of the table indicate the “number of transparent items” and the “number of items below -1.00” respectively as described in the next section. These two measures are used in the ITU-R context as an additional means of differentiating codec performance. The “number of transparent items” denotes for a given codec, the number of audio materials for which the error bar crosses the 0.00 diffgrade value. The “number of items below -1.00” indicates for a given codec, the number of audio materials which had a mean score below -1.00. It is apparent that, with respect to audio quality, 8 different equivalence-groupings emerge. In order of merit, these are: (1) (2) (3) (4) (5) (6) (7) (8)
AAC/128 and AC3/192, PAc/160, PAC/128, AC3/160, AAC/96, Layer 11/192, ITIS/192, Layer 111/128, Layer 11/160, PAC/96, ITIS/160, AC3/128, Layer 11/128 and ITIS/128, PAC/64, and ITIS/96.
Only in the cases of groups 2 (PAC/160) and 4 (ITIS/192) is there a slight overlap, in both cases with one or two members of group 3. However this overlap is very slight for groups 2 and 4 in comparison with the whole of group 3 where the overlaps are complete among all 4 of the
7
codecs. Thus, the conclusions regarding the existence of 8 groupings are entirely justified by considering means and statistical errors alone. The other data in the graph-table which summarizes each codec’s performance at its best (i.e., number of transparent items) and at its worst (i.e., number of items below - 1.00) do not alter the groupings. It is instructive to examine merit group 3 in some detail since most of the software-based codec families have a codec in this group. An important point to note is that the codecs in this merit group are all operating at different bitrates. More speciilcally, for this level of subjective quality, the AAC codec family requires a bitrate of 96 kbps, while the PAC codec family requires a bitrate of 128 kbps. The AC-3 codec family requires a bitrate of 160 kbps and the Layer II codec family must operate at a bitrate of 192 kbps. Therefore, there is a signitlcant difference in the bitrates required in order to achieve the same level of subjective quality. For example, the AAC codec provides the same subjective quality as the Layer II codec, but with a reduction in bitrate of 96 kbps. Another region of interest in the graph-table is the range encompassing merit groups 1 and 2 since these codecs provide the highest level of audio quality in these tests. The AAC/128 and AC3/192 codecs provide equivalent subjective performance, but the AAC codec does so at a signiilcantly lower bitrate (lower by 64 kbps). The subjective quality of the PAC/160 codec is slightly lower than the AAC/128 and AC3/192 codecs, but has an intermediate bitrate. Unfortunately, from these tests, it is not possible to know the bitrate at which the PAC codec family’s performance would be equivalent to the codecs in merit group 1. (Further information regarding the performance of the PAC codec family is found in Appendix 4). The AAC/128 codec is the only codec tested here that meets the quality requirements defimed by the ITU-R Recommendation BS.1115 [8] which specifies the requirements for perceptual audio coding systems for broadcast applications. Recommendation BS.1115 requires that there are no audio materials rated below -1.00. Of note, the AC3/192 codec comes close to meeting the requirement, but falls short due to the pitchp test item which has a mean diffgrade just below 1.00 as will be seen in the next section.
3.2.3
Quality of Each Audio Material by Individual Codec
Figure 3 presents the results for the two codecs of the AAC family and the Layer III codec. The overall superiority of the AAC/128 (i.e., AAC at 128 kbps per stereo pair) codec is evident (top group of 8 in the graph-table, Fig. 2). It can be seen that no mean grade for any audio item for this codec falls below a diffgrade of -1.00. In other words, for all materials, on average, this codec is rated as producing only “not annoying” distortions. In only one instance (nzrain) does the lower error bar dip below -1.00, and then, only very slightly so. And, at the “transparent” end, the error bar for vegla encompasses 0.00 (“imperceptible”). The other member of this AAC family, AAC/96 (merit group 3 in Fig. 2) bears a general family resemblance to AAC/128 in that some of the rises and falls across materials are similar for both codecs. But AAC/96’s lesser rank is obvious with only 3 of 8 means above -1.00, while the others are in the “slightly annoying” range between -1.00 and -2.00. The L 111/128 codec (merit rank 5 in Fig. 2) has two audio items in the top “not annoying” range, but 4 materials are below -2.00, in the “annoying” and “very annoying” range. Its performance varies widely depending on the audio material.
8
Figure 4 presents the 4 members of the PAC family. The best codec here, PAC/160, remains overall within the “not annoying range” but an excursion into the “annoying” range for bascl, and into the top of the “slightly annoying” area for a few items (hpscd and rnrain) keeps it overall just above -1.00 (merit group 2 in Fig. 2). It’s good performance on the four items which are well above the -1.00 border, including one transparent item (dires), accounts for its overall “not annoying” performance despite the poorer performance on other items. A strong family resemblance is evident between PAC/160 and PAC/128, with very similar weaknesses and strengths among the audio materials. The overall diffgrade for PAC/128 (merit group 3 in Fig, 2) is only slightly below PAC/160. PAC/96 (merit group 5 in Fig. 2) also shows the family resemblance, but descends to an overall level just above -2.00 at the lower end of the “slightly annoying” range. For all of these 3 PAC members, the variance across audio materials within each codec is larger than was seen for the AAC and will be seen for the AC-3 family. PAC/64 (merit group 7 in Fig. 2) no longer shows the family pattern and straddles the 3.00 border between “annoying” and “very annoying” across all items. This was the only codec tested at this lowest bitrate. (Further information regarding the performance of the PAC codec family is found in Appendix 4.) Figure 5 shows the results for the AC-3 family. The best codec in that family, AC3/192 (merit group 1 in Fig. 2) shows one “transparent” item (dbass), but the pitchp mean score falls into the “slightly annoying” area. The other 6 items are comfortably within the “not annoying” range, with no lower error bar protrusions below -1.00. As is clear in the figure, AC3/160 (merit group 3 in Fig. 2) fares somewhat worse, The mean ratings across audio materials fluctuate between the “not annoying” and “slightly annoying” ranges and remain overall near the top of the “slightly annoying” range. The AC3/128 codec (merit group 6 in Fig. 2) has poorer performance and dips into the “annoying” range. In general, the performance pattern of the AC-3 codecs is quite consistent across audio materials. The Layer 11 family is shown in Fig. 6. All codecs in this family exhibit large variations in ratings among audio materials. The L 11/192 codec (merit group 3 in Fig. 2) is the best in the family, with two items in the middle of the “not annoying” range and one item at the top of the “annoying” range. The other two codecs in this family, L 11/160 and L 11/128 (merit group 5 and 6 in Fig. 2) show overall family similarities to L 11/192 among items, especially in the low ranking pitchp material, but also in the up and down pattern among the other items. The two highest ranking codecs in this family (LII/192 and LII/160) are in the higher and lower parts of “slightly annoying” respectively, while overall L 11/128 falls into the upper part of “annoying”. Figure 7 shows the results for the ITIS family. Overall, the ITIS/192 (merit group 4 in Fig. 2) falls in the middle of the “slightly annoying” range with ITIS/160 (merit group 5 in Fig. 2) staying within the same range but just above -2.00 overall. ITIS/128 (merit group 6 in Fig. 2) is similar to the other two but falls below -2.00 into the “annoying” area. All three of these codecs resemble each other quite strongly, showing large variations in ratings across audio materials. The family resemblance no longer holds for the lowest ranking codec in this family, ITIS/96 (merit group 8 in Fig. 2) which is both overall and for most of the items, in the “very annoying” range.
9
4
CONCLUSIONS
In this paper, the results of double-blind subjective tests evaluating the audio quality of 6 state-of-the-art codec families against a CD-quality reference were presented. The study is unique since this is the fust time in which of all of these codecs have been compared in a single formal test. The codecs operated at bitrates between 64 kbps and 192 kbps per stereo pair. The tests examined the performance of the codecs under “worst case” conditions and were conducted in accordance with methodologies outlined in ITU-R Recommendation BS.1116 [20]. Consequently, the results obtained provide an estimate of the “worst case” quality for each codec. The tests yielded clear results which permit the comparison of the overall quality of the codecs with a resolution of 0.222 (i 0,111) of a diffgrade. The results show that the codec families are clearly delineated with respect to quality. The ranking of the codec families with respect to quality is: AAC, PAC, L III, AC-3, L II, and ITIS. It must be noted however, that the ranking of the L III family is somewhat speculative since it was tested at only one bitrate. The highest audio quality was obtained for the AAC codec operating at 128 kbps and the AC3 codec operating at 192 kbps per stereo pair. The following trend is found for codecs rated at the higher end of the subjective rating scale. In comparison to AAC, an increase in bitrate of 32, 64, and 96 kbps per stereo pair is required for the PAC, AC-3, and Layer II codec families respectively to provide the same audio quality. (Further information regarding the performance of the PAC codec family is found in Appendix 4). The AAC codec operating at 128 kbps per stereo pair was the only codec tested which met the audio quality requirement outlined in the ITU-R Recommendation BS.1115 [8] for perceptual audio codecs for broadcast applications (i.e., none of its test items had a mean grade below 1.00). The tests reported in this paper only considered audio quality with respect to bitrate. Other factors such as computational complexity, delay, sensitivity to bit errors, and compatibility with existing systems usually need to be considered in the selection of a suitable codec for a particular application. 5
ACKNOWLEDGMENTS
The authors would like to thank the codec proponents at CCETT (France), Dolby Laboratories (USA), FhG-IIS (Germany), IRT (Germany), Lucent Technologies (USA), and Philips (The Netherlands) for their participation and cooperation in these tests. The authors would also like to thank Darcy Boucher and Roger Soulodre for their efforts in selecting the critical materials.
10
APPENDIX
1 ORDERING
OF TEST ITEMS FOR BLIND RATING SESSIONS
In the tests, the 136 audio material/codec combinations were arranged in 9 blocks of trials (8 blocks of 15 trials and 1 block of 16) so that the 17 codecs were equally distributed in orderings which were as unsystematic as possible as to the speciilc codec on any trial. While the ordering of the 17 codecs was completely unpredictable to the subjects, the ordering of the 8 audio materials (i.e., bascl, dbass, dires, hpscd, mrain, pitchp, trump, vegla) was (nearly) the same for each block. In the one block containing 16 trials, each of the 8 audio materials occurred once on consecutive trials and they were repeated in the same order in the next group of 8 trials. The same ordering of audio materials was also used in each of the blocks containing 15 trials, except that one material was omitted from the bottom half of each block. The omitted audio material was different for each of these 8 blocks. Thus, the ordering of the audio materials was predictable within each block, whereas the identity and ordering of the codecs was unpredictable across trials. To statistically eliminate any possible systematic temporal effects (e.g., fatigue, warm-up effects, etc.), each subject rated the 9 blocks of trials in a different temporal sequence. To provide a unique sequence for each subject, the blocks were arranged into 3-day groups of 3 blocks per day (days “A “, “B”, and “C”). Within each day, the three blocks were designated “i”, “ii” and “iii”. Thus, there were 6 possible day orders (“A “, “B”, “C”; “B”, “C”, “A”; etc.) and 6 possible block orders (“i”, “ii”, “iii”; “ii”, “iii”, “i”; etc), giving 36 (6 x 6) unique sequences. Past experience from similar experiments conducted at the CRC Audio Perception Lab has shown that, given our pre-screening and training procedures, no more than about 25 subjects are needed to obtain statistically significant results. Therefore, the 36 unique sequences were sufficient to deal with the audio material/codec combinations in a manner which would expose them fairly across subjects from a statistical viewpoint, APPENDIX A2.I
2 GRADES AND DIFFGRADES
Grades
A computer enabled the subject to instantaneously switch among any one of three versions of an auditory stimulus (see Fig. A2. 1) on each trial (using either the 3 buttons on the mouse, or by selecting the graphical buttons on the screen). Selecting button “A” on the screen produced the reference stimulus, which was always known by the subject to be the CD-quality version of the audio material for the current trial. Clicking on button “B” or “C” produced either a hidden reference, identical to “A”, or else a coded version of the same audio material. Which of “B” or “C” produced the hidden reference or the coded version was unknown and unpredictable to the subject from trial to trial. The subject’s task on each trial was to identify the coded version (on “B” or “C”) and to grade its quality relative to that of the reference on “A”. In the continuous grading scale used by the subjects, 1 to 1.9 represented an evaluation of varying degrees of a “very annoying” judgment, 2,0 to 2.9 covered the “annoying” range, 3.0 to 3.9 meant “slightly annoying”, 4.0 to 4,9 was for judgments of “perceptible but not annoying”, and 5,0 indicated “imperceptible” (see Fig. A2.2). This is, in effect, a 41 grade continuous scale, with 5 categorically labeled groupings for ease of orientation and to aid rating consistency throughout the experiment.
11
The version judged to be the hidden reference (on’’C” or’’B”) was given a grade of 5.0 ~`tiperceptible'') sothaton eachtrial onegrade hadtobe``5.O''. Thesubject wasnot allowed to assign a “5.0” to what he or she thought was the coded version of the audio material. If the subject could not detect a difference between the “B” and “C” stimuli (i.e. where both appeared identical to “A”), the subject was instructed to guess which one was coded and to give it a grade of 4.9. While subjects used the scale as described and as shown in Fig. A2.2, for purposes of analysis and presentation of results, the subject’s scale was transformed as described in the next subsection (A2.2 below). During the blind-rating phase, each subject was free to take as much time as required on any trial, switching freely among the three stimuli as often as desired. The audio material on each trial was 10 to 30 s long. The audio materials within a trial were time-synchronized so that the crossfade when switching among “A”, “B“ and “C” was subjectively seamless. Rather than listen to the entire 10 or 30 s of an audio material, subjects could choose to “zoom in” on any segment of the audio material. On each trial, under the subject’s control, audio materials could loop (repeat) continuously or not, regardless of whether the subject was listening to the entire material length or to a zoomed segment. A2.2
Diffgrades
Although subjects assign their ratings using the grading scheme shown in Fig. A2.2, a transformation of this scale into diffgrades is used throughout the presentation of results in this paper. There are two grades involved on each trial. The subject identifies which stimulus is the coded version of the audio material and assigns it a grade between 1.0 and 4.9. The stimulus which the subject identiiles as the hidden reference is thereby implicitly assigned a grade of 5.0. Therefore, these two grades are interdependent since once the subject has identified the coded version and given it a grade, the grade for the hidden reference is fixed. Since the grades given to stimuli “B” and “C” on each trial are interdependent and since subjects do make errors of identtlcation, it would be misleading to report and analyze only the grade for the actual “coded” items since the information contained in the grade given to the hidden reference is lost. Diffgrades retain all information regarding each trial by subtracting the grade for the stimulus identified by the subject as the hidden reference from the grade for the stimulus ident~led as the coded item. This direction of subtraction (coded minus hidden reference) is chosen since, when plotted in a graph, the diffgrades appear in the same Cartesian quadrant as a graph which does not use the transformation. Correct identflcation of the coded item yields a negative (-0.0 1 to -4.00) diffgrade, while incorrect identification produces a positive (i.e., 0.01 or higher) diffgrade. Diffgrades can thus be viewed as a measure of the distance of the actual coded stimulus from “transparency”. Since only the data of those subjects who show sufficient expertise are retained, the expected number of rnisidentifled stimuli is usually small. Moreover, most rnisidenttilcations occur in the more difficult discriminations of the “not annoying” range of codec/audio material combinations, and so the transformed scale does little to change the “meaning” of the grades associated with the equivalent pre-transformed scale numbers. That is, raw scores given by subjects in the range from 4.9 to 4.0 are nearly equivalent to diffgrades in the range from -0.01 to -1.00. Subject scores in the “slightly annoying” range (3.9 to 3.0) correspond even more directly to diffgrades between -
12
1.01 to -2.00, and so on, down to an equivalence between a pre-transformed 1.0 and a transformed -4.00, Items which on average yield more errors than correct identifications (as would be trueby chance for 50% of “transparent” items, where expert subjects could not reliably discriminate coded from hidden reference) provide positive diffgrades, while all negative diffgrades indicate correct identtilcation of the coded stimuli on average across subjects. Average positive diffgrades do not deviate very far from 0.00 due to high subject expertise, and “transparent” items are those lying within expected statistical error around 0.00. APPENDIX
3
SUBJECT
EXPERTISE
The present experiment had one characteristic which required a special modification to the method outlined in several publications [20-23] for assessing subject expertise. All the previous experiments conducted in the CRC Audio Perception Lab included mostly perceptual audio codecs which were of very high quality. In the present case, since several of the codecs operated at low bitrates, many of the test items processed by these codecs were easy to discriminate even by subjects with expertise that was inadequate for the more difficult subset of items. Given this, the magnitudes of the t-scores used to assess subject expertise were artificially inflated by the presence of these easy items, and a statistical assessment based on these values would not serve to sufficiently differentiate subject expertise (N.B. a higher magnitude t-score implies a higher level of expertise). Indeed, where a t-score of 2.00 is normally the minimum acceptable indicator of sufficient expertise, the t-scores for the 24 subjects who participated in the tests ranged from 5.16 to 26.74 over all the 136 items in the experiment. This contrasts sharply with the more usual range of approximately 2.0 to 10.00 obtained in previous experiments in our lab. Since those material/codec combinations which were the most difficult to discriminate were the crucial ones where sufficiency of expertise mattered most, the t-tests were recalculated using only those items that on average across all 24 subjects received diffgrades no lower than -1.00 (i.e., only items that were in the “perceptible but not annoying” diffgrade range). There were 49 such items, 36% of the 136 total. The t-scores of subjects over those 49 items ranged from 0.54 to 12.49, which is comparable with previous experiments where only higher bitrate codecs were compared. Using the same cut-off point of 2.00 (for a two-tailed test at a 0.05 signitlcance level), three subjects did not qualify as sufilciently expert on those 49 items. The data for those subjects were omitted from further analysis, leaving 21 subjects. The t-scores of all 24 subjects on the full set of 136 items and on the subset of 49 items are shown in Table A3. 1, with gray shading indicating the discarded subjects and with all the t-scores shown as algebraically positive. As would be expected, the correlation between the two sets oftscores for all 24 subjects (those based on 136 items, and those for 49 items) was very high (r = 0.89), and so the rank ordering of subjects was almost identical. Therefore, the t-test based on 49 items served only to reveal which of the subjects were inadequate by the more stringent criterion and did not appear to introduce any other distortions.
13
Submiect 1
2 3 4 5 6 7 8 9 10 11 12 13 14 15 16 17 18 19 20 21
t (136)
t (49)
26.74 19.67 16,98 17.02 20,13 15.50 16.58 19.11 18.95 12.99 14.52 14.05 13.70 12.31 13.79 13.50 11.81 12.94 12.93 10.30 12.64
12,49 9.73 9,02 8.31 6.95 6.54 5.78 5.78 4.91 4.14 4.01 3.84 3.75 3.71 3.70 3.59 3.33 2.87 2.78 2.40 2.03
Table A3.1 t-scores for the 24 subjects who participated in the tests.
APPENDIX
4
FURTHER INFORMATION
ABOUT THE PAC CODEC FAMILY
Following the completion of the subjective tests, Lucent Technologies indicated that the poor performance of the PACcodecs forthebascl audio sequence might be due to a programming bug. However, at the time of publication, the existence of a bug in the PAC codecs had not been shown. It is important to note that, regardless of how the PAC codecs may have performed for Zmscl in the absence of the presumed bug, the relative overall ranking of the codec families would remain unchanged.
14
6 [1]
U.S. Advanced Television Systems Committee, “Digital Audio and Ancillary Services for an Advanced Television Service,” Dec. T3/186 Feb. 1992.
Data
[2]
Audio Coding for Digital Terrestrial Television Broadcasting, ITU-R Recommendation BS.1196 (1995).
[3]
Radio Broadcast Systems; Digital Audio Broadcasting (DAB) to Mobile, Portable and Fixed Receivers, Final Draft pr ETS 300401, European Telecommunications Standards Institute, Nov. 1994.
[4]
Systems for Terrestrial Digital Sound Broadcasting to Vehicular, Portable and Fixed receivers in the Frequency Range 30-3,000 MHz, ITU-R Recommendation BS.1114-1 (1995).
[5]
Coding of Moving Pictures and Associated Audio for Digital Storage Media at About 1.5 Mbit/s, ISO/MPEG- 1 Standard 11172, Part 3 Audio, 1992.
[6]
Generic Coding of Moving Pictures and Associated Audio Information, lSO/MPEG-2 Standard 13818, Part 3, Audio, 1994.
[7]
Generic Coding of Moving Pictures and Associated Audio Information, lSOIMPEG-2 Standard 13818, Part 7, Advanced Audio Coding (AAC), 1997.
[8]
Low Bit Rate Audio Coding, ITU-R RecommendationBS.1115.
[9]
T. Grusec, and L. Thibault, CCIR Listening Tests: Basic Audio Quality of Distribution and Contribution Codecs (Final Report), Document submitted to the CCIR TG 10/2 (dot. 24), Geneva (Switzerland), Nov. 1992.
[10]
L. Thibault, T. Grusec, and G. Dimino, CCIR Listening Tests: Network Verification Tests Without Commentary Codecs (Final Report), Document submitted to the CCIR TG 10/2 (dot. 43), Geneva (Switzerland), Oct. 1993.
[11]
L. Thibault, T. Grusec, S. Lyman and G. Dimino, “Audio Quality in Digital Broadcast Systems”, The Sound of 2000, Proceedings of the Second International Symposium on Digital Audio Broadcasting, Toronto, Canada, 14-17 March, 1994, pp. 406-420.
[12]
T. Grusec, L. Thibault, and G. Soulodre, EIA/NRSC DAR Systems Subjective Tests, Part I: Audio Codec Quality, IEEE Transactions on Broadcasting, Vol. 43, No. 3, Sept., 1997, pp. 261-267.
[13]
N. Jayant, J. Johnston, and R. Safranek, “Signal Compression Based on Models of Human Perception”, Proceedings of the IEEE, vol. 81, no. 10, pp. 1385-1422, Oct. 1993.
15
[14]
P. Nell, “Wideband Speech and Audio Coding”, IEEE Communications Magazine, pp.
34-44, Nov. 1993. [15]
P. Nell, “MPEG Digital Audio Coding”, IEEE Signal Processing Magazine, pp. 59-81, Sept. 1997.
[16]
K. Brandenburg and G, Stoll, “ISO-MPEG- 1 Audio: A generic standard for coding of high-quality audio”, Audio Eng. Socie~ Journal, vol. 42, no. 10, pp. 780-792, Oct. 1994.
[17]
K. Brandenburg and M, Bosi, “Overview of MPEG Audio: Current and Future Standards for Low-Bit-Rate Audio Coding”, Audio Eng. Society Journal, vol. 45, no. 1/2, pp. 4-21, Jan/Feb. 1997.
[18]
L. D. Fielder, M. Bosi, G. Davidson, M. Davis, C. Todd, and S. Vernon, “AC-2 and AC3: Low Complexity Transform-Based Audio Coding”, in AES Collected Papers on Digital Audio Bit-Rate Reduction, pp. 54-72, 1996.
[19]
J. D. Johnston, D. Sinha, S. Dorward, and S. R. Quackenbush, “AT&T Perceptual Audio Coding (PAC)”, in AES Collected Papers on Digital Audio Bit-Rate Reduction, pp. 7382, 1996.
[20]
Methods for the Subjective Assessment of Small Impairments in Audio Systems Including Multichannel Sound Systems, ITU-R RecommendationBS.1116 (1994).
[21]
T. Grusec, L. Thibault, and R. Beaton, “Sensitive methodologies for the subjective evaluation of high quality audio coding systems”, Proceedings of the AES UK DSP conference, London, 14-15 Sept. 1992, pp. 62-76.
[22
T. Grusec, L. Thibault, and G. Soulodre, “Subjective evaluation of high quality audio coding system Methods and results in the two-channel case”, AES preprint 4065, AES 99’”convention, Oct. 6-9, 1995, New York.
[23
T. Grusec, “Subjective Evaluation of High Quality Audio Systems”, V.22, No. 3 pp. 5758 of Canadian Acoustics, Sept. 1994.
16
0.00 -0.20 .0.40
0.00
.... ......... T
.. ...,, .,,,... .
-0.20 -0.40 -0.60
.0.60
G ~ m a) c) c
a) & K cc (n f a)
% b)
-0,80
.0.30
-1.00
-1.00
-1.20
-1,20
-1.40
,1.40
-1.60
-1,60 -1.80
-1.60
-2.00 .2.20
................ ....... .......... .. .
/’
-2.00
f .........................
. . ..
.2.20 -2.40 .2,60 -2,60
-3.00 -3.20 -3.40
-3.40
-3.60
-3.60 -3.30
. . . ........ . . . . ...
........... . .
.
-3,80
-4.00
-4.00 64
96
128
160
192
Figure 1 Comparison of overall quality by codec family.
17
0.00
—
—
—
G;;:rSOrI
-0.20 .0.40
g p al
a) g g a) ~
T
-1.00
ic
-1.20
1
AACI126 AC31192
-0.47 -0,52
1 1
0 1
2
PAC/i 60
-0.62
1
3
L II
3
PAC/128 AC31160 AAC19S L 11/192
-1.03 -1.04 -1.15 -1.18
1 0 0 0
4 4 6 6
~rrls
4
lTIS/192
-1.36
0
6
5
L 111/126 L 11/160 PAC196 lTIS/160
-1.73 -1.75 -1.63 -1.84
0 0 0 0
6 7 6 6
6
AC31128 L 11/128 lTIS/126
-2.11 -2.14 -2.21
0 0 0
6 6 7
7
PAC164
-3.09
0
6
6
ITIS196
-3.32
0
8
— —
-1.60
i —
-1.80
g
s m
:3 +
-1.40 Ill
U-J
Sya/kbps
hc
-0.80
-2.00
L II
IJ ITIS
k“
-2,20
b
No. of Iteme Below -1,30
Merit
‘1 —
-0.60
Diffgrade
No. of Transparent Items
-2.40 -2.60 -2,60
-3.00 —
-3,20 -3,40 -3.6o -3,80
-4.00
—
64
96
—
—
128
160
192
Bitrate (kbps)
Figure2
Comparison ofresults ofsubjective tests foral1codecs.
18
0.40
0,40
T 7$ ml
0.20
0.20
0.00
0.00
.0.20
.0,20
-0.40
.0.40
.0.60
.0.60
-0.80
.0.80
h a) rJ $
-1.00
-1.00
b
-1.20
-1.20
-1.40
-1.40
-1.60
-1.60
% m % > + i-!
01 -0 %
-1.s0
-1.80
-2.00
-2.00
.2.20
-2.20
-2.40
-2.40
&
.2.60
-2.60
4 m b a= .cl
-2.80
.2.80 -3.00
-3.00
-3.20
-3.20
-3.40 -3,60
-3.60
-3,80 -4.00
-4.00 baacldbaaa
diraa
hpacdmrain
Audio
Figure3
pitchptrumpvegla
SyS. Avg.
Materials
Results ofsubjective tests forthe MPEGLayer IIIand MPEGAACcodec families.
19
0,40 0.20
G-
r 0.40
T
. ..... .
4., ...................................1
.
0.20
0.00
0.00
-0.20
-0.20
-0.40
-0,40
-0 m .0.60 b .0,80 0 0 c -1.00 C3) & .1,20 % m -f .40 OY -1.60 $ -1 .ao % P -2.00 C21 -2.20 -0
.0,60 .0.00 -1.00 .1,20 .1.40 -1.60 .1,80 -2.00 -2.20
%
-2.40
.2.40
g
-2.60
-2.04 .2.80
.2.80
% (u b -3.00 3= ,n .3.20
-3.00 .3,20 -3,40
.3,60 -3,80 -4.00
.
J
... . . t bascl
, dbass
u
dirss
hpscd
Audio
Figure4
1
,
,
,
,
mrain
.3,60
... . pitchptrump
vegla
. I
.3,80 t -4.00
SyS. Avg.
Materials
Results ofsubjective tests forthe PACcodec family.
20
0,40
1....,...
0,20
T
m (u &l a)
.....
................ T
.. ..
0,40
.....
0,20
0.00
0.00
.0,20
.0.20
.0.40
.0.40
F~~”””/+””””Ac3’: g21””~
.0.60
.0.60 .0.80
-0.80
r-l
$ -1.00 b -1.20
x cc 03 $ al ?
-1.00 -1.20
-1.40
-1.40
-1.60
-1.60 -1,60
.1,80
-2.00
-2.00
0-1 -2.20 -0 % -2.40 g -2.60
.2,20 .2.40
.2.60 . . .. . . . . . . . . . . . . . . .. . . . . . . . . . . ..,,, L . . . . . . . . . . . . . . . . . . . . . . . . . . . . . . . . . . . . . . . . . . . . . . . . . . . . . . . -2.80 $03 “ ~ -3.00 b -3.00 Y= .-3.20.,. ................................................................ . .3.20 n . . ... .... . . . .. -3.40 -3.40 Vwymnoyhg
-3,60..........$ ............................................................
-4.00
-
- .3.60
.......
.3.80 L
1 baacl
dbass
diraa
1
hpscd
Audio
Figure5
.
mrain
1
,
pitchptrump
a vegla
..... ,
-3.80 .4.00
SyS. Avg.
Materials
Results ofsubjective tests forthe AC-3 codecfami1y.
21
0,40 ,,20,
....
,,, ,,,
..,.
................
.
........ ..
.. . . . .
0,20 t
0.00 .0,20
‘a
-0,40
.0,40
u m .0,60 b .0,00 m 0 c -1.00 al
3 Y) cc rn $
.0.60 .0.80 .1.00
-1,20
-1.20
-1,40
-1.40
-1,60
-1.60 -1.80
-1,80 % !!? -2,00 Cn .2,20 u
-2.00 .2.20
s
-2,40
.2.40
g
-2.60
-2.60
+3 id
.2,80
5-I -3.00 a= .-3.20 n
-4.00
.2.80 -3.00
. ............................. .
J
+
, bascldbass
...............p..
...........
dires
,
.. .
,
,
hpscdmrain
....
pitchptrumpvegla
t
I
-3.20
-4.00
Sys. Avg.
Audio Materials
Figure 6 Results of subjective tests for software implementation of MPEG Layer II codec family.
22
0.40
0,40
- 0.20
..........................................................................
0.00 3
-0 ~ m a)
0 c
a)
0.00
‘T’
T
.0,20
.0.20
.0.40
.0.40
.0.60
-0.60 -0.80
.0.80
-1.00
& % w
-1.00
-1.20
-1,20
-4.40
.<,40
.1.60
-1.60
m
S
-1.80
-1.00
-2.00
-2.00
$ !!!
m u %
-2,20
.2.20
-2.40
.2.40
g
.2,60
-2.60
43 a
.2,80
-2.80 -3.00
b -3.00 Y= .— -3.20 a
.3.20
-3.40
-3.40
-3,60
.3.60
i'''' """'l'''''' ''''' ''''' ''''' ''''' '''"''~'''''"l'' ''''"''""'""'''''''"'''''''''""'"'''''''"'''''''"'"t I
.3.S0 -4.00 J
.3,80
‘J
!
,
bascl
dbass
dires
hpscd
Audio
mrain
pitchptrump
!
vegls
,
.4.00
SyS. Avg.
Materials
Figure 7 Results of subjective tests for ITIS hardware-based codec family.
Fig. A2.l
Computer screen used bylisteners tocontrol playback and switching.
23
5.0
18 XJ 4.4 4.3 4,2 4.1 4.0 3.9 3,8 3.7 3.6 3.5 3.6 3.3 3.2 3.1 3i& 2.8 3.7 2,6 2,5 2.4 2,3 2,2 2,1 Zi,: 1,8 1,7 1.6 1.5 1.4 1.3 ;; 1.0
Fig. A2.2 Continuous grading scale used bythe subjects.
24