The Effects of Increased Campaign Finance Disclosure: Evaluating Reform Proposals Conor M. Dowling University of Mississippi Assistant Professor Department of Political Science 235 Deupree Hall University, MS 38677-1848
[email protected] Amber Wichowsky Marquette University Assistant Professor Department of Political Science William Wehr Physics 468, P.O. Box 1881 Milwaukee, WI 53201-1881
[email protected]
Abstract Campaign disclosure requirements vary considerably across the United States. In some states, it is difficult to learn much about outside group spending in non-federal elections; other states have recently passed disclosure laws that go beyond federal requirements. This study builds upon a growing body of research on the impact of anonymous spending to address two questions about campaign finance disclosure: what types of disclosure information voters pay attention to and whether there are partisan differences in responsiveness to campaign finance data. We address these questions via an experiment in which people are randomly assigned to receive additional information about the donors to an outside group. We find some evidence that campaign finance information affected candidate evaluations and vote choice, but that subjects’ evaluations were particularly sensitive to whether they were told that out-of-state donors were behind the outside group. Further, we find little evidence that partisan identification conditioned these treatment effects; Republicans, Democrats, and Independents responded to our experimental stimuli in much the same way. Keywords: campaign finance; disclosure; experiment; transparency; reform
In October 2013, California’s Fair Political Practices Commission (FPPC) announced that it was fining two nonprofit groups a record $1 million for using an elaborate network of organizations to avoid the state’s campaign finance disclosure laws on expenditures made to support Proposition 30 and to defeat Proposition 32 in the 2012 elections.1 As HuffingtonPost’s Paul Blumenthal reported2, donors who wanted their contributions disclosed could contribute to the Small Business Action Committee (SBAC), a California-based independent expenditure group that was directly running the campaigns on the two ballot initiatives; donors who did not want their identities revealed could give to Americans for Job Security (AJS), a Virginia-based 501(c)(6) group that was planning to conduct an issue advocacy campaign (Kroll 2013). However, as Election Day approached, AJS feared it would have to disclose its spending and sought to “unload that money through a network of conservative groups” (Blumenthal 2013). SBAC triggered the investigation when it spent $11 million on the two ballot initiatives, but did not disclose its donors as required by state law. Those funds were eventually linked back to AJS as the FPPC's inquiry revealed that AJS contributed $11 million to Center to Protect Patient Rights (CPPP), an Arizona-based 501(c)(4) organization, who then made a contribution to another Arizona-based 501(c)(4) organization, Americans for Responsible Leadership (ARL), who ultimately gave the $11 million to SBAC for issue ads. In the end, “each dollar given by a donor [was] transferred four times before arriving at the organization that spent it” (Gold and Hamburger 2013). In a press release announcing the record-breaking fine imposed on ARL and CPPP, FPPC chair, Anne Ravel, stated: “This case highlights the nationwide scourge of dark
1
Proposition 30 was a measure to temporarily raise the state sales and income taxes and Proposition 32 was a measure to bar unions from using payroll-deducted funds for political spending. 2 Blumenthal, Paul. 2013. “Gap Clothing Chain Founders Were Behind California’s ‘Dark Money’ Campaign. HuffingtonPost [October 24). Available at: http://www.huffingtonpost.com/2013/10/24/gapcalifornia-dark-money_n_4159516.html [Last accessed August 10, 2014).
1
money nonprofit networks hiding the identities of their contributors. The FPPC is aggressively litigating to get disclosure and working on laws and regulations to put a stop to these practices in California.”3 Whether one agrees with Ravel that “dark money” is a “scourge” or not, this case exemplifies several important issues concerning outside groups and the extent to which the public is informed of the sources of their political spending.4 First, it highlights the dramatic increase in campaign spending by groups, who in 2012 sponsored nearly one out of every three presidential ads (Franz 2012).5 Second, it involves nonprofit organizations--specifically those organized under sections 501(c)(4) and 501(c)(6) of the tax code--that have become increasingly important conduits for campaign spending since they do not have to disclose their donors and thus are central to the “shell games” used to hide the identities of campaign contributors. Third, this case highlights the fuzzy lines that demarcate when campaign finance disclosure laws get triggered. Indeed, ARL’s disclosure of AJS as the source of its contributions was made in error, as the contributions were not earmarked for any specific purpose.6 In many states, contributions made for issue ads that do not expressly call for the election or defeat of a candidate do not have to be disclosed to the public.7 Fourth, outside groups are often working together across state lines to influence not only congressional elections, but state and local races and ballot initiatives as well. Finally, this case speaks to the varied responses by federal and state governments to close
3
Press release available at: http://www.fppc.ca.gov/press_release.php?pr_id=783 [Last accessed August 9, 2014]. 4 By “outside group” we refer to an entity that can legally pay for a political ad, but not in concert with a candidate or party committee. We use “group” for short throughout the paper. 5 As of this writing, groups have spent close to $159 million on congressional races (OpenSecrets.org 2014), with television spots up nearly 70 percent since the 2010 midterm elections (Parker 2014). 6 See FPPC Press Release dated October 24, 2013 on the announcement of the fine at http://www.fppc.ca.gov/press_release.php?pr_id=783 [Last accessed August 19, 2014]. 7 For further detail on how states’ disclosure requirements differ see Corporate Reform Coalition (2012) and McNellis (2012).
2
the gaps in the campaign finance disclosure regime. As we discuss in greater detail below, it is virtually impossible to learn much about outside group spending in non-federal elections in many states; other states have recently passed disclosure laws that go beyond federal requirements Although there is a growing body of research on the impact of anonymous spending, many questions about campaign finance disclosure remain. In this paper, we examine the impact of campaign finance disclosure in state elections with an experiment in which people are randomly assigned to receive additional information about the donors to an outside group. We build upon prior work on the advantages of anonymity (Brooks and Murov 2012; Dowling and Wichowsky 2013; 2014; Johnson, Dunaway and Weber 2011; Ridout, Franz, and Fowler 2013; Weber, Dunaway, and Johnson 2012) to consider first, if voters make use of information about donors in evaluating state legislative candidates, and second, whether voters are more likely to pay attention to particular pieces of information about donors. Specifically, we focus on whether information about out-of-state donors or donations from a wealthy individual are especially meaningful to voters. We find some evidence that campaign finance information affected candidate evaluations and vote choice, but that subjects’ evaluations were particularly sensitive to whether they were told that out-of-state donors provided the majority of the donations to the outside group. Further, we find little evidence that partisan identification conditioned these treatment effects; Republicans, Democrats and Independents responded to our experimental stimuli in much the same way. Given the nationalization of not only congressional elections, but also state and local elections, judicial races, and ballot initiatives, disclosure of this form may be particularly relevant to a large number of electoral contexts. And it is worth noting that even this minimal
3
amount of information about outside group spending in non-federal elections is not available to voters in many states.
Transparency in Campaign Spending In denouncing the increase in undisclosed campaign spending, critics of “dark money” argue that voters would evaluate campaign communications differently if they had more information about the messenger behind the message.8 Their arguments draw inspiration from the Supreme Court, who in striking down limits to campaign spending, has nevertheless continued to reaffirm a governmental interest in campaign finance disclosure. Writing for the majority in Citizens The First Amendment protects political speech and disclosure permits citizens and shareholders to react to the speech of corporate entities in a proper way. This transparency enables the electorate to make informed decisions and give proper weight to different speakers and messages. In Doe v. Reed, Justice Scalia noted that by “requiring people to stand up in public for their political acts,” disclosure “fosters civic courage, without which democracy is doomed.” And most recently in McCutcheon, Justice Scalia wrote that with “modern technology, disclosure now offers a particularly effective means of arming the voting public with information.” Scholars have only recently begun to evaluate the effectiveness of political ads sponsored by anonymous groups (Brooks and Murov 2012; Dowling and Wichowsky 2014; Johnson, Dunaway and Weber 2011; Weber, Dunaway, and Johnson 2012) and whether disclosing the identities of large campaign contributors helps create a more informed electorate (Dowling and Wichowsky 2013; Ridout, Franz, and Fowler 2013). Prior published work has found that outside 8
In this paper, we focus on the effects of campaign finance disclosure on candidate evaluations and vote choice. For a more thorough discussion of how donors have been able to remain anonymous see TorresSpelliscy (2011).
4
groups can help candidates escape voter backlash for running attack ads (Brooks and Murov 2012; Dowling and Wichowsky 2014; Weber, Dunaway, and Johnson 2012) and that disclosure may help reduce some of the advantage that unknown groups have over candidates and more well-known entities (Dowling and Wichowsky 2013). Our own experiments to date have tested how sponsorship and disclosure condition the effectiveness of congressional attack ads. To be sure, the amount of undisclosed spending in federal elections is stunning. Total outside group spending in federal elections with no disclosure of donors increased roughly 6,000 percent between 2006 ($5.17 million) and 2012 ($310.8 million) (Opensecrets.org 2014). But the explosion of“dark money” flowing into state and local races is equally dramatic. An estimated $209 million was spent to influence state elections in 2012 (Buzenberg 2014). In New Jersey, outside groups spent approximately $41 million on state races and ballot initiatives last year, nearly three times the amount spent by the Democratic and Republican Parties. Outside groups poured roughly $24 million into state court races alone in 2011-2012 (Bannon et al. 2013), and even school board races are not immune from Super PAC spending (Schouten 2014). Moreover, it is in these lower-information races that we suspect campaign finance disclosure to have a greater impact on the electorate. As Robert Lenhard, a campaign finance attorney and former chair of the FEC notes: compared to presidential elections where they have to compete with billions of advertising dollars, the “relative impact of a Super PAC can be far greater in a down-ticket race” (as quoted in Nyczepir 2012). In federal elections, voters can also generally rely upon partisan heuristics to judge the merits of a campaign ad.9 This is often not the case in low-information races and certainly not true in primaries, and non-partisan local, judicial 9
Although as we have previously shown (Dowling and Wichowsky 2014) this is not always the case as ads sponsored by some outside groups, and even political parties and candidates themselves, try to avoid overtly partisan language.
5
and referenda elections. Take the state legislative race for Wisconsin’s 19th assembly district, for example. As an open seat in a heavily Democratic district, the winner of the primary will no doubt go on to easily win in November. The race has drawn four candidates, two of whom are affiliated with the beleaguered Milwaukee County Board.10 Although all four are Democrats, there are some issues that divide the candidates, particularly when it comes to Milwaukee’s school voucher program. Heading into the August Democratic primary, voters in the district received mailers from “Forward Milwaukee County” attacking the two candidates with ties to the county board. As local reporter Bruce Murphy writes: “What’s ingenious about the ad is that it exploits the chronic disgust of Milwaukee voters with the county board, but uses it to tarnish two Democrats seeking state office who happen to oppose school choice.” (Murphy 2014). Because the mailers do not use express advocacy words, “vote for” or “vote against”, the group has not had to file a campaign finance report with the state. Yet, it is possible that some voters would be more likely to discount the attack if they had more information about the specific interests behind the message (see, e.g., Dowling and Wichowsky 2013; Ridout, Franz, and Fowler 2013). Campaign finance disclosure may also provide another source of information that helps voters evaluate campaign communications: location. Voters, critics argue, should be able to learn which out-of-state interests are bankrolling campaigns. Such spending has become the norm in state and even local elections. The Center for Public Integrity reported that in 2012 one out of every two dollars spent on state races originated from groups “funded primarily or entirely by out-of-state donors” (Buzenberg 2014).11 In some electoral contexts, where the money comes
10
In April 2014, Milwaukee County voters approved a referendum (71-29 percent) that cuts Milwaukee County supervisors’ pay by half and eliminates their future health and pension benefits. 11 These numbers do not take into account spending on “issue advocacy,” which often goes unreported, a point we return to below.
6
from may be as informative as who is contributing the funds. Consider California’s contentious battles over Proposition 8, which before it was deemed unconstitutional, made same-sex marriage illegal in the state. In the aftermath of the brutal fight over Prop 8, groups who had supported the initiative challenged California’s campaign finance laws, arguing that they had been harassed because their identities were revealed in campaign finance reports. Weighing these privacy concerns against a governmental interest in ensuring an informed electorate, a U.S. District Court upheld California’s disclosure laws, noting that: [T]he public could very well be swayed by the fact that numerous donations to Plaintiffs, and likely to others, came from out of state. It appears very probable to this Court that the California electorate would be interested in knowing if a California initiative was funded by the citizens it is intended to affect or by out-of state interest groups and individuals (Protectmarriage.com v. Bowen, 830 F. Supp. 2d 914, 948 n.16). Finally, examining the effects of campaign finance disclosure in non-federal races is important not only because of the increase in spending by outside groups and out-of-state donors, but also because campaign finance disclosure laws vary widely across the states. In the wake of the Supreme Court’s Citizens United decision, all 24 states that had prohibited corporations or unions from funding independent spending removed those restrictions. Yet although all states require some level of disclosure from candidates, committees, and political parties of the amount and source of contributions and expenditures, states differ in terms of how they treat independent expenditures and electioneering communications,12 the frequency with which that information is reported, and the ease of public access to those data. Two states do not require independent expenditure reporting of any kind (Indiana and South Carolina) (Corporate Reform Coalition 2012). As reported by the National Institute for Money in State politics, half the states do not require reporting for electioneering ads; only 18 states require disclosure for both independent 12
Non-candidate, independent spending falls into two categories. Independent expenditures expressly call for the election or defeat of a specific candidate or ballot issue. Electioneering communications may intend to influence an election, but do not explicitly say how to vote or request support or opposition.
7
expenditures and electioneering communications. Some states require that groups making independent expenditures file reports on a pre-determined schedule; others require reporting only when a person’s or group’s spending has exceeded a dollar threshold. Several states provide easy access to independent spending through a comprehensive, easily searchable, and downloadable database; in other states, such as Minnesota and Iowa, voters have to click on PDF images and disclosure reports and aggregate data themselves.13 Furthermore, the detail required in disclosure reports varies considerably across states. The National Institute for Money in State Politics evaluated state disclosure requirements on four dimensions, including whether they clearly identify and disclose: (1) independent expenditures, (2) electioneering communications, (3) the expenditure’s target, and (4) the expenditure’s purpose/position (support or oppose). Six states (Alabama, Indiana, New Mexico, New York, North Dakota, and South Carolina) did not score a single point in the survey (McNellis 2012). Overall, the majority of states (35) have disclosure laws that are less stringent than federal election law (Suderman 2013). The Center for Public Integrity concludes: “in 30 states it’s impossible to know how much money outside groups are spending on campaigns, information that is mostly available when it comes to federal contests” (Suderman 2013). Nevertheless, while federal efforts to close loopholes in the campaign finance regime have largely stalled, several states have implemented legislation that goes beyond federal disclosure requirements. In Maryland, corporations are required to alert shareholders about a company’s independent political spending. Alaska requires that ads sponsored by independent expenditure groups list the names and addresses of their top three donors in the ad. Massachusetts recently passed legislation requiring that Super PACs that run a television, 13
These details come from The National Institute for Money in State Politics (see e.g. Bauer 2012; McNellis 2012).
8
internet, or print advertisement list the top five donors who contributed to the advertisement.14 California recently closed the nonprofit reporting loophole by requiring disclosure of donors if a nonprofit spends at least $50,000 on politics in one year or more than $100,000 over four consecutive years.15 And California’s state senate recently passed a bill requiring that political ads list the top three funders. The legislation, which is currently being debated by the state assembly, also includes “follow the money” disclosure provisions that require the names shown on ads to be the original source of contributions (i.e. ignoring any transfers made to other nonprofit or political committees). Does all this time and effort to strengthen campaign finance disclosure requirements have an effect? Does it influence voters as courts and policy-makers suggest it might? We designed an experimental test as one of beginning to address these questions.
Research Design and Data We recruited more than 1,500 participants to take a survey with an embedded experiment. The experiment was conducted using Amazon.com’s Mechanical Turk (MTurk) online interface to recruit participants and with surveygizmo as the host site for the survey (see Buhrmester, Kwang, and Gosling 2011 for a discussion of using MTurk to recruit participants for experiments). The MTurk population is a convenience sample that appears more representative than student samples, but is not completely representative of the U.S. population (Berkinsky, Huber, and Lenz 2012). Like other MTurk samples, compared to the general population, our sample is younger and has more self-identified liberals and Democrats (see Appendix Table A1). 14
http://www.bostonglobe.com/metro/2014/08/04/grossman-mother-contributes-superpac/7tYItrnIZv1JZPESzIwELO/story.html. 15 http://www.latimes.com/local/political/la-me-pc-jerry-brown-signs-bill-dark-money-20140514story.html
9
In their article, Berinsky, Huber, and Lenz (2012) illustrate MTurk’s usefulness for conducting experiments in several ways, chief among them by replicating important published experimental work that used both student and national samples (e.g., the General Social Surveys).16 The survey was fielded from August 4-6, 2014, and respondents were paid $0.50 to participate.17 Only US residents over the age of 17 were permitted to take the survey. After completing an informed consent page, all participants completed a short pre-treatment survey that obtained demographic (age, state of residence, race, gender, education, and income) and political (political interest, reported turnout in 2012, ideology, and party affiliation) characteristics. Respondents then answered questions pertaining to a vignette they read about a fictional representative’s vote on a particular bill. This was part of a separate experiment, unrelated to ours. Our experiment then followed, toward the very end of the 10-minute survey.
Experimental Design In our experiment, respondents were asked to read a newspaper account of a fictional state legislative race between Republican candidate Charles Harper and Democratic candidate Robert Singer (the Appendix includes the complete text of this newspaper article and all question wording).18 After introducing the candidates and stating that they are involved in a competitive race, the main article consists of two paragraphs describing differences between the candidates
16
For examples of other published experimental work in political science using MTurk, see Arceneaux (2012), Dowling and Wichowsky (2013; 2014), and Huber, Hill, and Lenz (2012). 17 The study received IRB approval from the University of Mississippi. 18 The mock newspaper article was introduced with this text: “We’d like you to take a minute to read a description of a state senate race that was recently published in a local newspaper. After you read it, we will ask you some questions about the race. We have changed the names of the candidates because we want you to answer these questions based on what you read, rather than anything else you might know about the race.”
10
on two issues--what to do with excess state revenue and whether the state should approve plans for an iron ore mine. Respondents were randomly pre-assigned (with equal probability) to one of seven experimental conditions that varied the amount of information about the donors to an outside group. These conditions are summarized in Table 1. A control group received no spending information whatsoever and the article simply ended with the sentence, “Recent polling puts the race at a dead heat, with Harper and Singer both garnering 43 percent approval from likely voters.” This sentence ended each version of the article, but in the six treatment conditions additional text came before it. [Table 1 about here] In the “generic” spending conditions, respondents were provided the name of two fictional groups and the amount they had spent on the state legislative race ($1 million combined), but were not given any additional information about the original source of those funds. We also randomly assigned whether the group spending benefited Harper (the Republican candidate) or Singer (the Democratic candidate). In the “out-of-state” spending conditions--one of which still described spending benefiting Harper and the other benefiting Singer, respondents were told that more than two-thirds of the $1 million came “from people who live in states other than Missouri.” Finally, the “individual donor” conditions informed respondents that a “billionaire” (Chris Wickmayer) was “the largest contributor to both Super PACs.” When the spending benefited Harper (the Republican), Wickmayer was described as the “owner of the outof-state mining company Tagonite Insight;” when the spending benefited Singer (the Democrat), Wickmayer was described as “a venture capitalist from out-of-state who has spent millions of his dollars supporting environmental conservation.”
11
After reading the mock newspaper article, respondents were asked three questions to ascertain their candidate preferences. First, they were asked, “If you lived in this district, which candidate do you think you would be more likely to vote for?” Harper (scored 1 for analysis purposes) and Singer (scored 0) were the only response options. Respondents were also asked to evaluate the candidates separately: “What is your overall impression of [candidate name]?” Responses to these two questions were recorded on a sliding scale, where 0 was labeled “very unfavorable” and 100 was labeled “very favorable.” We restrict our analysis sample to respondents who answered all three of these outcomes measures and also provided their party identification. We restrict the sample based on party identification because we are interested in whether the party of the respondent moderates the effect of the disclosure treatments, which are party specific. These restrictions left us with 1,499 respondents for our analysis sample. We tested for balance across the experimental conditions using a multinomial logit model with a nominal experimental treatment condition variable as the outcome and party identification as the covariate (indicators for Republicans and Democrats, with Independents serving as the omitted, reference category). The p-value for the chi-squared test statistic for the joint significance of the covariates was .436 (results available upon request).19
19
In addition, we display summary statistics for all pre-treatment measures we collected separately for the seven experimental conditions in Appendix Table A2. We also tested for balance across the experimental conditions using a multinomial logit model with a nominal experimental treatment condition variable as the outcome and the pre-treatment measures listed in Appendix Table A2 as covariates. The p-value for the chi-squared test statistic for the joint significance of the covariates was .7976 (N=1,413).
12
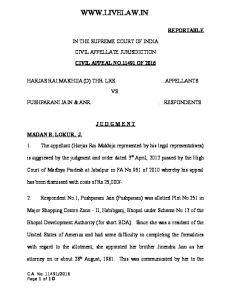
Results Figure 1 presents results for the full sample (i.e., all respondents pooled together). The figure displays the means and 95 percent confidence intervals for our three outcome measures-vote choice in panel A, impression of Harper in panel B, and impression of Singer in panel C-for each experimental condition. Subsequent figures then present the same information separately for Democratic (Figure 2), Republican (Figure 3), and independent (Figure 4) respondents.20 In Table 2 we present the same information in tabular form. Table 2 also reports the number of observations in each condition, for the full sample and by respondent partisan identification. In the Appendix we present a table reporting p-values from t-tests of the equality of the various experimental conditions (each pairwise combination, see Table A3).21 [Table 2 about here] We focus our discussion on the figures. When we consider our full sample (Figure 1, N=1,499), we observe that for all conditions more respondents selected Singer, the Democratic candidate, than Harper, the Republican candidate. This is not surprising given that 60 percent of our sample identifies with the Democratic Party. For example, only 36 percent of respondents in the control group selected Harper (hence the mean of .36 on the dichotomous outcome measure). Only one treatment group is significantly different from the control group. Respondents who were exposed to the information that there was out-of-state spending from a group supporting the Republican candidate (mean=.28) were significantly more likely to say they would vote for the Democratic candidate (p=.049). Respondents who were exposed to the information that there 20
We classify independents as only those respondents who did not say they leaned toward one party or the other. 21 We also conducted ANOVAs of our three outcome measures across experimental conditions. We find a statistically significant F-statistic (p<.10) for all three outcomes in the full sample. When we partition the sample by party, the F-statistic is statistically significant for both candidate evaluation measures among Democrats and evaluations of Harper among independents. We have much lower statistical power among Republicans and independents in our sample.
13
was out-of-state spending from a group supporting the Democratic candidate (mean=.44) were more likely to say they would vote for the Republican candidate, but this difference falls short of statistical significance (p=.100). None of the other treatment groups are statistically or substantively all that different from the control group, suggesting that the information about generic spending and contributions from a wealthy donor (even though this information also pointed in a specific partisan direction) did not substantively move respondents in terms of their vote choice. [Figure 1 about here] What we also observe in Panel A of Figure 1, however, is that several of the treatment conditions are significantly different from one another. The biggest difference is between the two out-of-state conditions, where the nearly .16 gap between the two conditions (.44-.28) is statistically significant at the p<.001 level. This suggests that knowledge of out-of-state spending from an unknown group results in voters being more likely to vote for the candidate that does not benefit from this spending. We observe the same pattern for the generic spending and individual donor conditions, but those differences are small (only about .02 and .06, respectively) and not statistically significant (p=.704 and .254, respectively). In addition, the difference between the out-of-state conditions is significantly different from the difference between the generic spending conditions (p=.030) but not the individual donor conditions (p=.116). Panels B and C of Figure 1 display the results for respondents’ impression of the Republican and Democratic candidate, respectively, and are largely consistent with what we observe in Panel A. The two out-of-state spending conditions have the largest gap of any of the condition-pairs, around 10 points on the 100-point scale (p<.001). Out-of-state spending benefiting the Democratic (Republican) candidate results in higher evaluations of the Republican
14
(Democratic) candidate and lower evaluations of the Democratic (Republican) candidate. The generic spending conditions are not significantly different from one another in either panel, but the individual donor conditions are for evaluations of the Republican candidate (Panel B). Respondents rate the Republican candidate five points higher if they were assigned to the condition in which the individual donor backed the Democratic candidate compared to the one in which the individual donor backed the Republican candidate (p=.047).22 In sum, in the full sample the biggest difference across experimental conditions is between the out-of-state conditions, where the candidate that benefits from that spending loses support. The same pattern is evident for the individual donor conditions, but is only statistically significant for evaluations of the Republican candidate. Generic spending information, on the other hand, results in very small differences, either between one another or from the control group. This likely suggests that even without spending information voters likely assume there is some sort of spending occurring and that it might benefit one candidate over the other, but do not necessarily assume that there is a single individual donating a sizable amount or that a significant amount of money comes from out-of-state donors. We now turn to whether voters respond to this information differently depending on their partisanship. Figure 2 displays the results for Democrats (N=916), of which we have the greatest number and therefore the most statistical power. Like with the full sample, the results for Democrats also suggest that information about out-of-state donors and, to a lesser extent, individual donors changes voters’ opinions of candidates. First, for vote choice (Panel A) Democratic respondents were more likely to vote for the Democratic candidate if they were told groups supporting the Republican candidate were heavily backed by out-of-state donors as 22
The difference between the out-of-state conditions is significantly different from the difference between the generic spending conditions (p=.051 in Panel B; p=.040 in Panel C) and for one of the individual donor outcomes (p=.197 in Panel B; p=.092 in Panel C).
15
opposed to those groups backing the Democratic candidate. This 10-point gap is statistically significant (p=.062). The six-point gap between the individual donors conditions, which runs in the same direction, is not statistically significant (p=.257).23 [Figure 2 about here] When it comes to candidate evaluations, we observe a similar pattern. Democrats have more positive evaluations of the Republican candidate (panel B) when out-of-state donors are said to support the Democratic candidate compared to the Republican candidate (nine-point difference, p=.004); and Democrats have more positive evaluations of the Democratic candidate (panel C) when out-of-state donors are said to support the Republican candidate compared to the Democratic candidate (10-point difference, p=.002). The differences between the individual donor conditions are in the same direction but smaller and not statistically significant (p=.225 in Panel B and p=.310 in Panel C).24 For Republicans (N=345), depicted in Figure 3, the pattern of results is much the same but we have much less statistical power given our smaller sample of Republicans. In Figure 3 we observe gaps in vote choice (Panel A) similar to those we observe for Democrats--9 points between the out-of-state conditions and between the individual donor conditions (the former is just less than the 10-point gap among Democrats, the latter is larger than the 6-point gap among Democrats). However, these gaps are not statistically significant given our lower statistical power (p=.344 and .349, respectively). The greater variation in our candidate evaluation outcome measures, however, helps our statistical power and we find that the individual donor conditions
23
The difference between the out-of-state conditions is not significantly different from the difference between the generic spending conditions (p=.442) or individual donor conditions (p=.621). 24 The difference between the out-of-state conditions is significantly different from the difference between the generic spending conditions in Panel C (p=.015), but not in Panel B (p=.112) and not from the difference between the individual donor conditions for either outcome (p=.286 in panel B; p=.156 in Panel C).
16
are significantly different from one another for evaluations of the Republican candidate (Panel B, nine-point difference, p=.045). The six-point difference between the out-of-state donor conditions in Panel B is not statistically significant (p=.149), but is consistent with the results for Democrats and the full sample. The only statistically significant movement across experimental conditions for Republicans’ evaluations of the Democratic candidate (Panel C of Figure 3) is for the seven-point difference between the control group and generic spending condition in which the spending benefits the Democratic candidate (p=.029). Republicans who read this information had more negative evaluations of the Democratic candidate compared to the control group, but not compared to the other treatment conditions (all ps > .15).25 [Figure 3 about here] Finally, for independents (N=238), for whom we also have lower statistical power, we also find the largest differences between the out-of-state conditions. In Panel A there is a nearly .28-point gap (on the 0 to 1 scale) in vote choice (p=.012) and in Panels B and C there is an approximately 13-point shift (on the 0 to 100 scales) in candidate evaluations (p=.024 and .003, respectively). Like Democrats and Republicans, information that one candidate was benefiting from out-of-state money results in independents shifting their support to the other candidate--and the shifts for independents were quite large. Independents also responded to information about the individual donor in the same fashion--the candidate who benefited received more negative evaluations than the one who was attacked, although the difference between the two conditions is not statistically significant for any of the three outcome measures (p=.973 in Panel A, p=.511 in Panel B, p=.309 in Panel C). In contrast, the generic spending information resulted in
25
None of the difference-in-differences for the experimental conditions are statistically significant for Republicans for any of the three outcome measures.
17
independents liking the candidate benefiting from the spending more, although these differences are not statistically significant (p=.147 in Panel A, p=.919 in Panel B, p=.654 in Panel C).26 [Figure 4 about here] Results Summary Overall, our results contribute to previous experimental studies (Dowling and Wichowsky 2013; Ridout, Franz, and Fowler 2013), which find that--under some conditions-campaign finance disclosure can affect candidate evaluations and vote choice. Here we randomly assigned subjects to one of three disclosure conditions. The “generic” spending condition only disclosed the amount of money spent by an outside group. Although minimal, we note that Indiana and South Carolina do not even require outside groups to report the amounts they have spent on independent expenditures (Corporate Reform Coalition 2012). In the “out-of-state” disclosure condition we presented subjects with how much out-of-state donors have contributed to the outside group. Finally, subjects randomly assigned to the “individual donor” condition were presented with specific details about an individual contributor. Further, we randomized whether the outside group spending benefitted the Republican or Democratic candidate to test whether the effects of disclosure are confined to the evaluations of candidates from one party or another. The largest differences across all three outcomes were between the out-of-state disclosure conditions. Subjects told out-of-state donors funded a group backing the Democratic (Republican) candidate were more likely to support that candidate’s opponent (in the full sample and for Democratic and independent respondents; not statistically significant but difference in 26
The difference between the out-of-state spending conditions is significantly different from the difference between the generic spending conditions (p=.007) and the difference between the individual donor conditions (p=.0936) for vote choice, but only from the generic spending conditions for the evaluation of the Democratic candidate (p=.039).
18
the same direction for Republican respondents). To a lesser extent, but following the same pattern, evaluations of the candidates were sensitive to whether we provided them with details about a wealthy contributor to the outside group, although this difference was only statistically significant for evaluations of the Republican candidate (in the full sample and for Republican respondents). Last, we observe very little difference in response between the two generic spending conditions. The largest difference is for independents for vote choice, where independents were more likely to vote for the candidate who was backed by the outside group spending (i.e., the opposite pattern of the differences for the other two condition-pairs), perhaps reflecting a signal of quality that independents use that is largely trumped by partisanship for Democratic and Republican respondents. Generally, however, partisan identification does not appear to condition the treatment effects; Republicans, Democrats and Independents responded to our experimental stimuli in much the same way.27
Discussion In the 1996 elections, more than two dozen organizations spent an estimated $135 to $150 million on issue advertising, roughly one-third the amount the candidates spent themselves on advertising (Beck et al.1997). Because these ads did not use the “magic words” such as “vote for,” “elect,” or “vote against,” these groups did not have to file campaign finance reports disclosing the amounts they had spent or the source of their contributions. The Bipartisan Campaign Reform Act of 2002 (BCRA) addressed this grey area between “express advocacy” 27
In addition to examining the pattern of results as presented in the figures, we also estimated a two-way ANOVA, in which the experimental condition, indicators for respondent partisanship (Democratic and Republican with independent serving as the excluded category), and interactions between the experimental condition and each of the partisanship indicators are the explanatory factors. That analysis (available upon request) finds no statistically significant interactive effect for any of our three outcome measures.
19
and “issue advocacy” by defining “electioneering communication” as “any broadcast, cable, or satellite communication which...refers to a clearly identified candidate for Federal office” within 30 days of primary or 60 days of a general election.28 Under BCRA, “electioneering communications” were subject to: (1) disclosure rules for identifying donors, (2) disclaimer requirements identifying who paid for the communication and whether a candidate authorized it, and (3) prohibitions against corporations and unions from using general treasury funds to make electioneering communication (Spencer and Wood 2014). Although the Supreme Court invalidated limits on the amounts that corporations and unions could spend on independent expenditures and electioneering communications in Citizens United, the Justices upheld, in a 8-1 decision, disclosure and disclaimer requirements for independent spending. Thus, it is surprising to some (but certainly not all) that “dark money” has increased.29 This increase has largely been driven by 501(c) organizations as donors have taken advantage of the fact that these groups only have to disclose those contributions that have been specifically earmarked for political ads. Indeed, while 501(c) organizations did not spend a “single dollar” on independent expenditures or electioneering communications in 2006, these groups accounted for 42% of all outside spending in 2010 (Spencer and Wood 2014: 330 cf. Center for Responsive Politics 2011). Super PACs have also exploited the rules governing 501(c) groups by using them to move contributions around as a way to keep the identities of the original donors hidden (Torres-Spelliscy 2011).
28
2 U.S.C. § 434(f)(3)(A)(i) Whether this twist was actually unforeseen is debatable. As Heather Gerken notes, in the aftermath of Citizens United: “We all know what happened. Political interests inevitably looked for loopholes, they inevitably found loopholes, and they inevitably drove big trucks of money through those loopholes. There was the soft-money loophole. When that got closed, people started to use issue ads to bypass the existing rules. Then came the 527s and “swift boating.” The 527s have been displaced by SuperPACs and 501(c)(4) and (c(6)s. As a result, the entire reform game has been focused on closing those loopholes, engaging in the regulatory equivalent of whack-a-mole” (2014: 12). 29
20
Recent experimental studies of the types of outside groups least familiar to voters--those that adopt innocent and often patriotic names that obscure their specific political motivations-suggests there are some advantages to this anonymity. Although candidates appear to incur greater benefits from negative ads sponsored by unknown groups (Brooks and Murov 2012; Dowling and Wichowsky 2014; Weber, Dunaway, and Johnson 2012), experimental studies have also found that negative attack ads sponsored by innocuously-named groups are less persuasive when subjects are presented additional information about donors (Dowling and Wichowsky 2013; Ridout, Franz, and Fowler 2013). Although the battle to regulate campaign finance has once again focused on increasing transparency in political spending, federal efforts on this front have largely stalled. Some version of the DISCLOSE Act—which focuses on closing regulatory loopholes that groups have used to hide the identities of their donors--has been introduced in every session of Congress since Citizens United but never passed.30 The Federal Election Commission remains deadlocked over three cases dealing with whether nonprofit organizations crossed the line into “primary” political activity31 and thus should be required to name their contributors.32 Nevertheless, as their reputation as “laboratories of democracy” suggests, some states have attempted to tighten their campaign disclosure regimes in light of the increased spending by Super PACs and nonprofit organizations. Minnesota, for example, requires that independent 30
DISCLOSE stands for Democracy is Strengthened by Casting Light on Spending. In the 111th Congress, it was passed by the House (H.R. 5175) but died in the Senate. An amended version (S. 3369) was reintroduced in the 112th Congress, and again in the 113th Congress. The most current version of the DISCLOSE Act (S. 2516) requires that organizations that spend $10,000 or more during an election cycle file a report with the Federal Election Commission (FEC) within 24 hours, detailing the amount and nature of each expenditure over $1,000 and the names of all its donors who gave $10,000 or more. The bill also includes transfer provisions to prevent donors from hiding their identities. 31 501(c)(4) and 501(c)(6) groups have not had to reveal their donors unless they pass some threshold ito primary political activity. However, this line has never been specified in rule or law and FEC rules have been interpreted to limit disclosure of contributors to only those who specifically earmark their contributions to fund particular third-party communications. 32 http://sunlightfoundation.com/blog/2014/08/04/gop-commissioners-quash-fec-dark-money-probe/
21
spenders, including tax-exempt organizations, disclose all of their contributions. Corporations or unregistered associations that use “membership fees, membership dues, and donations from other individuals and other corporations or associations” must identify donors who contributed $1,000 or more (McNellis 2012). Even with Minnesota’s more stringent regulations, however, donors can still avoid disclosure by contributing to an intermediary organization. As an attempt to address such “shell games,” the California State Senate recently passed a bill (SB 52) that would not only require independent groups to identify their top three donors during their ads, but also prohibit them from using transfers to hide the names of the original source of those contributions. Several questions about the impact of these efforts to increase campaign finance transparency remain. We focused on two in this paper: what types of disclosure information voters pay attention to and whether there are partisan differences in responsiveness to campaign finance data. We addressed these questions via an experiment in which people were randomly assigned to receive additional information about the donors to an outside group. We designed this study to approximate the ways in which states’ disclosure requirements differ from one another. Consistent with previous research, we find that reforms that allow voters to distinguish the source of spending may reduce the advantages of anonymous political spending. However, our findings also suggest that many voters may already assume that spending disproportionately benefits one candidate over another and that wealthy individuals are likely backers for outside groups; at least, this is one plausible explanation for why we find little or at least smaller differences between our “generic” and “individual donor” conditions compared to our “out-of-state” condition. Put differently, the fact that candidate evaluations changed the most when subjects were told the outside group received the majority of its
22
contributions from out-of-state donors suggests this information is less “acceptable” to voters than generic spending information or even information about a wealthy donor. Second, few studies explicitly examine partisan differences in responsiveness to campaign finance information. In Dowling and Wichowsky’s (2013) study, disclosure moved opinions among partisan identifiers the most, but their analysis was post-hoc as their experiment was not explicitly designed to test for treatment heterogeneity.33 In this study, we randomized our treatment conditions such that the outside group spending benefitted either the Democratic or Republican candidate, and found no partisan asymmetry in the estimated impacts of campaign finance disclosure on candidate evaluations and vote choice. Nor did we find any evidence that the impact of our disclosure treatments, especially the out-of-state treatment, was conditioned by respondent partisanship; Democratic, Republican, and independent respondents all rated the candidate that benefited from the the out-of-state spending more negatively. As with any experimental study, external validity is a concern. We tried to address issues of external validity by modeling our treatments to capture state-level differences in disclosure requirements, but additional studies that use different stimuli and designs would help increase confidence in these findings. More research is also needed regarding the costs and benefits of various disclosure regimes. Any effort at increasing transparency must balance privacy concerns against governmental interests in deterring corruption and enabling voters to make informed decisions. Although the Supreme Court has yet to strike down disclosure requirements for “chilling” political speech, such challenges remain likely and may draw further court scrutiny of disclosure laws (Briffault 2010; Cain 2010), particularly given the ease with which that
33
Comparing the results of two experiments, Dowling and Wichowsky (2014) conclude that difference in voter backlash by ad sponsorship (group, candidate, or party) are largely confined to partisans of the targeted candidate.
23
information can be broadly disseminated on the Internet. La Raja (2013), for example, finds that small donors may refrain from making contributions or reduce their donations to avoid disclosing their identities (but see Wood and Spencer 2013). Pointing to the privacy concerns raised most recently by Prop 8’s financial supporters in California, who saw their names and home addresses identified on a Google Map and posted to “Eightmaps.com,” Briffault calls for a “Disclosure 2.0” that would treat campaign finance data, “more like Census data or income tax returns, with the focus not on the activities of specific individual donors and more on the behaviors of demographic or economic aggregates” (2010: 276). We are unable to provide any definitive answers here, but note that these questions deserve closer examination. That we found little evidence that disclosing the identity of a wealthy donor moved opinions may point to a politically savvy electorate that has already used that information to discount electoral claims, or a politically cynical one that disregards such information as just “politics as usual.” Nevertheless, our results also suggest that voters may draw a broader distinction between an in-state independent group and one that is largely financed by out-of-state donors. Put differently, we find that under some conditions, voters do care about who is funding political campaigns.
24
References Bannon, Alice et al. 2013. “The New Politics of Judicial Elections, 2011-2012.” Brennan Center for Justice. Available at:http://www.brennancenter.org/publication/new-politics-judicialelections-2011-12 [Last accessed August 19, 2014]. Bauer, Anne. 2012. “Best Practices for Independent Spending: Part One.” The National Institute for Money in State Politics. Available at: http://beta.followthemoney.org/research/institutereports/?q=&t%5B%5D=7 [Last accessed August 19, 2014]. Beck, Deborah et al.1997. “Issue Advertising During the 1996 Campaign.” Annenberg Public Policy Center. Available at: http://www.annenbergpublicpolicycenter.org/downloads/Political_Communication/Advertis ing_Research_1997/REP16.PDF [Last accessed August 19, 2014]. Berinsky, Adam J., Gregory A. Huber, and Gabriel S. Lenz. 2012. “Using Mechanical Turk as a Subject Recruitment Tool for Experimental Research.” Political Analysis 20(3): 351-368. Blumenthal, Paul. 2013. “Gap Clothing Chain Founders Were Behind California’s “Dark Money” Campaign. The Huffington Post [October 24]. Available at: http://www.huffingtonpost.com/2013/10/24/gap-california-dark-money_n_4159516.html [Last accessed August 19, 2014]. Briffault, Richard. 2010. “Campaign Finance Disclosure 2.0.” Election Law Journal 9(4): 273303. Brooks, Deborah Jordan, and Michael Murov. 2012. “Assessing Accountability in a PostCitizens United Era: The Effects of Attack Ad Sponsorship by Unknown Independent Groups.” American Politics Research 40(3): 383-418. Buhrmester, Michael D., Tracy Kwang, and Samuel D. Gosling. 2011. “Amazon’s Mechanical Turk: A New Source of Inexpensive, Yet High-Quality, Data?” Perspectives on Psychological Science 6(1): 3-5. Buzenberg, Bill. 2014. “Was the glut in outside spending in 2012 state races just the start?” The Center for Public Integrity. Available at: http://www.publicintegrity.org/2013/11/14/13711/was-glut-outside-spending-2012-stateraces-just-start [Last accessed August 14, 2014]. Cain, Bruce E. 2010. “Shade from the Glare: The Case for Semi-Disclosure.” Cato Unbound. Corporate Reform Coalition. 2012. “Sunlight State by State After Citizens United.” Available at: https://www.citizen.org/documents/sunlight-state-by-state-report.pdf. [Last accessed August 19, 2014].
25
Dowling, Conor M., and Amber Wichowsky. 2013. “Does It Matter Who’s Behind the Curtain? Anonymity in Political Advertising and the Effects of Campaign Finance Disclosure.” American Politics Research 41(6): 965-996. Dowling, Conor M., and Amber Wichowsky. 2014. “Attacks without Consequence? Candidates, Parties, Groups and the Changing Face of Negative Advertising.” American Journal of Political Science. DOI: 10.1111/ajps.12094. Franz, Michael M. 2012. “Interest Groups in Electoral Politics: 2012 in Context.” The Forum 10(4): 62-79. Gold, Matea and Hamburger. 2013. “California donor disclosure case exposes how nonprofit groups can play in politics.” The Washington Post [November 3]. Johnson, Tyler, Johanna Dunaway, and Christopher R. Weber. 2011. “Consider the Source: Variations in the Effects of Negative Campaign Messages.” Journal of Integrated Social Sciences 2(1): 98-127. Kroll, Andy. 2013. “California’s Dark-Money Investigation Is Making Conservatives Sweat.” MotherJones [April 15]. Available at: http://www.motherjones.com/politics/2013/04/california-dark-money-americansresponsible-leadership [Last accessed August 19, 2014]. La Raja, Raymond J. 2013. “Political Participation and Civic Courage: The Negative Effect of Transparency on Making Small Campaign Contributions.” Political Behavior. DOI: 10.1007/s11109-013-9259. McNellis, Kevin. 2012. “Best Practices for Independent Spending: Part Two.” The National Institute for Money in State Politics. Available at: http://beta.followthemoney.org/research/institute-reports/best-practices-for-independentspending-part-two/ [Last accessed August 19, 2014]. Murphy, Bruce. 2014. “Is David Clarke Sheriff Spends A Lot?” Urban Milwaukee [August 4]. Available at: http://urbanmilwaukee.com/2014/08/05/murphys-law-is-david-clarke-sheriffspends-a-lot/ [Last accessed August 19, 2014]. Nyczepir, Dave. 2012. “Where Super PACs will really thrive.” Campaigns & Elections [November 14]. Available at: http://www.campaignsandelections.com/print/342757/wheresuper-pacs-will-really-thrive.thtml [Last accessed August 19, 2014]. Opensecrets.org. 2014. “Outside Spending By Disclosure.” Available at: https://www.opensecrets.org/outsidespending/disclosure.php [Last accessed August 19, 2014].
26
Ridout, Travis N., Michael Franz, and Erika Franklin Fowler. 2013. “Are Interest Group Ads More Effective?” Presented at the Annual Meeting of the American Political Science Association, Chicago, IL. Schouten, Fredreka. 2014. “Federal super PACs Spend Big on Local Elections.” USA Today [February 25]. Available at: http://www.usatoday.com/story/news/politics/2014/02/25/super-pacs-spending-localraces/5617121/ [Last accessed: August 19, 2014]. Spencer, Douglas M., and Abby K. Wood. 2014. “Citizens United, States Divided: An Empirical Analysis of Independent Political Spending.” Indiana Law Journal 89: 315-372. Suderman, Alan. 2013. “Lax state rules provide cover for sponsors of attack ads.” The Center for Public Integrity. Available at: http://www.publicintegrity.org/2013/05/16/12652/lax-staterules-provide-cover-sponsors-attack-ads [Last accessed August 19, 2014]. Torres-Spelliscy, Ciara 2011. “Hiding Behind the Tax Code, the Dark Election of 2010 and Why Tax-Exempt Entities Should Be Subject to Robust Federal Campaign Finance Disclosure Laws.” Nexus: Chapman’s Journal of Law and Policy 16: 57-95. Weber, Christopher, Johanna Dunaway, and Tyler Johnson. 2012. “It’s All in the Name: Source Cue Ambiguity and the Persuasive Appeal of Campaign Ads.” Political Behavior 34(3): 561-584. Wood, Abby K., and Douglas M. Spencer. 2013. “In the Shadows of Sunlight: The Effects of Transparency on State Political Campaigns.” Typescript: USC Gould School of Law.
27
Appendix Text of Experiment We’d like you to take a minute to read a description of a state senate race that was recently published in a local newspaper. After you read it, we will ask you some questions about the race. We have changed the names of the candidates because we want you to answer these questions based on what you read, rather than anything else you might know about the race. ********* Republican nominee Charles Harper and Democratic nominee Robert Singer are locked in a tight battle for Missouri’s 1st District seat. The district became more competitive after the state legislature redrew district boundaries following the 2010 Census, and is all the more competitive now after longtime state senator Dan Cunningham announced his retirement. Two issues have started to dominate the campaign. One is what to do with the higher than expected revenue the state has received from tax collections. Harper would like to use that money for additional income and property tax cuts. “The additional revenue should be returned to taxpayers because it’s their money,” Harper told the Gazette. Singer would devote some of that surplus to restore funding to K-12 education, which was cut in the state’s last budget, and to fund infrastructure improvements in the region. Singer kicked off his campaign back in February, arguing that “working families have struggled with a lack of investments in our community.” Second, Harper and Singer differ on whether the state should move ahead with plans to approve construction of an iron ore mine in the 1st District. Harper is in support of the mine, which he argues will bring hundreds of jobs back to the region. Singer is opposed to construction, arguing that current plans involve a weakening of environmental regulations that protect the region’s drinking water supply and that the mine could threaten the growing tourism industry in the area. Control condition: Standard text above, followed by: Recent polling puts the race at a dead heat, with Harper and Singer both garnering 43 percent approval from likely voters. Generic Spending Conditions: Group spending only; randomize whether R or D candidate benefits from outside spending. Same text as above, followed by: R Benefits Spending in the hotly contested race for the 1st District is expected to break previous records as unlimited outside money continues to play a dominant role in the state’s legislative elections. Harper has benefited the most from this outside group spending. Super PACs—including Majority Now and Fund for the Future—have spent roughly $1 million on television ads that have attacked Singer. Recent polling puts the race at a dead heat, with Harper and Singer both garnering 43 percent approval from likely voters.
28
D Benefits Spending in the hotly contested race for the 1st District is expected to break previous records as unlimited outside money continues to play a dominant role in the state’s legislative elections. Singer has benefited the most from this outside group spending. Super PACs—including Majority Now and Fund for the Future—have spent roughly $1 million on television ads that have attacked Harper. Recent polling puts the race at a dead heat, with Harper and Singer both garnering 43 percent approval from likely voters. Out-of-state Spending Conditions: Group spending plus out-of-state contributions; randomize whether R or D candidate benefits. Same text as above, followed by: R Benefits Spending in the hotly contested race for the 1st District is expected to break previous records as unlimited outside money continues to play a dominant role in the state’s legislative elections. Harper has benefited the most from this outside group spending. Super PACs—including Majority Now and Fund for the Future—have spent roughly $1 million on television ads attacking Singer. A data analysis of campaign finance reports reveals that these groups have raised nearly $700,000—more than two-thirds of their total—from people who live in states other than Missouri. Recent polling puts the race at a dead heat, with Harper and Singer both garnering 43 percent approval from likely voters. D Benefits Spending in the hotly contested race for the 1st District is expected to break previous records as unlimited outside money continues to play a dominant role in the state’s legislative elections. Singer has benefited the most from this outside group spending. Super PACs—including Majority Now and Fund for the Future—have spent roughly $1 million on television ads attacking Harper. A data analysis of campaign finance reports reveals that these groups have raised nearly $700,000—more than two-thirds of their total—from people who live in states other than Missouri. Recent polling puts the race at a dead heat, with Harper and Singer both garnering 43 percent approval from likely voters. Individual Donor Conditions: Group spending plus donor identities; randomize whether R or D candidate benefits. Same text as above, followed by: R Benefits Spending in the hotly contested race for the 1st District is expected to break previous records as unlimited outside money continues to play a dominant role in the state’s legislative elections. Harper has benefited the most from this outside group spending. Super PACs—including Majority Now and Fund for the Future—have spent roughly $1 million on television ads attacking Singer. A data analysis of campaign finance reports reveals that billionaire Chris
29
Wickmayer, owner of the out-of-state mining company Tagonite Insight that originally proposed constructing the iron ore mine in the district, is the largest contributor to both Super PACs. Recent polling puts the race at a dead heat, with Harper and Singer both garnering 43 percent approval from likely voters. D Benefits Spending in the hotly contested race for the 1st District is expected to break previous records as unlimited outside money continues to play a dominant role in the state’s legislative elections. Singer has benefited the most from this outside group spending. Super PACs—including Majority Now and Fund for the Future—have spent roughly $1 million on television ads attacking Harper. A data analysis of campaign finance reports reveals that billionaire Chris Wickmayer, a venture capitalist from out-of-state who has spent millions of his dollars supporting environmental conservation, is the largest contributor to both Super PACs. Recent polling puts the race at a dead heat, with Harper and Singer both garnering 43 percent approval from likely voters. Post-treatment Questions: 1. If you lived in this district, which candidate do you think you would be more likely to vote for? (Harper; Singer) {Randomly order 2 and 3} 2. What is your overall impression of Robert Singer? (very unfavorable – very favorable) 3. What is your overall impression of Charles Harper? (very unfavorable – very favorable)
30
Table A1. Descriptive Statistics of MTurk Sample Mean [standard deviation] 33.0925 [11.9794] 12.3852 [9.9754] 0.4514 [.4978] 0.7466 [.4351] 0.0905 [.287] 0.0483 [.2144] 0.1146 [.3187] 4.0134 [1.2507] 7.3928 [3.609] 0.0387 [.1929] 2.2061 [.601] ‐0.6908 [1.5582] 0.6111 [.4877] 0.2302 [.4211] 0.1588 [.3656] 1499
Variable Age (in years) Age‐squared/100 Female (1=yes) White (1=yes) Black (1=yes) Hispanic (1=yes) Other race / Skipped (1=yes) Education (1=No HS; 6=post‐grad) Income (1=<$10k; 14=$150k+; 15=refused) Income Refused (1=yes) Interest in politics (1=not at all; 2=somewhat; 3=very) Respondent Ideology (‐3=v. liberal; 3=v. conservative) Respondent is Democrat (1=yes) Respondent is Republican (1=yes) Respondent is Pure Independent (1=yes) Observations Source: 2014 MTurk
31
Table A2. Summary Statistics for Pre‐treatment Measures by Experimental Condition Generic Generic Out‐of‐State Out‐of‐State Individual Individual Control Group Variable Spending ‐ D Spending ‐ R Spending ‐ D Spending ‐ R Donor ‐ D Donor ‐ R Age (in years) 32.2451 33.466 32.3397 33.7877 33.0941 33.3381 33.6607 [11.0236] [11.9002] [11.9036] [12.0892] [12.3541] [12.8843] [11.873] Age‐squared/100 11.6078 12.609 11.8688 12.8707 12.4708 12.7664 12.7317 [8.7712] [9.7857] [10.1772] [9.8734] [10.4684] [11.0833] [9.7974] Female (1=yes) 0.4553 0.4762 0.4206 0.5116 0.3981 0.4571 0.4358 [.499] [.5006] [.4948] [.501] [.4907] [.4994] [.4972] White (1=yes) 0.7393 0.7512 0.77 0.7814 0.733 0.7217 0.7278 [.4399] [.4334] [.4219] [.4143] [.4435] [.4492] [.4463] Black (1=yes) 0.0934 0.0957 0.0563 0.1023 0.1019 0.1085 0.0722 [.2915] [.2949] [.2311] [.3038] [.3033] [.3117] [.2596] Hispanic (1=yes) 0.0389 0.0383 0.0423 0.0372 0.0388 0.0708 0.0778 [.1938] [.1923] [.2016] [.1897] [.1937] [.257] [.2686] Other race / Skipped (1=yes) 0.1284 0.1148 0.1315 0.0791 0.1262 0.0991 0.1222 [.3352] [.3196] [.3387] [.2705] [.3329] [.2994] [.3285] Education (1=No HS; 6=post‐grad) 3.8945 3.9713 4.028 4.0607 4.0588 4.1517 3.9448 [1.2744] [1.2283] [1.2177] [1.3004] [1.2502] [1.1775] [1.3027] Income (1=<$10k; 14=$150k+; 15=refused) 7.251 7.4286 7.3907 7.6651 7.5631 7.1549 7.3184 [3.6656] [3.7285] [3.5436] [3.7065] [3.5768] [3.5567] [3.468] Income Refused (1=yes) 0.0425 0.0429 0.0512 0.0233 0.0485 0.0329 0.0276 [.2021] [.203] [.2208] [.1511] [.2154] [.1787] [.1643] 2.1934 2.2358 2.2118 2.2264 2.1778 2.1542 2.25 Interest in politics (1=not at all; 2=somewhat; 3=very) [.6009] [.6178] [.6122] [.5602] [.5966] [.6046] [.6178] Respondent Ideology (‐3=v. liberal; 3=v. conservative) ‐0.6216 ‐0.5762 ‐0.7349 ‐0.6651 ‐0.8366 ‐0.6854 ‐0.7444 [1.5538] [1.6905] [1.4564] [1.5037] [1.5285] [1.5171] [1.6717] Respondent is Democrat (1=yes) 0.5907 0.6286 0.6558 0.5581 0.6311 0.615 0.6022 [.4927] [.4843] [.4762] [.4978] [.4837] [.4877] [.4908] Respondent is Republican (1=yes) 0.2394 0.2619 0.186 0.2558 0.1942 0.2347 0.2376 [.4275] [.4407] [.3901] [.4373] [.3965] [.4248] [.4268] 0.1699 0.1095 0.1581 0.186 0.1748 0.1502 0.1602 Respondent is Pure Independent (1=yes) [.3763] [.313] [.3657] [.3901] [.3807] [.3581] [.3678] Observations 259 210 215 215 206 213 181 Note: Cell entries are means with standard deviations in brackets. We tested for balance across the experimental conditions using a multinomial logit model with a nominal experimental treatment condition variable as the outcome and these pre‐treatment measures as covariates. The p ‐value for the chi‐squared test statistic for the joint significance of the covariates was .7976. Source: 2014 MTurk.
32
Table A3. P -values for Tests of Difference of Means across Various Treatment Conditions, by Respondent Party Identifcation Vote Choice (Singer=0; Harper=1) Impression of Harper (0-100) Impression of Singer (0-100) Full Sample 1 2 3 4 5 6 7 1 2 3 4 5 6 7 1 2 3 4 5 6 x x x 1 Control Group 2 Spending info that benefits Dem. 0.897 x 0.440 x 0.344 x 3 Spending info that benefits Rep. 0.596 0.704 x 0.042 0.232 x 0.856 0.467 x 4 Out-of-state spending for Dem. 0.100 0.092 0.038 x 0.938 0.400 0.037 x 0.022 0.247 0.047 x 5 Out-of-state spending for Rep. 0.049 0.078 0.164 0.001 x 0.000 0.001 0.052 0.000 x 0.082 0.014 0.069 0.000 x 6 Name individual spending for Dem. 0.777 0.695 0.438 0.195 0.031 x 0.159 0.548 0.548 0.141 0.010 x 0.078 0.467 0.135 0.688 0.001 x 7 Name individual spending for Rep. 0.358 0.446 0.688 0.017 0.349 0.254 x 0.001 0.011 0.162 0.001 0.674 0.047 x 0.638 0.691 0.774 0.124 0.050 0.271 Democrats 1 2 3 4 5 6 7 1 2 3 4 5 6 7 1 2 3 4 5 6 x x x 1 Control Group 2 Spending info that benefits Dem. 0.959 x 0.350 x 0.716 x 3 Spending info that benefits Rep. 0.338 0.381 x 0.098 0.504 x 0.904 0.805 x 4 Out-of-state spending for Dem. 0.397 0.387 0.082 x 0.882 0.303 0.086 x 0.153 0.102 0.132 x 5 Out-of-state spending for Rep. 0.266 0.304 0.861 0.062 x 0.004 0.066 0.231 0.004 x 0.048 0.141 0.067 0.002 x 6 Name individual spending for Dem. 0.662 0.638 0.176 0.686 0.136 x 0.168 0.681 0.796 0.145 0.147 x 0.505 0.343 0.444 0.469 0.014 x 7 Name individual spending for Rep. 0.447 0.489 0.900 0.135 0.774 0.257 x 0.013 0.118 0.324 0.013 0.927 0.225 x 0.631 0.898 0.713 0.098 0.213 0.310 Republicans 1 2 3 4 5 6 7 1 2 3 4 5 6 7 1 2 3 4 5 6 x x x 1 Control Group 2 Spending info that benefits Dem. 0.583 x 0.331 x 0.029 x 3 Spending info that benefits Rep. 0.223 0.477 x 0.541 0.811 x 0.544 0.160 x 4 Out-of-state spending for Dem. 0.227 0.521 0.898 x 0.978 0.306 0.522 x 0.425 0.154 0.907 x 5 Out-of-state spending for Rep. 0.887 0.725 0.323 0.344 x 0.204 0.023 0.078 0.149 x 0.322 0.252 0.739 0.815 x 6 Name individual spending for Dem. 0.510 0.903 0.557 0.614 0.648 x 0.315 0.933 0.764 0.289 0.025 x 0.117 0.582 0.391 0.411 0.564 x 7 Name individual spending for Rep. 0.728 0.400 0.148 0.147 0.658 0.349 x 0.245 0.042 0.118 0.205 0.998 0.045 x 0.176 0.536 0.484 0.511 0.666 0.918 Independents 1 2 3 4 5 6 7 1 2 3 4 5 6 7 1 2 3 4 5 6 x x x 1 Control Group 2 Spending info that benefits Dem. 0.317 x 0.168 x 0.837 x 3 Spending info that benefits Rep. 0.555 0.147 x 0.191 0.919 x 0.441 0.654 x 4 Out-of-state spending for Dem. 0.537 0.135 1.000 x 0.609 0.285 0.354 x 0.080 0.212 0.481 x 5 Out-of-state spending for Rep. 0.049 0.488 0.015 0.012 x 0.010 0.328 0.271 0.024 x 0.245 0.237 0.083 0.003 x 6 Name individual spending for Dem. 0.624 0.595 0.314 0.296 0.173 x 0.080 0.781 0.700 0.169 0.470 x 0.157 0.330 0.558 0.973 0.022 x 7 Name individual spending for Rep. 0.661 0.581 0.345 0.327 0.172 0.973 x 0.011 0.319 0.298 0.021 0.910 0.511 x 0.700 0.901 0.689 0.188 0.123 0.309 Note: See Appendix for complete question wording and coding details. P-values are from separate t-tests of the equality of means for each treatment group-pair. Bolded p-values less than .10.
33
7
x 7
x 7
x 7
x
Table 1. Summary of Experimental Conditions Candidate Benefiting Condition 1
Control Group
N/A
Text Recent polling puts the race at a dead heat, with Harper and Singer both garnering 43 percent approval from likely voters.
Harper (R)
Spending in the hotly contested race for the 1st District is expected to break previous records as unlimited outside money continues to play a dominant role in the state’s legislative elections. Harper has benefited the most from this outside group spending. Super PACs—including Majority Now and Fund for the Future—have spent roughly $1 million on television ads that have attacked Singer. {Control Group Text}
3
Singer (D)
Spending in the hotly contested race for the 1st District is expected to break previous records as unlimited outside money continues to play a dominant role in the state’s legislative elections. Singer has benefited the most from this outside group spending. Super PACs—including Majority Now and Fund for the Future—have spent roughly $1 million on television ads that have attacked Harper. {Control Group Text}
4
Harper (R)
{Generic Spending Benefiting Harper (R) Text} A data analysis of campaign finance reports reveals that these groups have raised nearly $700,000—more than two‐thirds of their total—from people who live in states other than Missouri. {Control Group Text}
5
Singer (D)
{Generic Spending Benefiting Singer (D) Text} A data analysis of campaign finance reports reveals that these groups have raised nearly $700,000—more than two‐thirds of their total—from people who live in states other than Missouri. {Control Group Text}
6
Harper (R)
{Generic Spending Benefiting Harper (R) Text} A data analysis of campaign finance reports reveals that billionaire Chris Wickmayer, owner of the out‐of‐state mining company Tagonite Insight that originally proposed constructing the iron ore mine in the district, is the largest contributor to both Super PACs. {Control Group Text}
Singer (D)
{Generic Spending Benefiting Singer (D) Text} A data analysis of campaign finance reports reveals that billionaire Chris Wickmayer, a venture capitalist from out‐of‐state who has spent millions of his dollars supporting environmental conservation, is the largest contributor to both Super PACs. {Control Group Text}
2 Generic Spending Conditions
Out‐of‐State Spending Conditions
Individual Donor Conditions 7
Table 2. Means and Standard Errors by Treatment Condition and Respondent Party Identification Vote Choice Impression of Harper Impression of Singer (Singer=0; Harper=1) (0-100) (0-100) Full Sample N Mean Std. Err. Mean Std. Err. Mean Std. Err. Overall 1499 0.354 0.012 49.334 0.652 58.895 0.618 Control Group 259 0.363 0.030 53.062 1.558 60.131 1.402 Spending info that benefits Dem. 210 0.357 0.033 51.252 1.750 58.029 1.757 Spending info that benefits Rep. 215 0.340 0.032 48.256 1.789 59.749 1.580 Out-of-state spending for Dem. 215 0.437 0.034 53.237 1.579 55.274 1.600 Out-of-state spending for Rep. 206 0.277 0.031 43.495 1.664 63.738 1.511 Name individual spending for Dem. 213 0.376 0.033 49.761 1.754 56.225 1.743 Name individual spending for Rep. 181 0.320 0.035 44.564 1.938 59.050 1.873 Democrats (including leaners) N Mean Std. Err. Mean Std. Err. Mean Std. Err. Overall 916 0.212 0.014 44.246 0.826 64.094 0.738 Control Group 153 0.222 0.034 48.065 2.022 63.810 1.704 Spending info that benefits Dem. 132 0.220 0.036 45.265 2.209 64.765 2.011 141 0.177 0.032 43.227 2.097 64.106 1.768 Spending info that benefits Rep. Out-of-state spending for Dem. 120 0.267 0.041 48.517 2.242 59.917 2.172 Out-of-state spending for Rep. 130 0.169 0.033 39.692 2.056 68.746 1.795 Name individual spending for Dem. 131 0.244 0.038 44.000 2.130 62.061 2.011 Name individual spending for Rep. 109 0.183 0.037 39.991 2.554 65.156 2.293 Republicans (including leaners) N Mean Std. Err. Mean Std. Err. Mean Std. Err. Overall 345 0.704 0.025 63.765 1.126 47.858 1.332 Control Group 62 0.661 0.061 63.516 2.808 52.968 3.177 Spending info that benefits Dem. 55 0.709 0.062 67.309 2.646 42.600 3.438 Spending info that benefits Rep. 40 0.775 0.067 66.275 3.518 49.925 3.802 Out-of-state spending for Dem. 55 0.764 0.058 63.618 2.426 49.345 3.203 Out-of-state spending for Rep. 40 0.675 0.075 58.150 2.880 48.250 3.256 Name individual spending for Dem. 50 0.720 0.064 67.640 2.926 45.360 3.629 Name individual spending for Rep. 43 0.628 0.075 58.163 3.712 45.930 4.178 Independents (pure) N Mean Std. Err. Mean Std. Err. Mean Std. Err. Overall 238 0.395 0.032 48.000 1.558 54.887 1.455 Control Group 44 0.432 0.076 55.705 3.738 57.432 3.262 Spending info that benefits Dem. 23 0.304 0.098 47.217 4.432 56.261 4.744 Spending info that benefits Rep. 34 0.500 0.087 47.912 4.672 53.235 4.488 Out-of-state spending for Dem. 40 0.500 0.080 53.125 3.283 49.500 3.014 Out-of-state spending for Rep. 36 0.222 0.070 40.944 4.210 62.861 3.215 Name individual spending for Dem. 32 0.375 0.087 45.406 4.471 49.313 4.929 Name individual spending for Rep. 29 0.379 0.092 41.586 3.539 55.552 3.348 Note: Cell entires are means with standard errors in italics. See Appendix for complete question wording. Source: 2014 MTurk.
Figure 1. Full Sample
75 0
25
50
75 50 25 0 Co ntr Sp ol en din g Sp D en di Ou ng R t-s tat eD Ou t-s tat eR Ind iv D Ind iv R
Treatment Condition
Co ntr Sp ol en din g Sp D en di Ou ng R t-s tat eD Ou t-s tat eR Ind iv D Ind iv R
1 .75 .5 .25 0 Co ntr Sp ol en din gD Sp en di Ou ng R t-s tat eD Ou t-s tat eR Ind iv D Ind iv R
Treatment Condition
C. Impression of Singer (D) 100
B. Impression of Harper (R) 100
A. Vote Choice
Treatment Condition
Note: Means with 95% confidence intervals. Source: 2014 MTurk. See Appendix for complete question wording. A. Vote Choice: 0=Singer (D); 1=Harper (R). B. Impression of Harper (R): 0=very unfavorable; 100=very favorable; C. Impression of Singer (D): 0=very unfavorable; 100=very favorable
Figure 2. Democrats
75 0
25
50
75 50 25 0 Co ntr Sp ol en din g Sp D en di Ou ng R t-s tat eD Ou t-s tat eR Ind iv D Ind iv R
Treatment Condition
Co ntr Sp ol en din g Sp D en di Ou ng R t-s tat eD Ou t-s tat eR Ind iv D Ind iv R
1 .75 .5 .25 0 Co ntr Sp ol en din gD Sp en di Ou ng R t-s tat eD Ou t-s tat eR Ind iv D Ind iv R
Treatment Condition
C. Impression of Singer (D) 100
B. Impression of Harper (R) 100
A. Vote Choice
Treatment Condition
Note: Means with 95% confidence intervals. Source: 2014 MTurk. See Appendix for complete question wording. A. Vote Choice: 0=Singer (D); 1=Harper (R). B. Impression of Harper (R): 0=very unfavorable; 100=very favorable; C. Impression of Singer (D): 0=very unfavorable; 100=very favorable
Figure 3. Republicans
75 0
25
50
75 50 25 0 Co ntr Sp ol en din g Sp D en di Ou ng R t-s tat eD Ou t-s tat eR Ind iv D Ind iv R
Treatment Condition
Co ntr Sp ol en din g Sp D en di Ou ng R t-s tat eD Ou t-s tat eR Ind iv D Ind iv R
1 .75 .5 .25 0 Co ntr Sp ol en din gD Sp en di Ou ng R t-s tat eD Ou t-s tat eR Ind iv D Ind iv R
Treatment Condition
C. Impression of Singer (D) 100
B. Impression of Harper (R) 100
A. Vote Choice
Treatment Condition
Note: Means with 95% confidence intervals. Source: 2014 MTurk. See Appendix for complete question wording. A. Vote Choice: 0=Singer (D); 1=Harper (R). B. Impression of Harper (R): 0=very unfavorable; 100=very favorable; C. Impression of Singer (D): 0=very unfavorable; 100=very favorable
Figure 4. Independents
75 0
25
50
75 50 25 0 Co ntr Sp ol en din g Sp D en di Ou ng R t-s tat eD Ou t-s tat eR Ind iv D Ind iv R
Treatment Condition
Co ntr Sp ol en din g Sp D en di Ou ng R t-s tat eD Ou t-s tat eR Ind iv D Ind iv R
1 .75 .5 .25 0 Co ntr Sp ol en din gD Sp en di Ou ng R t-s tat eD Ou t-s tat eR Ind iv D Ind iv R
Treatment Condition
C. Impression of Singer (D) 100
B. Impression of Harper (R) 100
A. Vote Choice
Treatment Condition
Note: Means with 95% confidence intervals. Source: 2014 MTurk. See Appendix for complete question wording. A. Vote Choice: 0=Singer (D); 1=Harper (R). B. Impression of Harper (R): 0=very unfavorable; 100=very favorable; C. Impression of Singer (D): 0=very unfavorable; 100=very favorable