JOURNAL OF APPLIED PHYSICS 97, 033707 共2005兲
Theoretical study of the band-gap anomaly of InN Pierre Carrier and Su-Huai Weia兲 National Renewable Energy Laboratory, 1617 Cole Boulevard, Golden, Colorado 80401
共Received 21 July 2004; accepted 22 November 2004; published online 14 January 2005兲 Using a band-structure method that includes the correction to the band-gap error in the local-density approximation 共LDA兲, we find that the band gap for InN is 0.8± 0.1 eV, in good agreement with recent experimental data, but is much smaller than previous experimental value of ⬃1.9 eV. The unusually small band gap for InN is explained in terms of the high electronegativity of nitrogen and, consequently, the small band-gap deformation potential of InN. The possible origin of the measured large band gaps is discussed in terms of the nonparabolicity of the bands, the Moss–Burstein shift, and the effect of oxygen. Based on the error analysis of our LDA-corrected calculations we have compiled the band-structure parameters for wurtzite AlN, GaN, and InN. © 2005 American Institute of Physics. 关DOI: 10.1063/1.1849425兴 I. INTRODUCTION
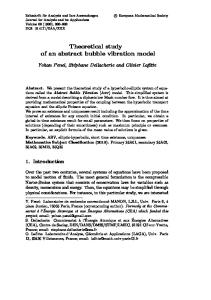
III-nitrides are usually considered as wide-band-gap materials that have applications in devices such as ultraviolet/ blue/green light-emitting diodes and lasers.1 However, recent measurements suggest that the band gap of wurtzite 共WZ兲 InN is below 1.0 eV,2–6 much smaller than the 1.89-eV band gap7 widely accepted in the past to interpret experimental data1 and to fit empirical pseudopotentials for modeling InN and related alloy properties.8,9 If InN indeed has a less than 1.0-eV band gap, which is even smaller than that for InP 共1.4 eV兲,10 then InN and its III-nitride alloys could also be suitable for low-band-gap device applications such as futuregeneration solar cells because the nitride alloys can cover the whole solar spectrum range. The possible low band gap of InN also provides a challenge to understand the general chemical trends of semiconductor band gaps.11,12 Conventional wisdom holds that for common-anion 共or cation兲 III-V semiconductors, the direct band gap at ⌫ increases as the cation 共or anion兲 atomic number decreases. This observation is strongly supported by experimental data10 shown in Fig. 1. This trend would hold for common-cation InX 共X = N, P, As, and Sb兲 compounds if Eg共InN兲 = 1.9 eV, as previously reported.7 However, the trend will be broken if Eg共InN兲 ⬃ 0.8 eV, as reported in recent measurements.2–6 To understand the origin of the InN band-gap anomaly, we have performed band-structure calculations within the local-density approximation13 共LDA兲 in which the LDA band-gap error are corrected using a semiempirical method.12 We find that the band gap of WZ InN is 0.8± 0.1 eV, in good agreement with recent experimental measurements. We show that the reason that InN has a smaller band gap than InP is due to the much larger electronegativity and the much smaller band-gap deformation potential for InN. The possible origin of the measured apparent large band gaps is discussed in terms of the nonparabolicity of the bands, the carrierinduced band-gap shift, and the effect of oxygen. The semiempirical approach is also applied to analyze the LDA error a兲
Electronic mail:
[email protected]
0021-8979/2005/97共3兲/033707/5/$22.50
in the calculated band-structure parameters. Based on this analysis, more realistic band-structure parameters for the IIInitrides are proposed.
II. METHOD OF CALCULATIONS
The band-structure calculations in this study are performed using the fully relativistic 共including spin-orbit coupling兲, general potential, linearized augmented plane-wave 共LAPW兲 method.14 The band structures are calculated at experimental lattice constants.10 The absorption coefficients for the nitrides are calculated using the optical package in 15 WIEN2K. Details of the calculation method is described in Ref. 12. Although LDA is accurate in predicting the ground-state properties such as the lattice parameters 共Table I兲, it is well known that it severely underestimates the semiconductor band gap.16 Direct calculations beyond the LDA is currently difficult.12,17–20 This is partly because the presence of the In 4d orbitals in the valence bands and partly because the LDAcalculated band gap for InN is negative.21 To correct the LDA band-gap error, we use a well-established approach12 by adding to the LDA potential ␦-functionlike external potentials22,23 inside the muffin-tin 共MT兲 spheres centered at each atomic site ␣
FIG. 1. Band gaps as a function of anions for III-V semiconductors. The common- cation trend is broken for InN if its band gap is 0.8 eV. 97, 033707-1
© 2005 American Institute of Physics
Downloaded 09 Aug 2010 to 128.101.35.41. Redistribution subject to AIP license or copyright; see http://jap.aip.org/jap/copyright.jsp
033707-2
J. Appl. Phys. 97, 033707 共2005兲
P. Carrier and S. Wei
TABLE I. Calculated LDA structural parameters and bulk moduli of AlN, GaN, and InN. Results are compared with the available experimental data 共in parentheses兲. ⌬EZB−WZ is the calculated total energy difference between the ZB and WZ phases. Positive number indicates that the WZ structure is more stable, in agreement with the experiment. Properties
AlN
GaN
InN
a共Å兲 c / a共Å兲 u BWZ共kbar兲 aZB共Å兲 BZB共kbar兲 ⌬EZB−WZ , 共meV/ 2-atom兲
3.098共3.112兲 1.601共1.601兲 0.3819 2145 4.364共4.36兲 2158 45
3.170共3.189兲 1.625共1.626兲 0.3768 2046 4.488共4.50兲 2063 11
3.546共3.544兲 1.612共1.613兲 0.3790 1484 4.975共4.98兲 1498 21
冉冊
r␣ ␣ 2 ␣ Vext 共r兲 = ¯V␣ + V␣0 0 e−共r/r0 兲 , r
共1兲
and performed the calculation self-consistently. Specifically, the parameters in Eq. 共1兲 are fitted first only to the available experimental energy levels and to the quasiparticle energies16 at high-symmetry k points for AlP, GaP, InP, and GaN.23 The same parameters are then used to predict the band gaps of arsenides, antimonides, and nitrides. To find the band gap for the wurtzite structure, we add the LDA-calculated band-gap differences between the WZ and zincblende 共ZB兲 compounds to the calculated band gaps for the ZB compound. Compared to our directly calculated results for the wurtzite structure, we find that this procedure is reliable; the overall uncertainty of the predicted band gap associated with this fitting procedure is estimated to be less than 0.1 eV. The effective mass is calculated using two definitions. First, for the transport effective mass we assume the derivative dE共k兲 / dk, which defines the electron group velocity, to be the same as a parabolic band with effective mass mT, i.e., mT关E共k兲兴 =
ប 2k . dE共k兲/dk
共2兲
Second, for the density-of-states 共DOS兲 effective mass, which defines the Moss–Burstein shift,24 we assume that the DOS of the true band to be the same as a parabolic band with effective mass mD, i.e.,
mD共E兲 =
冦
冕
E
0
关mT共⑀兲兴3/2冑⑀d⑀
冕
E
0
冑⑀ d ⑀
冧
2/3
,
共3兲
where mT共E兲 is the transport effective mass defined in 共2兲 and the energy zero is set at the conduction-band minimum 共CBM兲. For wurtzite compounds with anisotropic band we 储 * ⬜ 2 储 1/3 ⬜ = 关共mD 兲 mD兴 , where mD and mD are the effective define mD masses perpendicular and parallel to the c axis, respectively. The two definitions are identical at ⌫, or if the band is parabolic, but could be significantly different at large k when the band is nonparabolic. For most semiconductors,10 E共k兲 contains additional terms of the order k4; therefore, near the CBM the electron effective mass increases linearly as a function of the band-edge energy E and the slope of mT vs E is
TABLE II. Calculated band gaps at ⌫ for ZB and WZ III-V compounds at experimental 共exp兲 lattice constants using the LDA-plus-correction 共LDA + C兲 methods. The ELDA+C values with an 共*兲 are fitted values, whereas all g the others are predicted values. Our calculated results are compared with the available experimental data 共Ref. 10兲. The last column shows the error between the predicted values and the experimental data. Compound
aexp 共Å兲
ELDA+C g 共eV兲
Eexp g 共eV兲
兩 ␦ E g兩 共eV兲
AlSb GaSb InSb AlAs GaAs InAs AlP GaP InP AlN GaN InN
6.133 6.096 6.479 5.660 5.653 6.058 5.467 5.451 5.869 4.360 4.500 4.980 a = 3.112 c = 4.982 u = 0.3819 a = 3.189 c = 5.185 u = 0.3768 a = 3.544 c = 5.718 u = 0.3790
2.28 0.81 0.15 3.05 1.43 0.36 4.42* 2.86* 1.40* 6.00 3.34* 0.70
2.32 0.81 0.24 3.13 1.52 0.42 4.38 2.86 1.46 ¯ 3.32 ¯
0.04 0.00 0.09 0.08 0.09 0.06 0.04 0.00 0.06 ¯ 0.02 ¯
5.95
6.1
0.15
3.49
3.5
0.01
0.85
¯
¯
AlN共WZ兲
GaN共WZ兲
InN共WZ兲
larger than the slope of mD vs E. It is well known that LDA also underestimates the calculated effective masses. Similar to the treatment for the band gap, we have fitted our results for GaN and GaAs, and applied the same procedures to calculate the effective masses for AlN and InN. III. RESULTS AND DISCUSSIONS A. Band-gap anomaly of InN
The predicted direct band gaps at the ⌫ point for the III-V semiconductors using the approach described in Ref. 12 are shown in Table II. These values are compared with the available experimental data.10 We find that for nearly all the III-V semiconductors, the differences between the predicted and the experimental band gaps are less than 0.1 eV. For InN, however, our predicted value of 0.85 eV is much smaller than the previous experimental value7 of 1.9 eV, but it is in very good agreement with recent experimental measurements.2–6 For AlN, our predicted band gap of 6.0 eV is also close to recent photoluminescence measurement of 6.1 eV,25 which is smaller than the previously accepted value around 6.3 eV.1,10,26 To understand the origin of the small band gap of InN and the general chemical trends of the semiconductor band gaps, we studied the chemical and size contributions of the band gap in III-V semiconductors.12 First, we find that at the fixed phosphide volume, the band gaps of the commoncation system decrease from MSb to MP to MAs to MN 共M = Al, Ga, and In兲, following the same trend of the anion atomic valence s orbital energies.12 This is because the CBM
Downloaded 09 Aug 2010 to 128.101.35.41. Redistribution subject to AIP license or copyright; see http://jap.aip.org/jap/copyright.jsp
033707-3
P. Carrier and S. Wei
J. Appl. Phys. 97, 033707 共2005兲
FIG. 2. Calculated band structure of 共a兲 wurtzite InN and 共b兲 wurtzite GaN. The energy zero is set at VBM.
at the ⌫ point is an anion s plus cation s state. Because the N 2s orbital energy is much lower in energy than the Sb 5s, As 4s, and P 3s orbital energies, respectively, the band gap of the nitrides is also much lower than the corresponding antimonides, arsenides, and phosphides at fixed volume. Next, we investigate the size or volume deformation contribution to the band gap. We find that all the compounds have negative volume deformation potentials at ⌫, i.e., when the volume decreases, the band gap increases.27 Therefore, it is clear that the observed chemical trends, that the smaller compound has larger band gap, are mainly due to the large deformation potential. However, for InN, although its volume is about 49% smaller than InP, its band-gap deformation potential ag = dEg / dlnV is small due to the large ionicity and relatively large bond length of InN 关ag共InN兲 = −4.2 eV兴.27 Because of this small 兩ag兩, the contribution due to the size or deformation potential is not sufficient to reverse the order of the band gap due to the contribution of the chemical effect. This explains why InN has a band gap of about 0.6 eV smaller than that of InP. We find that a similar situation also exists in II-VI semiconductors. Indeed, the experimental data10 show that the ZnO band gap of 3.4 eV is smaller than the ZnS band gap of 3.8 eV. Our calculations also show that CdO and HgO would have band gaps that are about 0.5 eV smaller than the band gaps of CdS and HgS, respectively, if they could all exist in the ZB phase.
Figure 3 shows the calculated electron effective masses, and Fig. 4 shows our calculated absorption coefficients of InN. For comparison, we also calculate the band structure and absorption coefficients of GaN. We find that the conduction band of InN is strongly nonparabolic, due to the small band gap, which leads to strong coupling between valence and conduction bands 共Fig. 2兲. This is confirmed from the calculated electron effective masses 共Fig. 3兲, which increase significantly with the band-edge energy or electron concentration. If the conduction band was parabolic the electron effective mass would be a constant. Because of the large
B. Possible origin of the measured large band gap for InN
Our calculation and analysis above show that the fundamental band gap of InN is indeed small, around 0.8 eV. To understand the origin of some of the experiments which show a large band gap of InN,7,28,29 we have performed a detailed study of the band structure of InN. Experimentally, one often assumes that the band-edge states near ⌫ is parabolic and the dipole transition matrix element is nearly independent of k; therefore, the absorption coefficient squared, ␣2, is a linear function of the absorption energy E. The fundamental band gap, thus, can be obtained from the interception with the energy axis by drawing a straight line in the ␣2 vs E plot.7,28,29 To test the validity of this assumption, we show in Fig. 2 the calculated band structure of wurtzite InN.
FIG. 3. Calculated electron effective masses as a function of 共a兲 the absorption edge energy and 共b兲 the carrier density. The energy zero is at VBM. The definition of mT and mD are given in Eqs. 共2兲 and 共3兲, respectively.
Downloaded 09 Aug 2010 to 128.101.35.41. Redistribution subject to AIP license or copyright; see http://jap.aip.org/jap/copyright.jsp
033707-4
J. Appl. Phys. 97, 033707 共2005兲
P. Carrier and S. Wei
FIG. 4. Calculated absorption coefficients of InN and GaN. We show that using the linear extrapolation technique the apparent measured band gaps depend on the scale used in the extrapolation.
deviation from the parabolic band, the calculated ␣2 is not a linear function of E 共Fig. 4兲. Therefore, if one uses the linear extrapolation technique to determine the band gap, the derived apparent band gaps depend on where the straight lines are drawn. For example, as shown in Fig. 4 for InN, using large values of the absorption coefficient to draw the straight line, one can obtain an apparent band gap that is about 0.4 eV larger than the fundamental band gap. The dependence is relatively smaller for GaN which has a larger effective mass than that of InN, thus a larger density of states near the CBM and a sharper increase of the absorption coefficient. We notice that the samples used to obtain the large InN band gaps7,28,29 often have poor sample quality and the band gaps are usually estimated from the absorption spectra with large absorption coefficients. In addition, we have investigated the effect of oxygen on the band gap of InN.28 First, we assume that O substitutes N, forming InNxO1−x alloy. To balance the charge, In vacancy 共VIn兲 is also introduced 共with a ratio of 3 to 1 between ON and VIn兲. Our calculations show that VIn strongly binds with ON. However, the band gap of InNxO1−x alloy decreases compared to bulk InN. This is consistent with the fact that ON induces a donor level below the InN CBM and VIn creates an acceptor level above the InN valence-band maximum 共VBM兲. Second, we studied the 共InN兲2n共In2O3兲m共001兲 superlattices. We notice that in In2O3, In atoms form a slightly distorted fcc sublattice that matches nicely with InN in the ZB structure. Therefore, In2O3 could be a useful substrate for growing ZB InN. The calculated valence-band offset between InN and In2O3 is 0.6± 0.2 eV, with a type-I band alignment. However, the change of the band gap of the superlattice is small. In a superlattice 共InN兲4共In2O3兲2共001兲, the band-gap increase is only about 0.3 eV. Therefore, oxygen may not be an important fact in determining the measured InN band gap.30 Finally, we notice that the InN samples that show large band gaps are often heavily n-type doped.7,28,29 This suggests that the measured absorption edge can be shifted by the Moss–Burstein effect.24 Figure 5 shows our calculated absorption edge energy as a function of the carrier density. We see that the absorption edge increases with the carrier density from 0.8 eV for intrinsic InN to ⬃2.5 eV for the sample with
FIG. 5. Calculated Moss–Burstein shift of the absorption edge energy as a function of the carrier density.
electron concentration of ⬃1021 cm3. These results are consistent with recent experimental observation.31
IV. BAND-STRUCTURE PARAMETERS OF NITRIDES
In the last few years several excellent review articles32,33 and books1,26 have been published to describe the bandstructure parameters of InN and other III-nitrides. The recommended band-structure parameters are based on the collections of available experimental data and theoretical calculations. The semiempirical approach used in this study enabled us to analyze the degree of the systematic LDA errors on the band-structure parameters of the III-nitrides. For example, we find that the LDA did not only underestimate the band gap, but also overestimated the coupling between the conduction band and the valence light hole band. This introduces error in the LDA-calculated crystal-field splittings ⌬CF and the spin-orbit splittings ⌬0 at the top of the valence band, as well as the electron and light hole effective masses. Based on the LDA error analysis and comparison with the available experimental data we propose here a set of bandstructure parameters for the III-nitrides shown in Table III. We suggest that these parameters should be compared directly with the experimental data and be used to fit empirical pseudopotentials8,9 to study the nitride systems.
V. SUMMARY
In summary, using a semiempirical LDA-based bandstructure method with band-gap correction we have systematically studied the chemical trends of the band-gap variation in III-V semiconductors. We find that InN has a band gap of 0.8± 0.1 eV, in good agreement with recent experimental measurements. The possible origin of the measured large band gaps is analyzed. We find that the Moss–Burstein shift should be the dominant factor in determining the measured InN band gap. Based on the error analysis of our LDAcalculated results using the semiempirical approach, we have proposed a set of the band-structure parameters for wurtzite AlN, GaN, and InN, which can be compared directly with the experimental data.
Downloaded 09 Aug 2010 to 128.101.35.41. Redistribution subject to AIP license or copyright; see http://jap.aip.org/jap/copyright.jsp
033707-5
J. Appl. Phys. 97, 033707 共2005兲
P. Carrier and S. Wei
TABLE III. Recommended band-structure parameters at ⌫ for unstrained AlN, GaN, and InN. The properties shown in this table are the band gap Eg, the spin-orbit splitting ⌬0, the crystal-field splitting ⌬CF, the valence-band splittings ⌬E12 and ⌬E13, and the effective masses m parallel and perpendicular to the c axis. The averaged effective mass can be obtained using m * = 关共m⬜兲2m储兴1/3. For AlN, the indices A , B, and C for the effective masses corresponds to ⌫7VBM , ⌫9v, and ⌫7v states, respectively 共Ref. 25兲. For GaN and InN, the orders of A , B, and C correspond to ⌫9VBM , ⌫7v, and ⌫7v states, respectively 共Ref. 34兲. Properties
AlN
Eg共WZ兲共eV兲 Eg共ZB兲共eV兲 ⌬0共meV兲 ⌬CF共meV兲 ⌬E12共meV兲 ⌬E13共meV兲
mA共m0兲 mB共m0兲 mC共m0兲 me共m0兲
GaN
InN
6.10 3.51 6.15 3.35 19 16 −224 25 218 8 237 33 Effective masses
0.78 0.70 5 19 3 21
⬜
储
⬜
储
⬜
储
4.35 0.67 0.68 0.33
0.28 3.50 3.43 0.32
0.39 0.43 1.05 0.22
2.04 0.85 0.19 0.20
0.14 0.13 0.81 0.07
2.09 0.50 0.07 0.06
ACKNOWLEDGMENTS
We would like to thank I. G. Batyrev, X. Nie, S. B. Zhang, and Clas Persson for many valuable discussions. This work is supported by the U.S. Department of Energy, Contract No. DE-AC36-99GO10337. H. Morkoç, Nitride Semiconductors and Devices 共Springer, New York, 1999兲. 2 T. Inushima, V. V. Mamutin, V. A. Vekshin, S. V. Ivanov, T. Sakon, M. Motokawa, and S. Ohoya, J. Cryst. Growth 227/228, 481 共2001兲. 3 V. Yu. Davydov et al., Phys. Status Solidi B 230, R4 共2002兲; 229, R1 共2002兲; 234, 787 共2002兲. 4 J. Wu et al., Appl. Phys. Lett. 80, 3967 共2002兲. 5 J. Wu, W. Walukiewicz, K. M. Yu, J. W. Ager III, E. E. Haller, H. Lu, and W. J. Schaff, Appl. Phys. Lett. 80, 4741 共2002兲. 6 A. Yamamoto, K. Sugita, H. Takatsuka, A. Hashimoto, and V. Yu. Davydov, J. Cryst. Growth 261, 275 共2004兲. 7 T. L. Tansley and C. P. Foley, J. Appl. Phys. 59, 3241 共1986兲. 8 K. Kim and A. Zunger, Phys. Rev. Lett. 86, 2609 共2001兲. 1
P. R. C. Kent and A. Zunger, Appl. Phys. Lett. 79, 1977 共2001兲. Semiconductors: Data Handbook, edited by O. Madelung 共Springer, Berlin, 2004兲. 11 B. R. Nag, Phys. Status Solidi B 233, R8 共2002兲. 12 S.-H. Wei, X. Nie, I. G. Batyrev, and S. B. Zhang, Phys. Rev. B 67, 165209 共2003兲. 13 P. Hohenberg and W. Kohn, Phys. Rev. 136, B864 共1964兲; W. Kohn and L. J. Sham, ibid. 140, A1133 共1965兲. 14 S.-H. Wei and H. Krakauer, Phys. Rev. Lett. 55, 1200 共1985兲; D. J. Singh, Planewaves, Pseudopotentials, and the LAPW Method 共Kluwer, Norwell, 1994兲. 15 P. Blaha, K. Schwarz, G. K. H. Madsen, D. Kvasnicka, and J. Luitz, WIEN2K code, Vienna University of Technology, November 2001; P. Blaha, K. Schwarz, P. Sorantin, and S. B. Trickey, Comput. Phys. Commun. 59, 399 共1990兲. 16 X. Zhu and S. G. Louie, Phys. Rev. B 43, 14142 共1991兲. 17 M. van Schilfgaarde, A. Sher, and A.-B. Chen, J. Cryst. Growth 178, 8 共1997兲; A. Sher, M. van Schilfgaarde, M. A. Berding, S. Krishnamurthy, and A.-B. Chen, MRS Internet J. Nitride Semicond. Res. 4S1, G5.1 共1999兲. 18 T. Kotani and M. van Schilfgaarde, Solid State Commun. 121, 461 共2002兲. 19 D. Vogel, P. Krüger, and J. Pollmann, Phys. Rev. B 55, 12836 共1997兲; C. Stampfl, C. G. Van de Walle, D. Vogel, P. Krüger, and J. Pollmann, ibid. 61, R7846 共2000兲. 20 K. A. Johnson and N. W. Ashcroft, Phys. Rev. B 58, 15548 共1998兲. 21 F. Bechstedt and J. Furthmüller, J. Cryst. Growth 246, 315 共2002兲. 22 N. E. Christensen, Phys. Rev. B 30, 5753 共1984兲. 23 S.-H. Wei and A. Zunger, Phys. Rev. B 57, 8983 共1998兲. 24 T. S. Moss, Proc. Phys. Soc. London, Sect. B 67, 775 共1954兲; E. Burstein, Phys. Rev. 93, 632 共1954兲. 25 J. Li, K. B. Nam, M. L. Nakarmi, J. Y. Lin, H. X. Jiang, P. Carrier, and S.-H. Wei, Appl. Phys. Lett. 83, 5163 共2003兲. 26 Properties of Group III Nitrides, edited by J. H. Edgar 共INSPEC, London, 1994兲. 27 S.-H. Wei and A. Zunger, Phys. Rev. B 60, 5404 共1999兲. 28 Motlan, E. M. Goldys, and T. L. Tansley, J. Cryst. Growth 241, 165 共2002兲. 29 K. Osamura, K. Nakajima, Y. Murakami, P. H. Shingu, and A. Ohtsuki, Solid State Commun. 11, 617 共1972兲; K. Osamura, S. Naka, and Y. Murakami, J. Appl. Phys. 46, 3432 共1975兲. 30 M. Yoshimoto, H. Yamamoto, W. Huang, H. Harima, J. Saraie, A. Chayahara, and Y. Horino, Appl. Phys. Lett. 83, 3480 共2003兲. 31 J. Wu, W. Walukiewicz, W. Shan, K. M. Yu, J. W. Ager III, E. E. Haller, H. Lu, and W. J. Schaff, Phys. Rev. B 66, 201403 共2002兲. 32 I. Vurgaftman and J. R. Meyer, J. Appl. Phys. 94, 3675 共2003兲. 33 A. G. Bhuiyan, A. Hashimoto, and A. Yamamoto, J. Appl. Phys. 94, 2779 共2003兲. 34 G. D. Chen, M. Smith, J. Y. Lin, H. X. Jiang, S.-H. Wei, M. Asif Khan, and C. J. Sun, Appl. Phys. Lett. 68, 2784 共1996兲. 9
10
Downloaded 09 Aug 2010 to 128.101.35.41. Redistribution subject to AIP license or copyright; see http://jap.aip.org/jap/copyright.jsp