15 to 19 15 16 17 18 19 20 to 24 20 21 22 23 24 25 to 29 30 to 34 35 to 39 40 to 44 45 to 49 50 to 54 55 to 59 60 to 64 65 to 69 70 to 74 75 to 79 80 to 84 85 and over 25 and over Total
Total None-4th 258,529 1,613 48,420 321 50,105 153 49,180 237 52,213 441 58,661 461 274,394 3,465 57,687 754 55,205 716 52,738 575 53,070 762 55,709 673 319,124 4,349 320,578 4,273 283,574 4,318 246,618 4,098 194,432 4,635 206,079 5,321 185,054 6,215 154,318 7,193 160,418 6,284 129,759 4,511 93,917 4,215 56,304 3,159 36,802 3,359 2,411,510 342,720 2,834,150 67,008
5th-8th 28,248 18,021 4,695 2,174 1,556 1,802 9,428 1,856 1,684 1,909 1,850 2,129 10,517 10,673 9,875 9,370 10,148 10,682 11,362 13,617 14,129 13,779 13,459 9,270 8,698 145,579 183,255
9th 43,891 21,561 15,051 3,787 1,869 1,623 6,626 1,668 1,433 1,108 1,177 1,240 6,947 5,177 4,116 3,240 3,765 3,714 3,426 4,696 5,114 4,909 4,075 2,728 1,510 53,417 103,934
TOTAL NUMBER OF DEGREES OBTAINED IN ARIZONA BY AGE GROUP (1990) 10th 11th 12th-No Diploma HS Grad Some College Associates Bachelor's 51,225 47,906 13,552 35,723 35,338 929 104 7,431 572 197 235 82 NA 21,726 7,481 237 497 230 29 6 14,444 20,656 3,762 3,535 544 41 NA 4,651 13,777 5,457 13,482 10,774 206 NA 2,973 5,420 3,899 17,974 23,758 653 98 11,737 13,835 12,841 75,444 105,368 15,486 18,923 2,629 3,318 3,068 16,360 25,457 2,143 391 2,304 3,064 2,255 15,451 23,850 3,066 1,263 2,492 2,562 2,533 14,048 20,555 3,181 3,548 2,227 2,445 2,626 14,387 17,643 3,452 6,221 2,085 2,446 2,359 15,198 17,863 3,644 7,500 10,705 12,304 12,482 83,694 92,401 24,888 50,880 8,199 10,213 10,244 81,390 91,999 28,769 51,157 6,184 6,754 8,252 65,132 83,092 26,628 45,874 5,102 5,253 6,551 54,514 69,718 22,310 41,021 5,442 4,583 5,568 48,054 51,693 14,400 25,958 5,668 4,102 50,888 43,865 40,141 10,243 17,824 5,874 4,167 5,205 81,681 32,106 8,112 15,756 6,847 5,463 6,313 45,223 31,268 7,013 15,915 7,093 5,767 7,323 49,723 35,018 5,647 14,583 6,631 4,787 6,371 40,152 25,711 4,109 11,657 4,992 3,082 5,366 26,525 16,804 2,465 7,884 3,258 1,884 2,746 13,493 9,287 1,552 5,295 1,756 735 1,800 7,994 5,090 1,320 2,750 77,751 69,094 83,309 601,440 584,328 120,124 173,429 140,713 130,835 109,702 712,607 725,084 173,871 325,581
Master's Professional Doctoral Assoc+ NA NA NA 1,033 NA NA NA 0 NA NA NA 35 NA NA NA 41 NA NA NA 206 NA NA NA 751 668 498 75 35,650 43 NA NA 2,577 41 61 17 4,448 56 127 44 6,956 154 112 14 9,953 374 198 11,716 6,769 2,790 398 85,725 11,646 5,356 1,482 98,410 15,758 5,553 2,038 95,851 17,487 5,347 2,607 88,772 13,736 3,831 2,619 60,544 9,171 2,556 1,904 41,698 7,539 2,380 1,231 35,018 7,123 2,069 1,578 33,698 5,954 2,680 1,103 29,967 4,269 1,932 941 22,908 2,856 1,638 556 15,399 2,115 1,179 338 10,479 956 559 275 5,860 105,379 37,870 17,070 453,872 106,047 38,368 17,145 661,012
15 to 19 15 16 17 18 19 20 to 24 20 21 22 23 24 25 to 29 30 to 34 35 to 39 40 to 44 45 to 49 50 to 54 55 to 59 60 to 64 65 to 69 70 to 74 75 to 79 80 to 84 85 and over 25 and over Total
Total None-4th 360,694 3,114 72,107 322 68,799 356 70,499 598 73,667 722 75,622 1,116 362,458 6,264 75,015 1,303 71,135 1,224 71,443 1,290 71,866 1,242 72,999 1,205 372,398 6,507 367,579 5,923 399,367 7,376 383,674 8,446 332,972 6,934 293,713 6,265 236,416 6,081 202,458 6,127 190,441 6,281 175,236 6,745 143,329 4,658 90,696 2,993 67,905 3,425 3,256,184 77,761 3,979,336 87,139
5th-8th 48,099 33,005 5,652 3,205 3,045 3,192 18,864 3,625 3,406 3,959 3,574 4,300 19,632 19,607 19,238 18,122 14,213 12,104 10,680 11,085 11,563 12,150 10,478 8,746 9,317 176,935 243,898
9th 65,658 28,115 26,017 5,514 3,429 2,583 13,245 2,726 2,498 2,820 2,342 2,859 11,736 10,576 9,079 6,625 4,544 3,859 3,478 4,284 4,286 4,749 4,137 2,947 2,541 72,841 151,744
TOTAL NUMBER OF DEGREES OBTAINED IN ARIZONA BY AGE GROUP (2000) 10th 11th 12th-No DiplomaHS Grad Some CollegeAssociates Bachelor's 69,623 63,848 20,070 48,131 41,072 847 232 8,977 1,027 122 346 193 NA 26,762 7,722 898 1,028 353 11 NA 24,477 25,176 4,946 5,043 1,504 36 NA 5,743 23,247 8,649 16,951 11,743 138 NA 3,664 6,676 5,455 24,763 27,279 662 232 14,032 17,784 19,676 97,142 128,116 18,433 27,024 3,057 4,446 4,667 21,989 30,370 2,255 493 2,829 3,747 4,015 19,640 28,754 3,263 1,596 2,714 3,458 3,636 19,410 24,989 4,363 4,506 2,841 3,157 3,900 18,002 23,155 4,121 9,073 2,591 2,976 3,458 18,101 20,848 4,431 11,356 11,242 12,898 18,312 84,064 100,645 25,887 65,628 9,504 11,775 16,385 83,034 96,108 26,914 63,184 9,902 10,482 15,621 93,589 108,096 31,904 65,367 7,768 9,129 14,315 88,471 105,910 32,360 60,851 5,525 6,222 10,283 71,213 94,158 29,372 55,025 4,671 4,587 8,025 60,611 84,257 24,337 49,055 5,435 4,259 7,355 57,870 65,042 15,475 33,328 5,605 4,567 6,835 54,927 51,823 10,772 25,946 5,974 4,925 6,819 54,026 46,079 9,050 24,020 6,867 5,086 7,286 50,756 40,933 6,181 20,361 5,059 4,271 6,378 44,878 34,059 3,876 15,156 3,524 2,560 4,184 29,374 19,777 1,919 8,785 3,125 1,955 3,295 19,091 12,278 1,309 6,713 84,201 82,716 125,093 791,904 859,165 219,356 493,419 167,856 164,348 164,839 937,177 1,028,353 238,636 520,675
Master's Professional Doctoral NA NA NA NA NA NA NA NA NA NA NA NA NA NA NA NA NA NA 1,214 570 94 79 5 NA 47 108 8 174 93 31 271 146 42 643 218 13 11,425 3,587 835 16,769 5,839 1,961 19,255 6,817 2,641 21,809 7,042 2,826 24,382 7,223 3,878 26,177 6,057 3,708 19,626 4,232 3,555 14,217 3,563 2,707 10,925 3,942 2,551 8,837 3,288 1,997 6,405 2,542 1,432 3,359 1,623 905 2,628 1,549 679 185,814 57,304 29,675 187,028 57,874 29,769
Assoc+ 1,079 0 11 36 138 894 47,335 2,832 5,022 9,167 13,653 16,661 107,362 114,667 125,984 124,888 119,880 109,334 76,216 57,205 50,488 40,664 29,411 16,591 12,878 985,568 1,033,982
15 to 19 15 16 17 18 19 20 to 24 20 21 22 23 24 25 to 29 30 to 34 35 to 39 40 to 44 45 to 49 50 to 54 55 to 59 60 to 64 65 to 69 70 to 74 75 to 79 80 to 84 85 and over 25 and over Total
None-4th 5th-8th 0.6% 10.9% 0.7% 37.2% 0.3% 9.4% 0.5% 4.4% 0.8% 3.0% 0.8% 3.1% 1.3% 3.4% 1.3% 3.2% 1.3% 3.1% 1.1% 3.6% 1.4% 3.5% 1.2% 3.8% 1.4% 3.3% 1.3% 3.3% 1.5% 3.5% 1.7% 3.8% 2.4% 5.2% 2.6% 5.2% 3.4% 6.1% 4.7% 8.8% 3.9% 8.8% 3.5% 10.6% 4.5% 14.3% 5.6% 16.5% 9.1% 23.6% 14.2% 6.0% 2.4% 6.5%
9th 17.0% 44.5% 30.0% 7.7% 3.6% 2.8% 2.4% 2.9% 2.6% 2.1% 2.2% 2.2% 2.2% 1.6% 1.5% 1.3% 1.9% 1.8% 1.9% 3.0% 3.2% 3.8% 4.3% 4.8% 4.1% 2.2% 3.7%
PERCENTAGE OF POPULATION WITH DEGREES IN ARIZONA BY AGE GROUP (1990) HS GradSome College AssociatesBachelor's Master'sProfessionalDoctoral Assoc+ 10th 11th 12th-No Diploma 19.8% 18.5% 5.2% 13.8% 13.7% 0.4% 0.0% 0.0% 0.0% 0.0% 0.4% 15.3% 1.2% 0.4% 0.5% 0.2% 0.0% 0.0% 0.0% 0.0% 0.0% 0.0% 43.4% 14.9% 0.5% 1.0% 0.5% 0.1% 0.0% 0.0% 0.0% 0.0% 0.1% 29.4% 42.0% 7.6% 7.2% 1.1% 0.1% 0.0% 0.0% 0.0% 0.0% 0.1% 8.9% 26.4% 10.5% 25.8% 20.6% 0.4% 0.0% 0.0% 0.0% 0.0% 0.4% 5.1% 9.2% 6.6% 30.6% 40.5% 1.1% 0.2% 0.0% 0.0% 0.0% 1.3% 4.3% 5.0% 4.7% 27.5% 38.4% 5.6% 6.9% 0.2% 0.2% 0.0% 13.0% 4.6% 5.8% 5.3% 28.4% 44.1% 3.7% 0.7% 0.1% 0.0% 0.0% 4.5% 4.2% 5.6% 4.1% 28.0% 43.2% 5.6% 2.3% 0.1% 0.1% 0.0% 8.1% 4.7% 4.9% 4.8% 26.6% 39.0% 6.0% 6.7% 0.1% 0.2% 0.1% 13.2% 4.2% 4.6% 4.9% 27.1% 33.2% 6.5% 11.7% 0.3% 0.2% 0.0% 18.8% 3.7% 4.4% 4.2% 27.3% 32.1% 6.5% 13.5% 0.7% 0.4% 0.0% 21.0% 3.4% 3.9% 3.9% 26.2% 29.0% 7.8% 15.9% 2.1% 0.9% 0.1% 26.9% 2.6% 3.2% 3.2% 25.4% 28.7% 9.0% 16.0% 3.6% 1.7% 0.5% 30.7% 2.2% 2.4% 2.9% 23.0% 29.3% 9.4% 16.2% 5.6% 2.0% 0.7% 33.8% 2.1% 2.1% 2.7% 22.1% 28.3% 9.0% 16.6% 7.1% 2.2% 1.1% 36.0% 2.8% 2.4% 2.9% 24.7% 26.6% 7.4% 13.4% 7.1% 2.0% 1.3% 31.1% 2.8% 2.0% 24.7% 21.3% 19.5% 5.0% 8.6% 4.5% 1.2% 0.9% 20.2% 3.2% 2.3% 2.8% 44.1% 17.3% 4.4% 8.5% 4.1% 1.3% 0.7% 18.9% 4.4% 3.5% 4.1% 29.3% 20.3% 4.5% 10.3% 4.6% 1.3% 1.0% 21.8% 4.4% 3.6% 4.6% 31.0% 21.8% 3.5% 9.1% 3.7% 1.7% 0.7% 18.7% 5.1% 3.7% 4.9% 30.9% 19.8% 3.2% 9.0% 3.3% 1.5% 0.7% 17.7% 5.3% 3.3% 5.7% 28.2% 17.9% 2.6% 8.4% 3.0% 1.7% 0.6% 16.4% 5.8% 3.3% 4.9% 24.0% 16.5% 2.8% 9.4% 3.8% 2.1% 0.6% 18.6% 4.8% 2.0% 4.9% 21.7% 13.8% 3.6% 7.5% 2.6% 1.5% 0.7% 15.9% 3.2% 2.9% 3.5% 24.9% 24.2% 5.0% 7.2% 4.4% 1.6% 0.7% 18.8% 5.0% 4.6% 3.9% 25.1% 25.6% 6.1% 11.5% 3.7% 1.4% 0.6% 23.3%
None-4th 5th-8th 15 to 19 0.9% 13.3% 15 0.4% 45.8% 16 0.5% 8.2% 17 0.8% 4.5% 18 1.0% 4.1% 19 1.5% 4.2% 20 to 24 1.7% 5.2% 20 1.7% 4.8% 21 1.7% 4.8% 22 1.8% 5.5% 23 1.7% 5.0% 24 1.7% 5.9% 25 to 29 1.7% 5.3% 30 to 34 1.6% 5.3% 35 to 39 1.8% 4.8% 40 to 44 2.2% 4.7% 45 to 49 2.1% 4.3% 50 to 54 2.1% 4.1% 55 to 59 2.6% 4.5% 60 to 64 3.0% 5.5% 65 to 69 3.3% 6.1% 70 to 74 3.8% 6.9% 75 to 79 3.2% 7.3% 80 to 84 3.3% 9.6% 85 and over 5.0% 13.7% 25 and over 2.4% 5.4% Total 2.2% 6.1%
PERCENTAGE OF POPULATION WITH DEGREES IN ARIZONA BY AGE GROUP (2000) HS GradSome College AssociatesBachelor's Master'sProfessionalDoctoral Assoc+ 9th 10th 11th 12th-No Diploma 18.2% 19.3% 17.7% 5.6% 13.3% 11.4% 0.2% 0.1% 0.0% 0.0% 0.0% 0.3% 39.0% 12.4% 1.4% 0.2% 0.5% 0.3% 0.0% 0.0% 0.0% 0.0% 0.0% 0.0% 37.8% 38.9% 11.2% 1.3% 1.5% 0.5% 0.0% 0.0% 0.0% 0.0% 0.0% 0.0% 7.8% 34.7% 35.7% 7.0% 7.2% 2.1% 0.1% 0.0% 0.0% 0.0% 0.0% 0.1% 4.7% 7.8% 31.6% 11.7% 23.0% 15.9% 0.2% 0.0% 0.0% 0.0% 0.0% 0.2% 3.4% 4.8% 8.8% 7.2% 32.7% 36.1% 0.9% 0.3% 0.0% 0.0% 0.0% 1.2% 3.7% 3.9% 4.9% 5.4% 26.8% 35.3% 5.1% 7.5% 0.3% 0.2% 0.0% 13.1% 3.6% 4.1% 5.9% 6.2% 29.3% 40.5% 3.0% 0.7% 0.1% 0.0% 0.0% 3.8% 3.5% 4.0% 5.3% 5.6% 27.6% 40.4% 4.6% 2.2% 0.1% 0.2% 0.0% 7.1% 3.9% 3.8% 4.8% 5.1% 27.2% 35.0% 6.1% 6.3% 0.2% 0.1% 0.0% 12.8% 3.3% 4.0% 4.4% 5.4% 25.0% 32.2% 5.7% 12.6% 0.4% 0.2% 0.1% 19.0% 3.9% 3.5% 4.1% 4.7% 24.8% 28.6% 6.1% 15.6% 0.9% 0.3% 0.0% 22.8% 3.2% 3.0% 3.5% 4.9% 22.6% 27.0% 7.0% 17.6% 3.1% 1.0% 0.2% 28.8% 2.9% 2.6% 3.2% 4.5% 22.6% 26.1% 7.3% 17.2% 4.6% 1.6% 0.5% 31.2% 2.3% 2.5% 2.6% 3.9% 23.4% 27.1% 8.0% 16.4% 4.8% 1.7% 0.7% 31.5% 1.7% 2.0% 2.4% 3.7% 23.1% 27.6% 8.4% 15.9% 5.7% 1.8% 0.7% 32.6% 1.4% 1.7% 1.9% 3.1% 21.4% 28.3% 8.8% 16.5% 7.3% 2.2% 1.2% 36.0% 1.3% 1.6% 1.6% 2.7% 20.6% 28.7% 8.3% 16.7% 8.9% 2.1% 1.3% 37.2% 1.5% 2.3% 1.8% 3.1% 24.5% 27.5% 6.5% 14.1% 8.3% 1.8% 1.5% 32.2% 2.1% 2.8% 2.3% 3.4% 27.1% 25.6% 5.3% 12.8% 7.0% 1.8% 1.3% 28.3% 2.3% 3.1% 2.6% 3.6% 28.4% 24.2% 4.8% 12.6% 5.7% 2.1% 1.3% 26.5% 2.7% 3.9% 2.9% 4.2% 29.0% 23.4% 3.5% 11.6% 5.0% 1.9% 1.1% 23.2% 2.9% 3.5% 3.0% 4.4% 31.3% 23.8% 2.7% 10.6% 4.5% 1.8% 1.0% 20.5% 3.2% 3.9% 2.8% 4.6% 32.4% 21.8% 2.1% 9.7% 3.7% 1.8% 1.0% 18.3% 3.7% 4.6% 2.9% 4.9% 28.1% 18.1% 1.9% 9.9% 3.9% 2.3% 1.0% 19.0% 2.2% 2.6% 2.5% 3.8% 24.3% 26.4% 6.7% 15.2% 5.7% 1.8% 0.9% 30.3% 3.8% 4.2% 4.1% 4.1% 23.6% 25.8% 6.0% 13.1% 4.7% 1.5% 0.7% 26.0%
PERCENT CHANGE (1990-2000) IN PERCENTAGE OF POPULATION WITH DEGREES IN ARIZONA BY AGE GROUP (2000) HS GradSome College AssociatesBachelor's Master'sProfessionalDoctoral Assoc+ None-4th 5th-8th 9th 10th 11th 12th-No Diploma 15 to 19 0.2% 2.4% 1.2% -0.5% -0.8% 0.3% -0.5% -2.3% -0.1% 0.0% 0.0% 0.0% 0.0% -0.1% 15 -0.2% 8.6% -5.5% -2.9% 0.2% -0.2% 0.0% 0.1% 0.0% 0.0% 0.0% 0.0% 0.0% 0.0% 16 0.2% -1.2% 7.8% -4.5% -3.7% 0.8% 0.5% 0.1% 0.0% 0.0% 0.0% 0.0% 0.0% -0.1% 17 0.4% 0.1% 0.1% 5.3% -6.3% -0.6% 0.0% 1.0% 0.0% 0.0% 0.0% 0.0% 0.0% 0.0% 18 0.1% 1.2% 1.1% -1.1% 5.2% 1.3% -2.8% -4.7% -0.2% 0.0% 0.0% 0.0% 0.0% -0.2% 19 0.7% 1.1% 0.6% -0.2% -0.4% 0.6% 2.1% -4.4% -0.2% 0.1% 0.0% 0.0% 0.0% -0.1% 20 to 24 0.5% 1.8% 1.2% -0.4% -0.1% 0.7% -0.7% -3.1% -0.6% 0.6% 0.1% 0.0% 0.0% 0.1% 20 0.4% 1.6% 0.7% -0.5% 0.2% 0.9% 1.0% -3.6% -0.7% 0.0% 0.0% 0.0% 0.0% -0.7% 21 0.4% 1.7% 0.9% -0.2% -0.3% 1.6% -0.4% -2.8% -1.0% 0.0% 0.0% 0.0% 0.0% -1.0% 22 0.7% 1.9% 1.8% -0.9% 0.0% 0.3% 0.5% -4.0% 0.1% -0.4% 0.1% -0.1% 0.0% -0.4% 23 0.3% 1.5% 1.0% -0.2% -0.2% 0.5% -2.1% -1.0% -0.8% 0.9% 0.1% 0.0% 0.0% 0.2% 24 0.4% 2.1% 1.7% -0.2% -0.3% 0.5% -2.5% -3.5% -0.5% 2.1% 0.2% -0.1% 0.0% 1.8% 25 to 29 0.4% 2.0% 1.0% -0.3% -0.4% 1.0% -3.7% -1.9% -0.8% 1.7% 0.9% 0.1% 0.1% 2.0% 30 to 34 0.3% 2.0% 1.3% 0.0% 0.0% 1.3% -2.8% -2.6% -1.7% 1.2% 0.9% -0.1% 0.1% 0.5% 35 to 39 0.3% 1.3% 0.8% 0.3% 0.2% 1.0% 0.5% -2.2% -1.4% 0.2% -0.7% -0.3% -0.1% -2.3% 40 to 44 0.5% 0.9% 0.4% 0.0% 0.2% 1.1% 1.0% -0.7% -0.6% -0.8% -1.4% -0.3% -0.3% -3.4% 45 to 49 -0.3% -1.0% -0.6% -1.1% -0.5% 0.2% -3.3% 1.7% 1.4% 3.2% 0.3% 0.2% -0.2% 4.9% 50 to 54 -0.4% -1.1% -0.5% -1.2% -0.4% -22.0% -0.6% 9.2% 3.3% 8.1% 4.5% 0.8% 0.3% 17.0% 55 to 59 -0.8% -1.6% -0.4% -0.9% -0.5% 0.3% -19.7% 10.2% 2.2% 5.6% 4.2% 0.5% 0.8% 13.3% 60 to 64 -1.6% -3.3% -0.9% -1.7% -1.3% -0.7% -2.2% 5.3% 0.8% 2.5% 2.4% 0.4% 0.3% 6.4% 65 to 69 -0.6% -2.7% -0.9% -1.3% -1.0% -1.0% -2.6% 2.4% 1.2% 3.5% 2.0% 0.4% 0.7% 7.8% 70 to 74 0.4% -3.7% -1.1% -1.2% -0.8% -0.8% -2.0% 3.5% 0.4% 2.6% 1.8% 0.4% 0.4% 5.6% 75 to 79 -1.2% -7.0% -1.5% -1.8% -0.3% -1.3% 3.1% 5.9% 0.1% 2.2% 1.4% 0.0% 0.4% 4.1% 80 to 84 -2.3% -6.8% -1.6% -1.9% -0.5% -0.3% 8.4% 5.3% -0.6% 0.3% -0.1% -0.3% 0.4% -0.3% 85 and over -4.1% -9.9% -0.4% -0.2% 0.9% 0.0% 6.4% 4.3% -1.7% 2.4% 1.3% 0.8% 0.3% 3.0% 25 and over -11.8% -0.6% 0.0% -0.6% -0.3% 0.4% -0.6% 2.2% 1.8% 8.0% 1.3% 0.2% 0.2% 11.4% Total -0.2% -0.3% 0.1% -0.7% -0.5% 0.3% -1.6% 0.3% -0.1% 1.6% 1.0% 0.1% 0.1% 2.7%
15 to 19 15 16 17 18 19 20 to 24 20 21 22 23 24 25 to 29 30 to 34 35 to 39 40 to 44 45 to 49 50 to 54 55 to 59 60 to 64 65 to 69 70 to 74 75 to 79 80 to 84 85 and over 25 and over Total
Total 19,911,052 3,980,594 3,919,821 3,969,107 4,025,246 4,016,284 19,025,980 4,056,413 3,836,406 3,764,346 3,698,614 3,670,201 19,212,244 20,365,113 23,083,337 22,822,134 20,181,127 17,397,482 13,383,251 10,787,979 9,569,199 8,931,950 7,385,783 4,931,479 4,160,561 182,211,639 221,148,671
None-4th 5th-8th 117,950 2,455,719 12,417 1,829,054 15,118 305,528 20,001 121,271 26,964 97,237 43,450 102,629 244,589 564,807 47,113 107,283 45,767 108,005 50,322 113,637 51,310 114,831 50,077 121,051 273,779 637,201 306,767 662,625 365,468 694,345 382,788 668,205 363,528 615,049 330,934 633,017 296,623 645,724 307,022 711,845 330,759 822,465 329,299 969,223 288,435 937,431 205,028 813,187 227,042 937,688 4,007,472 9,748,005 4,370,011 12,768,531
TOTAL NUMBER OF DEGREES OBTAINED IN THE U.S. BY AGE GROUP (2000) Assoc+ 9th 10th 11th 12th-No DiplomaHS Grad Some CollegeAssociates Bachelor's Master's Professional Doctoral 3,694,075 3,911,298 3,658,702 997,188 2,564,628 2,465,103 37,174 9,196 5 NA 14 46,389 1,625,019 444,621 43,147 9,368 13,079 3,889 NA NA NA NA NA 0 1,560,440 1,540,790 418,730 30,109 35,007 13,222 851 7 5 NA 14 877 278,038 1,481,548 1,502,696 282,958 232,329 48,978 1,288 NA NA NA NA 1,288 123,795 283,294 1,378,026 437,152 931,590 741,552 5,628 8 NA NA NA 5,636 106,783 161,045 316,103 237,601 1,352,623 1,657,462 29,407 9,181 NA NA NA 38,588 473,593 613,925 766,945 856,689 5,453,558 6,885,884 1,060,658 1,954,920 107,209 36,360 6,843 3,165,990 105,230 147,538 193,688 201,643 1,263,227 1,843,244 116,395 27,823 2,877 277 75 147,447 96,914 129,530 160,452 174,576 1,141,838 1,659,709 207,012 102,677 4,297 4,577 1,052 319,615 93,482 121,227 146,642 166,012 1,071,106 1,350,859 241,909 391,278 10,155 6,377 1,340 651,059 89,247 112,682 135,690 158,076 1,005,233 1,073,283 249,704 668,738 28,766 9,302 1,752 958,262 88,720 102,948 130,473 156,382 972,154 958,789 245,638 764,404 61,114 15,827 2,624 1,089,607 446,248 485,585 569,795 745,107 4,856,314 4,579,227 1,402,452 4,079,515 808,722 274,432 53,867 6,618,988 435,773 479,854 548,523 781,402 5,367,300 4,544,476 1,555,056 3,965,793 1,158,665 413,946 144,933 7,238,393 445,744 565,967 616,894 846,061 6,515,672 5,183,601 1,872,153 4,048,497 1,271,481 463,412 194,042 7,849,585 393,647 526,531 563,735 798,908 6,552,348 5,171,326 1,859,955 3,834,904 1,373,742 493,302 202,743 7,764,646 318,063 411,354 421,363 625,156 5,426,870 4,658,883 1,599,322 3,451,459 1,569,650 488,345 232,085 7,340,861 310,847 391,968 357,089 517,282 4,679,519 3,913,235 1,198,861 2,852,998 1,547,157 417,724 246,851 6,263,591 325,371 430,536 371,566 463,472 4,072,127 2,776,626 703,122 1,761,904 1,034,041 287,913 214,226 4,001,206 330,554 439,156 364,169 421,160 3,518,138 2,046,170 457,516 1,192,255 647,905 201,939 150,150 2,649,765 340,244 439,208 346,442 389,874 3,173,406 1,648,736 326,665 984,739 481,051 173,576 112,034 2,078,065 368,278 477,175 379,358 401,075 2,886,842 1,444,612 228,173 848,315 366,619 148,827 84,154 1,676,088 311,184 373,165 309,122 345,830 2,441,335 1,184,846 148,506 613,255 252,369 122,802 57,503 1,194,435 243,782 263,255 196,550 236,864 1,567,591 699,886 87,408 367,501 144,537 72,914 32,976 705,336 223,144 222,361 142,973 201,384 1,111,519 499,971 73,644 316,657 115,008 60,403 28,767 594,479 4,492,879 5,506,115 5,187,579 6,773,575 52,168,981 38,351,595 11,512,833 28,317,792 10,770,947 3,619,535 1,754,331 55,975,438 8,660,547 10,031,338 9,613,226 8,627,452 60,187,167 47,702,582 12,610,665 30,281,908 10,878,161 3,655,895 1,761,188 59,187,817
Age 15 to 19 15 16 17 18 19 20 to 24 20 21 22 23 24 25 to 29 30 to 34 35 to 39 40 to 44 45 to 49 50 to 54 55 to 59 60 to 64 65 to 69 70 to 74 75 to 79 80 to 84 85 and over 25 and over Total
None-4th 5th-8th 0.6% 12.3% 0.3% 45.9% 0.4% 7.8% 0.5% 3.1% 0.7% 2.4% 1.1% 2.6% 1.3% 3.0% 1.2% 2.6% 1.2% 2.8% 1.3% 3.0% 1.4% 3.1% 1.4% 3.3% 1.4% 3.3% 1.5% 3.3% 1.6% 3.0% 1.7% 2.9% 1.8% 3.0% 1.9% 3.6% 2.2% 4.8% 2.8% 6.6% 3.5% 8.6% 3.7% 10.9% 3.9% 12.7% 4.2% 16.5% 5.5% 22.5% 2.2% 5.3% 2.0% 5.8%
9th 18.6% 40.8% 39.8% 7.0% 3.1% 2.7% 2.5% 2.6% 2.5% 2.5% 2.4% 2.4% 2.3% 2.1% 1.9% 1.7% 1.6% 1.8% 2.4% 3.1% 3.6% 4.1% 4.2% 4.9% 5.4% 2.5% 3.9%
PERCENTAGE OF POPULATION WITH DEGREES IN THE U.S. BY AGE GROUP (2000) 10th 11th 12th-No Diploma HS GradSome College AssociatesBachelor's Master'sProfessionalDoctoral Assoc+ 19.6% 18.4% 5.0% 12.9% 12.4% 0.2% 0.0% 0.0% 0.0% 0.0% 0.2% 11.2% 1.1% 0.2% 0.3% 0.1% 0.0% 0.0% 0.0% 0.0% 0.0% 0.0% 39.3% 10.7% 0.8% 0.9% 0.3% 0.0% 0.0% 0.0% 0.0% 0.0% 0.0% 37.3% 37.9% 7.1% 5.9% 1.2% 0.0% 0.0% 0.0% 0.0% 0.0% 0.0% 7.0% 34.2% 10.9% 23.1% 18.4% 0.1% 0.0% 0.0% 0.0% 0.0% 0.1% 4.0% 7.9% 5.9% 33.7% 41.3% 0.7% 0.2% 0.0% 0.0% 0.0% 1.0% 3.2% 4.0% 4.5% 28.7% 36.2% 5.6% 10.3% 0.6% 0.2% 0.0% 16.6% 3.6% 4.8% 5.0% 31.1% 45.4% 2.9% 0.7% 0.1% 0.0% 0.0% 3.6% 3.4% 4.2% 4.6% 29.8% 43.3% 5.4% 2.7% 0.1% 0.1% 0.0% 8.3% 3.2% 3.9% 4.4% 28.5% 35.9% 6.4% 10.4% 0.3% 0.2% 0.0% 17.3% 3.0% 3.7% 4.3% 27.2% 29.0% 6.8% 18.1% 0.8% 0.3% 0.0% 25.9% 2.8% 3.6% 4.3% 26.5% 26.1% 6.7% 20.8% 1.7% 0.4% 0.1% 29.7% 2.5% 3.0% 3.9% 25.3% 23.8% 7.3% 21.2% 4.2% 1.4% 0.3% 34.5% 2.4% 2.7% 3.8% 26.4% 22.3% 7.6% 19.5% 5.7% 2.0% 0.7% 35.5% 2.5% 2.7% 3.7% 28.2% 22.5% 8.1% 17.5% 5.5% 2.0% 0.8% 34.0% 2.3% 2.5% 3.5% 28.7% 22.7% 8.1% 16.8% 6.0% 2.2% 0.9% 34.0% 2.0% 2.1% 3.1% 26.9% 23.1% 7.9% 17.1% 7.8% 2.4% 1.2% 36.4% 2.3% 2.1% 3.0% 26.9% 22.5% 6.9% 16.4% 8.9% 2.4% 1.4% 36.0% 3.2% 2.8% 3.5% 30.4% 20.7% 5.3% 13.2% 7.7% 2.2% 1.6% 29.9% 4.1% 3.4% 3.9% 32.6% 19.0% 4.2% 11.1% 6.0% 1.9% 1.4% 24.6% 4.6% 3.6% 4.1% 33.2% 17.2% 3.4% 10.3% 5.0% 1.8% 1.2% 21.7% 5.3% 4.2% 4.5% 32.3% 16.2% 2.6% 9.5% 4.1% 1.7% 0.9% 18.8% 5.1% 4.2% 4.7% 33.1% 16.0% 2.0% 8.3% 3.4% 1.7% 0.8% 16.2% 5.3% 4.0% 4.8% 31.8% 14.2% 1.8% 7.5% 2.9% 1.5% 0.7% 14.3% 5.3% 3.4% 4.8% 26.7% 12.0% 1.8% 7.6% 2.8% 1.5% 0.7% 14.3% 3.0% 2.8% 3.7% 28.6% 21.0% 6.3% 15.5% 5.9% 2.0% 1.0% 30.7% 4.5% 4.3% 3.9% 27.2% 21.6% 5.7% 13.7% 4.9% 1.7% 0.8% 26.8%
PERCENT DIFFERENCE BETWEEN AZ & U.S. IN PERCENTAGE OF POPULATION WITH DEGREES BY AGE GROUP (2000) None-4th 5th-8th 9th 10th 11th 12th-No Diploma HS GradSome College AssociatesBachelor's Master'sProfessionalDoctoral Assoc+ 15 to 19 0.3% 1.0% -0.3% -0.3% -0.7% 0.6% 0.5% -1.0% 0.0% 0.0% 0.0% 0.0% 0.0% 0.1% 15 0.1% -0.2% -1.8% 1.3% 0.3% -0.1% 0.2% 0.2% 0.0% 0.0% 0.0% 0.0% 0.0% 0.0% 16 0.1% 0.4% -2.0% -0.4% 0.5% 0.5% 0.6% 0.2% 0.0% 0.0% 0.0% 0.0% 0.0% 0.0% 17 0.3% 1.5% 0.8% -2.6% -2.1% -0.1% 1.3% 0.9% 0.0% 0.0% 0.0% 0.0% 0.0% 0.0% 18 0.3% 1.7% 1.6% 0.8% -2.7% 0.9% -0.1% -2.5% 0.0% 0.0% 0.0% 0.0% 0.0% 0.0% 19 0.4% 1.7% 0.8% 0.8% 1.0% 1.3% -0.9% -5.2% 0.1% 0.1% 0.0% 0.0% 0.0% 0.2% 20 to 24 0.4% 2.2% 1.2% 0.6% 0.9% 0.9% -1.9% -0.8% -0.5% -2.8% -0.2% 0.0% 0.0% -3.6% 20 0.6% 2.2% 1.0% 0.4% 1.2% 1.3% -1.8% -5.0% 0.1% 0.0% 0.0% 0.0% 0.0% 0.1% 21 0.5% 2.0% 1.0% 0.6% 1.1% 1.1% -2.2% -2.8% -0.8% -0.4% 0.0% 0.0% 0.0% -1.3% 22 0.5% 2.5% 1.5% 0.6% 0.9% 0.7% -1.3% -0.9% -0.3% -4.1% 0.0% 0.0% 0.0% -4.5% 23 0.3% 1.9% 0.8% 0.9% 0.7% 1.2% -2.1% 3.2% -1.0% -5.5% -0.4% 0.0% 0.0% -6.9% 24 0.3% 2.6% 1.5% 0.7% 0.5% 0.5% -1.7% 2.4% -0.6% -5.3% -0.8% -0.1% -0.1% -6.9% 25 to 29 0.3% 2.0% 0.8% 0.5% 0.5% 1.0% -2.7% 3.2% -0.3% -3.6% -1.1% -0.5% -0.1% -5.6% 30 to 34 0.1% 2.1% 0.7% 0.2% 0.5% 0.6% -3.8% 3.8% -0.3% -2.3% -1.1% -0.4% -0.2% -4.3% 35 to 39 0.3% 1.8% 0.3% 0.0% 0.0% 0.2% -4.8% 4.6% -0.1% -1.2% -0.7% -0.3% -0.2% -2.5% 40 to 44 0.5% 1.8% 0.0% -0.3% -0.1% 0.2% -5.7% 4.9% 0.3% -0.9% -0.3% -0.3% -0.2% -1.5% 45 to 49 0.3% 1.2% -0.2% -0.4% -0.2% 0.0% -5.5% 5.2% 0.9% -0.6% -0.5% -0.3% 0.0% -0.4% 50 to 54 0.2% 0.5% -0.5% -0.7% -0.5% -0.2% -6.3% 6.2% 1.4% 0.3% 0.0% -0.3% -0.2% 1.2% 55 to 59 0.4% -0.3% -1.0% -0.9% -1.0% -0.4% -5.9% 6.8% 1.3% 0.9% 0.6% -0.4% -0.1% 2.3% 60 to 64 0.2% -1.1% -0.9% -1.3% -1.1% -0.5% -5.5% 6.6% 1.1% 1.8% 1.0% -0.1% -0.1% 3.7% 65 to 69 -0.2% -2.5% -1.3% -1.5% -1.0% -0.5% -4.8% 7.0% 1.3% 2.3% 0.7% 0.3% 0.2% 4.8% 70 to 74 0.2% -3.9% -1.4% -1.4% -1.3% -0.3% -3.4% 7.2% 1.0% 2.1% 0.9% 0.2% 0.2% 4.4% 75 to 79 -0.7% -5.4% -1.3% -1.5% -1.2% -0.2% -1.7% 7.7% 0.7% 2.3% 1.1% 0.1% 0.2% 4.3% 80 to 84 -0.9% -6.8% -1.7% -1.5% -1.2% -0.2% 0.6% 7.6% 0.3% 2.2% 0.8% 0.3% 0.3% 4.0% 85 and over -0.4% -8.8% -1.6% -0.7% -0.6% 0.0% 1.4% 6.1% 0.2% 2.3% 1.1% 0.8% 0.3% 4.7% 25 and over 0.2% 0.1% -0.2% -0.4% -0.3% 0.1% -4.3% 5.3% 0.4% -0.4% -0.2% -0.2% -0.1% -0.5% Total 0.2% 0.4% -0.1% -0.3% -0.2% 0.2% -3.7% 4.3% 0.3% -0.6% -0.2% -0.2% 0.0% -0.8%
2005 Las Vegas Phoenix Salt Lake City San Diego Seattle Denver Austin
19.9% 26.7% 28.6% 34.0% 35.8% 36.8% 39.1%
PERCENT BACHELOR'S DEGREE OR HIGHER FOR POPULATION OVER 25 2006 2007 2008 2009 20.2% 21.4% 21.9% 21.7% 27.1% 26.6% 26.5% 27.3% 30.1% 29.4% 30.0% 29.7% 33.3% 33.5% 34.1% 34.6% 36.1% 36.2% 36.2% 37.4% 35.6% 36.5% 37.5% 37.6% 38.8% 38.4% 38.2% 38.7%
2010 21.6% 27.2% 29.0% 33.7% 37.0% 38.2% 39.4%
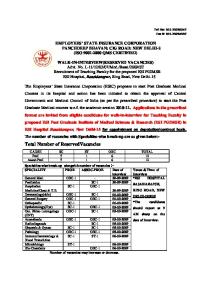
chart-main-title Percentage Point Difference Between Arizona and the U.S. in the Age Groups Having Earned an Associate's D chart-axis-header Associates or above 20 0.1% 21 -1.3% 22 -4.5% 23 -6.9% 24 -6.9% 25 to 29 -5.6% 30 to 34 -4.3% 35 to 39 -2.5% 40 to 44 -1.5% 45 to 49 -0.4% 50 to 54 1.2% 55 to 59 2.3% 60 to 64 3.7% 65 to 69 4.8% 70 to 74 4.4% 75 to 79 4.3% 80 to 84 4.0% 85 and over 4.7%
chart-main-title Percentage Point Difference Between Arizona and the U.S. in the Age Groups Having Earned an Associate's D chart-axis-header Associates or above 18 to 24 years -2.3% 25 to 34 years -5.6% 35 to 44 years -4.7% 45 to 64 years -0.7% 65 years and over 5.1% chart-title Percentage Point Difference Between Arizona and the U.S. in the Age Groups Having Earned an Associate's D 18 to 24 years -2.9% 25 to 34 years -6.6% 35 to 44 years -4.7% 45 to 64 years -0.7% 65 years and over 4.5% chart-title Percentage Point Difference Between Arizona and the U.S. in the Age Groups Having Earned an Associate's D 18 to 24 years -2.2% 25 to 34 years -6.6% 35 to 44 years -5.3% 45 to 64 years -0.4% 65 years and over 3.5%
chart-main-title Percent Bachelor's Degree or Higher for Population 25+ chart-axis-header2005 2006 2007 2008 2009 Las Vegas 19.9% 20.2% 21.4% 21.9% 21.7% Phoenix 26.7% 27.1% 26.6% 26.5% 27.3% Salt Lake City 28.6% 30.1% 29.4% 30.0% 29.7% San Diego 34.0% 33.3% 33.5% 34.1% 34.6% Seattle 35.8% 36.1% 36.2% 36.2% 37.4% Denver 36.8% 35.6% 36.5% 37.5% 37.6% Austin 39.1% 38.8% 38.4% 38.2% 38.7%
2010 21.6% 27.2% 29.0% 33.7% 37.0% 38.2% 39.4%
chart-main-title Percent Bachelor's Degree or Higher for Population 25+ in Arizona Cities chart-axis-header2010 United States 28.2% Tucson 28.2% Phoenix-Mesa-
Scottsdale 27.3% Flagstaff 26.6% Arizona 25.9% Prescott 23.1% Yuma 13.9% Lake Havasu
City-Kingman 12.2%
LastUpdate SourceLine SourceURL SourceLine Dataset Description
08/12/10 U.S. Department of Commerce, Census Bureau, 2000 Census http://www.census.gov/main/www/cen2000.html U.S. Census Bureau, American Community Survey, Single Year Estimates A central theme of the economic literature on regional economic growth is the importance of high-quality human capital in the workforce. Educational attainment of the working-age population is a measure of the quality of the labor force available to innovative companies. The younger population is of particular importance. The difference in educational attainment between Arizona and the nation in 2000 is expressed in this indicator. Attainment is defined in this case as the share of the population having earned an associate’s degree or more education. The data are presented for selected age groups, with an emphasis on those of working age.
Technical Notes Viz1 - How are we doing? Viz2 - How are we doing?
Coming from the long-form questionnaire of the decennial census, the data are subject to sampling error. The share of the 25 and older population with a bachelor's degree varied substantially within the state from a high of 28% in Tucson MSA (Pima County) to a low of 12% in Lake Havasu City MSA.
chart-main-title Per Capita Personal Income and Percent of Population with a Bachelor's Degree chart-axis-header 5% 10% 15% 20% 25% 30% 0.10662,2 0.16229,3 0.20338,3 0.24402,3 3862.754 0052.218 3477.189 9020.592 United 0.077,16710.8108108108 States 1827542 7902188 1891892 020592 0.28239791 0.091,15200. Arizona 0.126,22372.7927927928 3539253539 0.174,28244.4993564994 0.203,29069.8378378378 0.235,33839.1248391248 0.3%
chart-main-title chart-axis-header < $30,000 [Bottom 10%] $30,000 - $38,000 [10% - 25%] $38,000 - $46,000 [25% - 50%] $46,000 - $57,000 [50% - 75%] > $57,000 [Top 25%]
Earnings by Educational Expectations for the Arizona Workforce 2010 10% 12% 21% 57%
chart-main-title chart-axis-header Advanced Degree Bachelor's Degree Some College Long-term Training Unskilled Labor
Educational Attainment in Arizona for Current Workforce Over Age 55 2013 24% 21% 19% 20% 18%
chart-main-title chart-axis-header High Skill Workers Low Skill Workers
Number of Jobs and Total Earnings for Arizona Workforce by Skill Level Jobs Total Earnings 43% 61% 57% 39%
chart-main-title chart-axis-header Arizona Workforce
Percent of ASU/UofA/NAU Graduates in Arizona's Current Workforce 1991 1992 1993 1994 1995 1996 1997 1998 1999 2000 2001 2002 2003 2004 2005 2006 2007 2008 2009 2010 2011 38% 39% 39% 42% 44% 44% 43% 43% 45% 46% 46% 48% 49% 51% 52% 55% 56% 56% 58% 63% 69%
chart-main-title chart-axis-header High School Diploma or More Bachelor's Degree or More
Educational Attainment in Arizona as a Ratio to the National Average, Age 25 and Older 1940 1950 1960 1970 1980 1990 120% 112% 111% 111% 109% 105% 137% 124% 118% 118% 107% 100%
2000 101% 96%
2013 99% 93%
chart-main-title chart-axis-header 25-34 35-44 45-64 65+
Educational Attainment in Arizona as a Ratio to the National Average by Age Group, 200 High School Diploma or More Bachelor's Degree or More 97% 80% 97% 88% 99% 96% 107% 114%