Job No.1789–TCRP #100
632 pages; Perfect Bind with SPINE COPY = 6p4.5 pts
PMS 2945
TCRP Report 100
TRANSPORTATION RESEARCH BOARD
500 Fifth Street, NW
Washington, DC 20001
ADDRESS SERVICE REQUESTED
TRANSIT COOPERATIVE RESEARCH PROGRAM Sponsored by the Federal Transit Administration
TCRP REPORT 100
Transit Capacity and Quality of Service Manual–2nd Edition
2nd Edition
Transit Capacity and Quality of Service M A N U A L
PAID
NON-PROFIT ORG. U.S. POSTAGE
WASHINGTON, D.C. PERMIT NO. 8970
55359_NAS_FRNT_MTR
12/20/03
6:31 AM
Page i
TRANSIT COOPERATIVE RESEARCH PROGRAM
TCRP REPORT 100 Transit Capacity and Quality of Service Manual 2nd Edition
KITTELSON & ASSOCIATES, INC. Orlando, FL
KFH GROUP, INC. Bethesda, MD
PARSONS BRINCKERHOFF QUADE & DOUGLASS, INC. New York, NY
DR. KATHERINE HUNTER-ZAWORSKI Corvallis, OR
S UBJECT A REAS
Planning and Administration • Public Transit • Rail • Marine Transportation
Research Sponsored by the Federal Transit Administration in Cooperation with the Transit Development Corporation
TRANSPORTATION RESEARCH BOARD WASHINGTON, D.C. 2003 www.TRB.org
Transit Capacity and Quality of Service Manual—2nd Edition CHAPTER 2. QUALITY OF SERVICE CONCEPTS INTRODUCTION Quality of service is defined as follows: Quality of service defined.
“The overall measured or perceived performance of transit service from the passenger’s point of view.” While transit capacity issues are mainly concentrated in larger cities, transit quality of service is important to all communities. Transit quality of service measures reflect two important aspects of transit service: (1) the degree to which transit service is available to given locations and (2) the comfort and convenience of the service provided to passengers. Quality of service measures differ from both traditional highway service quality measures, which are more vehicle-oriented than personoriented, and from the numerous utilization and economic performance measures routinely collected by the transit industry, which tend to reflect the transit operator’s point-of-view.
TRANSIT PERFORMANCE MEASUREMENT Many of the performance measures used in the transit industry—particularly those collected for the National Transit Database—reflect the business aspects of running a transit agency. The measures traditionally used by transportation engineers and planners for roadway design and planning, such as those given in the Highway Capacity Manual, reflect conditions experienced by vehicles using those roadways, but not necessarily the conditions experienced by persons in those vehicles, particularly when those vehicles are transit vehicles carrying a number of passengers. An emerging area of transit performance measurement is the impact that transit has on the community it serves, in terms of jobs created or supported, property value increases resulting from investments in transit service, reductions in pollution or congestion, and so on.
Performance measurement points of view.
The TCQSM focuses on measures that reflect the quality of the service provided to transit passengers. These measures reflect the kinds of decisions potential passengers make, consciously or not, when deciding whether to use transit or another mode, usually the private automobile. TCRP Report 88 defines five categories of measures that wholly or partially reflect the passenger’s point-of-view:(R4) •
Availability: how easily passengers can access and use transit service;
•
Service Monitoring: measures of passengers’ day-to-day experiences using transit;
•
Travel Time: how long it takes to make a trip;
•
Safety and Security: real and perceived chances of being involved in an accident (safety) or being the victim of a crime (security) while using transit; and
•
Maintenance and Construction: impacts of maintenance program quality and construction activity on passenger trips.
Of these categories, availability is the most important, because it determines whether or not transit is even a potential mode choice, regardless of the quality of the trip. Unlike the automobile mode, which has near-universal access to locations, and (for those who have access to an automobile) provides the ability to be used for trips at any desired time, transit service is limited to specific areas and specific times. Further, transit service is usually not available to one’s door, so a potential transit passenger must find a way to get to a location served by transit. Part 1/INTRODUCTION AND CONCEPTS
Page 1-7
Chapter 2—Quality of Service Concepts
Transit Capacity and Quality of Service Manual—2nd Edition Comfort and convenience includes measures from all of the remaining categories, but concentrates on measures in two categories—service monitoring and travel time—that research indicates are both highly important to passengers and relatively easily quantified. Safety and security, while very important to customers, is based as much on perception as on actual circumstances, and thus is difficult to quantify or to predict the effects of actions designed to improve safety or security. The quality of an agency’s maintenance program impacts passengers as an aspect of service reliability when vehicle breakdowns or a shortage of replacement vehicles leads to missed service.
TRANSIT AVAILABILITY There are a number of conditions that affect transit availability, all of which need to be met for transit to be an option for a particular trip: •
Transit must be provided near one’s trip origin. If demand-responsive service is not provided to one’s door, a transit stop must be located within walking distance and the pedestrian environment in the area should not discourage walking (e.g., due to a lack of sidewalks, steep grades, or wide or busy streets). Persons with disabilities require a continuous ADA-accessible path to the transit stop. One may also be able to ride a bicycle to a transit stop if bicycle storage facilities are available at the stop or if bicycles can be carried on transit vehicles. Similarly, one may be able to drive to a park-and-ride lot if such a lot is provided along the way and space is available in the lot.
•
Transit must be provided near one’s destination. The same kinds of factors discussed for the trip origin apply to the trip destination as well, except that bicycles or automobiles left behind at the boarding transit stop will not be available to passengers at their destination.
•
Transit must be provided at or near the times required. In most cases, service must be available for both halves of a round trip—from one’s origin to one’s destination, as well as for the return trip. If passengers perceive a risk of missing the final return trip of the day, or if transit is available for only one of the two halves of passengers’ round trips, transit is less likely to be an option for those passengers.
•
Passengers must be able to find information on when and where transit service is provided and how to use transit. If passengers are unable to find out where to go to board transit, where they need to transfer, how much the fare will be, and so forth, transit will not be an option.
•
Sufficient capacity must be provided. If a transit vehicle must pass up passengers waiting at a stop because the vehicle is already full, transit service was not available at that time to the passengers waiting at the stop.
If all of these conditions are met, transit is an option for a particular trip. Whether or not a passenger will decide to use transit will depend on the comfort and convenience of the service relative to competing modes.
TRANSIT COMFORT AND CONVENIENCE Unlike transit availability, the kinds of questions weighed by potential passengers when assessing the comfort and convenience of transit service are often not all-or-nothing. Each person assesses particular comfort and convenience factors differently, depending on his or her own needs and situation. A passenger’s decision to use transit rather than a competing mode (when transit is an option) will depend on how well transit service quality compares with that of competing modes.
Chapter 2—Quality of Service Concepts
Page 1-8
Part 1/INTRODUCTION AND CONCEPTS
Transit Capacity and Quality of Service Manual—2nd Edition Some of the more important factors that affect transit comfort and convenience are the following: •
Passenger loads aboard transit vehicles. It is more uncomfortable to stand for long periods of time and the time spent standing may not be able to be used for more productive or relaxing purposes, such as reading.
•
The kinds of passenger amenities provided at transit stops.
•
The reliability of transit service. Are passengers assured of getting to their destinations at the promised time or must they allow extra time for frequently irregular service?
•
Door-to-door travel times, by themselves, and in relation to other modes.
•
The out-of-pocket cost of using transit, relative to other modes.
•
Passengers’ perceptions of safety and security at transit stops, on board vehicles, and walking to and from transit stops.
•
Whether transfers are required to complete a trip.
•
The appearance and comfort of transit facilities.
QUALITY OF SERVICE FRAMEWORK The key measures in the areas of transit availability and transit comfort and convenience that are important to passengers and can be relatively easily quantified are presented in the form of quality of service frameworks. These frameworks—one for fixed-route service and one for demand-responsive service—each provide service measures of availability and service measures of comfort and convenience. Quality of service is quantified by six levels of service for each service measure. For fixed-route transit, LOS ranges from “A” (best) through “F” (worst). For demandresponsive transit, LOS ranges from “1” (best) through “8” (worst). Depending on the application, these service measures can be used individually to assess transit quality of service for a transit stop, route segment, or system, or they can be combined into a transit “report card” to provide a broader perspective. The availability measures, along with the travel time measures, are particularly suited to short- and long-term planning efforts, while the remaining comfort and convenience measures in each framework are well suited for ongoing service delivery monitoring. As not every factor that affects transit quality of service can be accounted for by these service measures, it is important for planners and analysts not to lose sight of the broader issues that influence transit quality of service by concentrating solely on calculations of LOS. Part 3 of the TCQSM discusses other factors that should also be considered for measurement, depending on local needs and goals. Exhibit 1-1 presents the quality of service framework for fixed-route transit, while Exhibit 1-2 presents the framework for demand-responsive transit.
Availability Comfort & Convenience
Availability Comfort & Convenience
Transit Stop Frequency Passenger Load
Response Time On-Time Performance
Part 1/INTRODUCTION AND CONCEPTS
Service Measures Route Segment System Hours of Service Service Coverage Reliability Transit-Auto Travel Time
Exhibit 1-1 Quality of Service Framework: Fixed-Route Transit
Service Measures Span of Service Trips Not Served DRT-Auto Travel Time
Exhibit 1-2 Quality of Service Framework: Demand-Responsive Transit
Page 1-9
Chapter 2—Quality of Service Concepts
Transit Capacity and Quality of Service Manual—2nd Edition QUALITY OF SERVICE RELATIONSHIPS Capacity and Speed Measures that an agency takes to improve quality of service may have both positive and negative effects on capacity and speed, and vice versa. This section looks at some measures often considered as part of bus rapid transit projects to examine their impacts on quality of service, capacity, and speed.
Increased Stop Spacing Increasing the distance between stops (by consolidating stops or providing limited-stop or express service in combination with local service) speeds up service, as buses have to stop fewer times. However, passengers are distributed among fewer stops, so more passengers board at each stop. More boarding passengers result in longer dwell times and reduced bus capacity and speed, but also allow for a greater level of stop amenities. Quality of service is positively impacted by the net increase in travel speeds and the improved stop amenities, but negatively impacted by the longer distances some passengers must travel to walk to a stop.
Low-Floor Buses Passenger boarding times are faster with low-floor buses, as no steps need to be climbed, which leads to shorter dwell times. Shorter dwell times result in faster travel times and greater stop and facility capacities. However, low-floor buses have fewer seats than equivalent high-floor buses, resulting in potentially lower person capacities. Quality of service is positively impacted by the faster travel times and ease of boarding, but is negatively impacted by the greater probability of having to stand, compared to a high-floor bus.
Traffic Signal Priority Priority measures reduce delays for buses at traffic signals. Fewer delays translate into higher speeds, and the longer green times for buses increase the roadway’s bus capacity. Finally, the improved travel times and reliability that result from traffic signal priority have positive impacts on quality of service.
Proof-of-Payment Fare Collection Proof-of-payment fare collection shortens the per-passenger boarding time, as no farebox is needed, and greatly shortens the overall boarding time required, as passengers are able to board through all doors. The decreased dwell time results in faster speeds and greater bus capacities, while the improved speeds have a positive impact on quality of service.
Increased Service Frequency Service frequency improvements will spread existing passengers over a greater number of buses, reducing the dwell time associated with the existing passengers. This time savings will be partially or, in some cases, wholly offset by the additional dwell time required to serve new passengers attracted to the more frequent service. The overall result will range from no net impact on speed to an increase in speed. However, if the facility used by the additional buses is operating toward the upper limit of its capacity, the increased bus congestion may result in lower speeds. Increased frequency will significantly increase the person capacity of the route. However, at higher frequencies (typically, headways of 10 minutes or less), bus bunching is more likely to occur, resulting in some of the added capacity being unutilized. Chapter 2—Quality of Service Concepts
Page 1-10
Part 1/INTRODUCTION AND CONCEPTS
Transit Capacity and Quality of Service Manual—2nd Edition Quality of service is impacted positively by the improved frequencies and potentially lower per-bus loading. It may be impacted negatively if service reliability suffers due to bus bunching (which would also result in some buses being particularly crowded), or if travel times suffer due to increased bus congestion.
Ridership Improvements in quality of service can result in increases in ridership, which in many cases, can result in an improvement in an agency’s financial performance. It should be noted that, if ridership increases sufficiently, additional service must be added and additional costs might be incurred. Also, the opposite is often true in ADA paratransit service,(R4) where most trips are made with only one passenger: increased ridership results in increased agency costs, without the economies of scale that apply to fixed-route service. The impacts of quality of service on ridership are usually estimated using one of two methods. Discrete choice models estimate the probability that a traveler will use a particular mode choice (e.g., transit) from a variety of mode choice options available. Given a known number of travelers in an area, the number of people using each mode can thus be estimated. Elasticity relates the observed percent change in ridership to the percent change in some other factor (e.g., fares, headways, etc.) A presentation of detailed procedures for estimating ridership is beyond the scope of this manual, and readers are referred to textbooks on discrete choice models and to TCRP Web Document 12(R7) (which has been re-published as TCRP Report 95) for further information. However, some general guidelines on the impacts of quality of service changes on ridership are presented below, based on information from TCRP Web Document 12.
Response to Service Frequency Changes Ridership is more responsive to changes in service frequencies when the existing service is infrequent (30-minute headways or longer), in middle- and upper-income areas, and when the distances traveled are short enough that walking is an option. Ridership is less responsive when service was already relatively frequent, in lowerincome areas, and when most trips are long. All other factors being equal, climate (which affects passenger comfort while waiting for service), the condition of the local economy, the overall agency image, and the ways the new service is marketed will also affect the amount of the response. Observed elasticities generally range from 0.0 (no change in ridership) to +1.0 (i.e., a 1% increase in frequency results in a 1% increase in ridership), with an average elasticity in the range of +0.3 to +0.5. More recent observations have grouped around either +0.3 (mainly central city urban systems) or +1.0 (suburban systems with positive images undergoing planned, comprehensive service increases). Limited research suggests that improvements in hours of service can be as important as improvements in service frequency. Commuter rail elasticities related to service frequency are generally higher than those for buses, in part because commuter rail frequencies tend to be relatively low. Observed headway elasticities range from –0.7 to –0.9 for headways greater than 50 minutes (i.e., a 1% increase in headway results in a 0.7 to 0.9% decrease in ridership), and from –0.4 to –0.6 at shorter headways. In contrast, light rail and heavy rail elasticities related to service frequency are typically less than those for buses because these rail modes already operate at relatively high frequencies.
Part 1/INTRODUCTION AND CONCEPTS
Page 1-11
Chapter 2—Quality of Service Concepts
Transit Capacity and Quality of Service Manual—2nd Edition Response to Reliability Changes Reports of passenger responses to decreases in reliability are mostly anecdotal, indicating that ridership is lost when service is perceived to be unreliable. Part of this response can be attributed to additional wait time incurred when transit vehicles leave early or are late (or never arrive at all), and part can be attributed to passenger uncertainty, anxiety, and annoyance. London Transport has estimated that elasticities due to unplanned service losses (e.g., scheduled vehicle-miles not operated) are 33% larger than elasticities related to planned service cuts.(R12) An analysis of automatic vehicle location (AVL) and automated passenger counter (APC) data in Portland, Oregon found that a 10% reduction in headway delay variation (the average absolute value of the difference between the actual and scheduled headway) on radial bus routes during the a.m. peak hour led to an increase of 0.17 passengers per trip per timepoint.(R3)
Response to Service Coverage Changes Average elasticities of service expansions of existing systems (measured in terms of bus-miles or bus-hours) range from +0.6 to +1.0, with the higher values occurring in areas where the existing service level is below average, such as in small cities and suburbs, and during off-peak hours. (Note that existing ridership is often low in these situations, and that the same number of new passengers will result in a greater percentage increase in ridership when starting from a low ridership level than from a higher ridership level.) Packages of improvements, combining better routes and schedules, with new buses and/or reduced fares have been found to do particularly well in attracting new ridership. Studies of service expansions since the 1960s—whether by extending existing routes, or by adding reverse-commute or suburb-to-suburb routes—indicate a success rate (i.e., the service was retained after the experimental period) at or slightly higher than 50 percent. New bus routes take 1 to 3 years to reach their full patronage potential, while entirely new bus systems may take even longer. New residential and multi-purpose feeders to line-haul bus and commuter rail services tend to attract 100 to 600 daily trips after 2 to 3 years, while single-employer shuttles are in the range of 25 to 600 daily trips.
Response to Fare Changes Peak-period riders, persons traveling to and from work, and captive riders are significantly less responsive to fare changes than others. Passengers in larger cities are less sensitive to fare increases than are passengers in smaller cities. Perhaps similarly, ridership is less sensitive in areas where transit is in a competitive price and service position relative to the automobile. Elasticities do not appear to be different for large fare changes compared with small changes, nor for fare increases versus fare decreases. The average elasticity of bus fare changes is –0.40 (i.e., a 1% fare increase results in a 0.4% decrease in ridership). The elasticity of rapid transit fare changes is about half as great, averaging –0.17 to –0.18. Off-peak ridership sensitivity is generally twice as sensitive as peak ridership, as new or infrequent riders are attracted to transit as a result of fare decreases. Peak-period riders, with the exception of senior citizens, tend not to shift travel to off-peak periods in response to off-peak fare reductions. The average senior citizen fare elasticity is –0.21. With the exception of downtown free-ride zones, eliminating fares systemwide results in no greater increase in ridership than would be predicted from a 100% fare reduction. Downtown free-ride zones and free shuttles are attractive for lunchtime trips and often attract trips previously made by walking. Chapter 2—Quality of Service Concepts
Page 1-12
Part 1/INTRODUCTION AND CONCEPTS
Transit Capacity and Quality of Service Manual—2nd Edition CHAPTER 3. CAPACITY CONCEPTS INTRODUCTION Transit agencies may consider themselves fortunate when they have capacity problems—it indicates a strong demand for their service. However, for the majority of small and mid-size transit systems, capacity constraints are usually not an issue— sufficient demand exists to provide service only once or twice per hour on most routes and more frequently on the busiest routes. However, even smaller systems may experience capacity issues in downtown areas where a number of routes may converge. Why, then, should transit agencies and transportation planners be concerned with transit capacity? There are a number of reasons: •
Improving speed and reliability. The same factors that influence transit capacity also influence speed and reliability. Faster, more reliable service is an important quality of service issue for passengers. From an agency perspective, speed improvements reduce the time required for a vehicle to travel a route, while reliability improvements may allow reductions in the recovery time provided in the schedule at the end of each run.1 In the bestcase scenario for an agency, the combined reduction in running and recovery time would be greater than or equal to one headway, allowing a vehicle to be assigned to other service. More typically, the time saved postpones the need to add more service in order to maintain a particular headway due to congestion.
•
Managing passenger loads. Capacity plays a role in determining how many cars or trains are needed to provide a desired quality of service in terms of passenger loading.
•
Forecasting the effects of changes in fare collection procedures, vehicle types, or other agency decisions. Dwell time, the time a vehicle spends stopped to load and unload passengers, is often the key determinant of speed and capacity. Changes that impact passenger service times may create unanticipated impacts on running times, passenger loads, or vehicle bunching, which may entail additional costs to correct. Changes in vehicle types (e.g., switching from standard to articulated buses, or high-floor to low-floor buses) may also have dwell time and passenger capacity impacts.
•
Planning for the future. Planning studies may suggest more than one possible mode or service type to meet a particular travel demand. Knowledge of the speed and capacity provided by each option is essential for making an informed decision. New light rail systems are sometimes developed with built-in capacity constraints to help reduce initial costs. Knowing how much of a constraint will exist is important for comparing short-term savings with long-term costs.
Factors influencing capacity also influence speed and reliability.
1 The scheduled time between when a transit vehicle ends one run and departs for the next run is typically divided into two parts, layover time and recovery time. Layover time is a set amount of time, usually stipulated in the union contract, to provide a break for the operator. Recovery time is at least partially an allowance for run time variations to make sure that an operator can get a full break and still depart for the next run on time. (It may also represent additional time needed to provide clock headways—consistent departure times each hour—or for the operator to perform other duties at the end of the run.) When the variation in running times is less, due to improved reliability, it may be possible to reduce recovery time. TCRP Report 30(R6) provides more information on transit scheduling. Part 1/INTRODUCTION AND CONCEPTS
Page 1-13
Chapter 3—Capacity Concepts
Transit Capacity and Quality of Service Manual—2nd Edition •
Analyzing the operation of major bus streets in large cities and the areas around transit centers in all sizes of communities. Small cities that operate a small number of buses will often have all of the buses meet at a central location. Because delays in bus arrivals will often result in delays to the other bus departures (to avoid missing transfers), efficient bus access to and from the transit center is important. Larger cities will often have a number of routes converge on a small number of downtown streets, and the capacity procedures can be used to analyze the operation of those streets.
•
Special event service. Transit agencies are often called on to provide service to community festivals, county fairs, sporting events, and the like, often providing service to the event site from remote parking areas. The procedures in this manual can be used to help size passenger waiting areas at the event site and to help determine the appropriateness of temporary transit preferential treatments (e.g., temporary bus lanes).
•
Transportation system management. Transit vehicles typically carry more passengers than automobiles do. As a result, an increase in transit vehicle capacity has the potential to increase the person capacity of a facility more than an increase in automobile vehicle capacity does.(R9)
Analysts who are familiar with the Highway Capacity Manual will find that transit capacity is different than highway capacity: it deals with the movement of both people and vehicles; depends on the size of the transit vehicles and how often they operate; and reflects the interaction between passenger traffic concentrations and vehicle flow. Transit capacity depends on the operating policy of the transit agency, which normally specifies service frequencies, allowable passenger loading, and the type of vehicle used to carry passengers. Accordingly, the traditional concepts applied to highway capacity must be adapted and broadened.(R9) The remainder of this chapter introduces the basic capacity concepts common to all public transit modes. Parts 4 through 7 of the TCQSM apply these concepts to the development of mode-specific capacity and speed procedures. Many of these concepts also have quality of service impacts, which are discussed in Part 3.
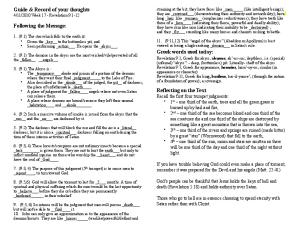
CAPACITY DEFINED Capacity Relationships Public transit service focuses on moving people from one place to another. In contrast to the automobile mode, where a large number of vehicles are used to transport a somewhat larger number of people, transit service works by using a relatively small number of vehicles to transport large numbers of people. As a result, transit capacity is focused more on the number of people that can be served in a given amount of time (person capacity), rather than the number of transit vehicles (vehicle capacity). However, determining the maximum number of vehicles that can be served in a given amount of time is often a necessary first step in determining the maximum number of people that can be served. Exhibit 1-3 illustrates the relationship between vehicle and person capacity, using a freeway lane as an example. The number of buses operated is set by the service provider. The number of cars that can operate in the lane used by buses reflects the passenger vehicle capacity of the freeway lane after deducting the vehicle equivalencies of the buses. The total person capacity thus represents the number of people that can be carried by the specified number of buses and the remaining passenger vehicles.
Chapter 3—Capacity Concepts
Page 1-14
Part 1/INTRODUCTION AND CONCEPTS
Transit Capacity and Quality of Service Manual—2nd Edition For the purposes of this example, the capacity of the freeway lanes is assumed to be 2,300 passenger vehicles per hour per lane (without buses), one bus is assumed to be the equivalent of 2 passenger vehicles, buses are assumed not to stop along the freeway, and buses and passenger vehicles are assumed to have average occupancies of 47 and 1.3, respectively, corresponding to typical major-city vehicle occupancies. It can be seen that, as the number of buses using a freeway lane increases to 300, the person capacity of that lane increases from about 3,000 to more than 16,800, while the vehicle capacity drops only from 2,300 to 2,000 (1,700 passenger vehicles plus 300 buses). Note that this figure only refers to capacity, not to demand or actual use. Exhibit 1-3 Examples of Freeway Vehicle and Person Capacity(R9)
2,500
Total Vehicles 2,250
Vehicles Per Lane Per Hour
2,000 1,750 1,500
Buses generally form a small percentage of the total vehicular volume on a roadway…
Cars
1,250 1,000 750 500 250
Buses
0 0
25
50
75
100
125
150
175
200
225
250
275
300
Buses Per Hour (No Stops)
18,000 16,000
People Per Lane Per Hour
14,000 12,000
Total People
10,000
…but have the ability to carry most of the people traveling on a roadway.
Cars
8,000 6,000
Buses 4,000 2,000 0 0
25
50
75
100
125
150
175
200
225
250
275
300
Buses Per Hour (No Stops)
Under this set of assumptions, a lane serving 60 to 65 buses per hour is carrying as many people as a lane filled to capacity with automobiles, with considerable remaining capacity to add more buses and carry more people. Under these conditions, a bus would pass by a given point along the lane about once per minute on average. One of the challenges in adopting exclusive lanes for buses is the public perception that the lane is virtually empty of vehicles, even when it is carrying a substantial number of people.
Part 1/INTRODUCTION AND CONCEPTS
Page 1-15
Chapter 3—Capacity Concepts
Transit Capacity and Quality of Service Manual—2nd Edition Exhibit 1-4 illustrates the two-dimensional nature of urban bus capacity. It can be seen that it is possible to operate many buses, each carrying few passengers. From a highway capacity perspective, the number of vehicles could be at or near capacity, even if they run nearly empty. Alternatively, few vehicles could operate, each overcrowded. The long waiting times and crowded conditions represent a poor quality of service from the passenger perspective. Finally, the domain of peak-period operations in large cities commonly involves a large number of vehicles, each heavily loaded. Crush Load (maximum people per vehicle)
F
Passenger Loading LOS (area/passenger)
Exhibit 1-4 Relationship Between Person and Vehicle Capacity(R9)
E
Maximum Design Load (peak) CROWDED VEHICLES FEW VEHICLES DOMAIN OF PEAKPERIOD OPERATIONS
Comfortable Standee Load
D
MANY VEHICLES FEW PASSENGERS
25% Seats Available
B 50% Seats Available
A
A
B
C
D
Maximum Vehicles Per Lane Per Hour
All Passengers Seated
C
E
F
Vehicle LOS (veh/h or veh/km or veh/mi)
Person Capacity The number of people that can be carried by a particular transit route or facility depends on a number of factors, some under the control of the transit operator and some not. At the most basic level, person capacity, expressed in persons per hour, is determined by the product of transit vehicle capacity (vehicles/hour) and the passenger capacity of those vehicles (persons/vehicle). Person capacity is a function of vehicle size, type, occupancy, degree of interaction with other vehicles, headway, and passenger arrival characteristics. The person capacity of a given transit route or facility can be defined as follows: “The maximum number of people that can be carried past a given location during a given time period under specified operating conditions; without unreasonable delay, hazard, or restriction; and with reasonable certainty.”
Person capacity defined.
This definition of person capacity is less absolute than definitions of vehicle capacity, due to the numerous factors involved: •
Chapter 3—Capacity Concepts
“A given location”: Capacity is determined at a specific location, typically the segment of a route or facility that carries the most people, known as the maximum load segment. The number of boardings over the length of a route may be considerably greater than this capacity, depending on how often passengers get on and off; the important thing to note is that no more people than the route’s person capacity will travel through the maximum load segment during the course of 1 hour.
Page 1-16
Part 1/INTRODUCTION AND CONCEPTS
Transit Capacity and Quality of Service Manual—2nd Edition •
“Specified operating conditions”: The number of people that can be carried depends on the number of vehicles operated and the size of those vehicles. It is important to specify whether the reported capacity reflects the current schedule (how many people can be carried), vehicle capacity (how many people could be carried if as many vehicles as possible were provided), or some other condition.
•
“Without unreasonable delay”: Person capacity is maximized when a constant queue of passengers exists to fill all available passenger spaces each time a vehicle arrives, as happens with amusement park rides, for example. Achieving this theoretical capacity requires that some or all passengers be passed up by the first vehicle to arrive, and often by subsequent vehicles. Transit passengers generally dislike pass-ups, particularly when there is a long wait involved for the next vehicle, although they may tolerate it for special event service, when they know another vehicle will be along shortly. Consequently, person capacity for transit must consider the number of people that can be carried, when it is desired that virtually all passengers will be able to board the first vehicle to arrive that goes to their destination.
•
“Without…hazard or restriction”: A key assumption in determining person capacity is the passenger capacity of each vehicle. The reported person capacity will be greater when people are assumed to be packed in tightly, but in practice, North Americans will not tolerate such conditions and will wait for another vehicle. Similarly, many long-distance transit services design for all passengers being seated, with no standees, both for passenger comfort and (with freeway operations) liability reasons.
•
“With reasonable certainty”: Capacity should reflect the number of people that can be carried on a sustained basis day after day, considering variations in passenger demand, traffic congestion, and other factors not under the control of the transit operator. More people than the reported capacity may sometimes be carried, but not most or all of the time.
Vehicle Capacity The vehicle capacity of a given transit route or facility can be defined as follows: “The maximum number of transit vehicles (buses, trains, vessels, etc.) that can pass a given location during a given time period.”
Vehicle capacity defined.
Vehicle capacity is known by different names in Parts 4 through 6 of this manual—for example, bus capacity, line capacity, and vessel capacity—but all of these names relate back to the number of transit vehicles that can be served during a given period of time, typically 1 hour. Ultimately, vehicle capacity depends on the minimum possible headway (time spacing) between individual transit vehicles. This minimum headway is dependent on control systems (e.g., traffic or train signals), passenger boarding and alighting demand at busy stops, and/or interactions with other vehicles (transit or otherwise). In many cases, the vehicle capacity of a transit route will not be achieved in actual operation. Sometimes this is a result of resource limitations, which means that not enough transit vehicles are available to provide the maximum possible vehicle capacity. In many cases, there simply might not be sufficient passenger demand to justify operation at the design capacity. The net result either way is that the service frequency operated is below that which is theoretically possible.
Part 1/INTRODUCTION AND CONCEPTS
Page 1-17
Chapter 3—Capacity Concepts
Transit Capacity and Quality of Service Manual—2nd Edition The following considerations are also important:(R9) 1.
Operations at “capacity” tend to strain transit systems, resulting in vehicle bunching and passenger delays. These operations do not represent desirable operating conditions. Moreover, most North American transit systems operate at capacity for a relatively short period of time, if at all.
2.
Capacity relates closely to system performance and service quality in terms of speed, comfort, and service reliability. A single fixed number often can be misleading. The concept of “productive capacity,” the product of passenger flow and speed, provides an important index of system efficiency.(R11)
3.
Capacities obtained by analytical methods must be cross-checked against actual operating experience for reasonableness.
TRANSIT CAPACITY FACTORS The major factors that influence transit capacity are given in Exhibit 1-5. Additional mode-specific factors are presented in Parts 4 through 7 of the TCQSM. Some of the factors listed below affect the number of passengers per vehicle, while others affect the number of vehicles or vehicle units that can pass a given location within a specified time period. Exhibit 1-5 Factors That Influence Transit Capacity(R8,R10)
VEHICLE CHARACTERISTICS • Number and height of steps • Allowable number of units per vehicle (i.e., single-unit bus, or multiple-car train) • Maximum speed • Acceleration and deceleration rates • Vehicle dimensions • Seating configuration and capacity • Type of door opening mechanism • Number, location, and width of doors • Number of wheelchair securement positions RIGHT-OF-WAY CHARACTERISTICS • Cross-section design (# of lanes, tracks) • Intersection design and control • Degree of separation from other traffic • Horizontal and vertical alignment STOP CHARACTERISTICS • Fare collection method • Amount of time stopped • Type of fare • Stop spacing • Common vs. separate boarding/alighting areas • Platform height vs. vehicle floor height • Passenger access to stops • Number and length of loading positions OPERATING CHARACTERISTICS • Intercity vs. suburban operations at terminals • Time losses to obtain clock headways, provide driver relief • Layover and schedule adjustment practices • Regularity of arrivals at a given stop PASSENGER TRAFFIC CHARACTERISTICS • Passenger concentrations and distribution at • Ridership peaking characteristics major stops STREET TRAFFIC CHARACTERISTICS • Volume and nature of other traffic • Presence of at-grade intersections METHOD OF HEADWAY CONTROL • Automatic or by train operator • Policy spacing between vehicles
Dwell Time Dwell time, the amount of time a transit vehicle spends at stops and stations serving passenger movements, is among the most important capacity factors. Dwell time at a given stop is directly related to the following factors:
Chapter 3—Capacity Concepts
•
Passenger boarding and alighting volumes. The more people that must be served, the longer it takes to serve them.
•
Fare payment method. Some fare payment methods require more time than others. Minimizing fare payment time is a key factor in reducing dwell time.
Page 1-18
Part 1/INTRODUCTION AND CONCEPTS
Transit Capacity and Quality of Service Manual—2nd Edition •
Vehicle type and size. Passengers spend less time boarding and alighting lowfloor buses than corresponding high-floor buses, particularly those passengers with strollers, bags or luggage, or disabilities. Multiple and/or wide doors that allow several people to board or alight simultaneously also help to expedite passenger movement.
•
In-vehicle circulation. Boarding and alighting occurs more slowly when standees are present. The amount of space available for standees and the aisle width also influence how passengers circulate within the vehicle. Passengers who exit buses through the front door, rather than the rear door, can delay the time when passengers start to board.
Dwell time is indirectly related to stop spacing. Assuming walkable distances between stops and therefore a fixed passenger boarding demand, more stops over a given distance will spread out passenger volumes over a greater number of stops, resulting in smaller average dwell times at each stop. However, the greater number of stops will tend to slow down overall transit speeds, despite the shorter dwell times. As a result, consolidating stops can be a productive way to improve transit speeds, even though average dwell times increase, so long as dwell times at the stop with the longest dwell are not affected and walkable and accessible routes are available from a consolidated stop to the next closest stop.
Right-of-Way Characteristics In general, the more exclusive the right-of-way—that is, the less interaction that transit vehicles have with other traffic—the greater the speed and capacity that can be achieved. In the case of light rail transit, though, this general rule does not always hold. As rights-of-way become more exclusive, speeds increase. These increased speeds require increased distances between trains in order to maintain an acceptable margin of safety, with the minimum headway determined in part by the type of signaling system used. As a result, the capacity constraint on a light rail system will often not be an on-street section but rather an off-street section operating under a train signaling system. At the same time, the lowest light rail running speeds will usually be encountered on the on-street sections, while the highest speeds will be achieved on the most exclusive right-of-way sections. Different types of right-of-way will have different capacities; the section with the lowest capacity (the “critical section”) will control the overall line capacity.
Vehicle Characteristics Vehicle characteristics influence the number of people who can be carried in a given vehicle. Two vehicles with exactly the same exterior dimensions can have greatly different passenger capacities, depending on the number of seats provided and the seats’ orientation within the vehicle (i.e., longitudinal vs. transverse). A wider or longer vehicle will be able to carry more people than a narrower or shorter one. Low-floor buses generally have fewer seats than corresponding high-floor buses, because the wheelwells take up space that otherwise would have been used for seats.
Loading Diversity Passenger demand is uneven, spread out over both space and time. The temporal and spatial distribution of transit passengers often prevents transit capacity from being fully utilized for the duration of the peak period. In the temporal sense, peaks within the peak period occur at major work start and finish times and can result in brief periods of operation at capacity, followed by under-capacity operation. Shortterm fluctuations in ridership demand must be considered to avoid unacceptable passenger queuing or overcrowding. Variations in passenger arrival patterns and dwell times at stops will tend to reduce capacity. Temporal diversity is Part 1/INTRODUCTION AND CONCEPTS
Page 1-19
Chapter 3—Capacity Concepts
Transit Capacity and Quality of Service Manual—2nd Edition accommodated in capacity calculations through the use of a peak hour factor, which serves to reduce the theoretical person capacity to an achievable person capacity. Spatial diversity can be manifested in a number of ways, from boarding and alighting locations at the macro scale to the distribution of passengers within the vehicle at the micro scale. A transit line with a relatively uniform distribution of boarding passengers among stops will usually have a higher capacity than one where passenger boarding is concentrated at a single stop. Loading is often uneven between cars in a single train or between buses operating together on a single route.
Economic Constraints Transit agencies’ economic realities can constrain capacity to a level below that suggested by passenger demand.
Economic factors often constrain capacity at a level below what is technically feasible and suggested by passenger demand. Typically, this takes the form of a shortage of vehicles to supply service on a given route, resulting in passengers being left behind and crowding conditions that deter would-be riders. A survey of rail transit systems(R5) found that the passing up of waiting passengers was relatively rare except on some subway lines in New York City and Toronto, and occasionally on the SkyTrain in Vancouver. However, in the New York and Toronto cases, trains were being operated at close to the minimum headway. In these cases, the constraint was not so much economic, barring the construction of new subway lines or extending platforms, but operational. In the Vancouver case, passengers would voluntarily wait for a less crowded train, indicating that crowding conditions were at least partially avoidable. Systems in other cities indicated that their available capacity was constrained by a shortage of cars, and that this capacity shortfall discouraged new ridership due to crowded conditions.
Agency Policies Transit agency policies can influence capacity levels by dictating policy headways and vehicle loading standards. Policies are often set to ensure that scheduled service operates below capacity in order to provide a higher degree of passenger comfort. This can be manifested in the form of more frequent service or the use of larger vehicles than would be the case with lighter loading standards. Such policies can be the result of safety decisions, such as the banning of standees on buses operating on freeways, or a desire to ensure that the transit system remains attractive to new riders. The latter justification is especially important where transit is unable to provide a large travel time savings to the commuter and so must compete more directly with the automobile with respect to comfort.
MODAL CAPACITIES Exhibit 1-6 compares the maximum person capacities that typically can be achieved in the United States and Canada for a selection of modes and facility types. Ranges shown reflect different assumptions on the number of cars in trains, dwell time lengths, and so on. Rail values represent persons per hour per track. HOV lane values assume shared use with carpools. Importantly, the person capacities shown reflect the upper limit of crowding that North Americans are typically willing to accept. Higher person capacities are achieved in other parts of the world— particularly in Asia and Latin America—in part because of the higher levels of crowding that are accepted. Exhibit 1-6 also indicates the maximum passenger volumes observed in North America for various modes and facility types. These are occasionally slightly higher than the typical capacity ranges shown and reflect conditions outside the range of typical conditions used to develop the exhibit.
Chapter 3—Capacity Concepts
Page 1-20
Part 1/INTRODUCTION AND CONCEPTS
Transit Capacity and Quality of Service Manual—2nd Edition Exhibit 1-6 Person Capacity Ranges of U.S. and Canadian Transit Modes
Heavy Rail: Moving Block Signals Heavy Rail: Fixed Block Signals Light Rail: Exclusive ROW, MB Signals Light Rail: Exclusive ROW, FB Signals Light Rail: On-Street Section Commuter Rail: Owned ROW Commuter Rail: Leased ROW Streetcar Bus: Shared HOV Lane, No Stops Busway: Local/Express Busway: All Stops Bus: Dual Bus Lane, CBD Typical capacity range
Bus: Bus Lane, CBD
Highest observed in North America
Bus: Mixed Traffic, non-CBD Bus: Mixed Traffic, CBD 0
10,000
20,000
30,000
40,000
50,000
60,000
Person Capacity (peak direction passengers/hour)
SOURCES: TCQSM capacity procedures, TCRP Report 13 (R5), Transportation Planning Handbook (R2) NOTES: MB = moving block, FB = fixed block, ROW = right-of-way, HOV = high-occupancy vehicle, CBD = central business district Ranges primarily reflect differing assumptions for dwell time and number of cars per train. Peak hour factor and passenger loading assumptions reflect TCQSM recommendations. “Highest observed” values beyond the ranges shown reflect non-typical conditions. The bus-only lane on the New Jersey approach to the Lincoln Tunnel carries over 32,000 peak-hour, peak-direction passengers. However, buses make no stops en route and feed directly into the 200plus-berth Port Authority Midtown Bus Terminal.
Exhibit 1-7 compares typical travel speed and capacity ranges for various transit modes on different types of facilities. The capacity ranges reflect the same factors listed above. The travel speeds include stops; the speed ranges reflect differences in average stop spacing, dwell times, route geometry characteristics, traffic congestion, and other factors.
50
Average Travel Speed (mph)
Exhibit 1-7 Typical Travel Speed and Capacity Ranges of U.S. and Canadian Transit Modes
BUS ON HOV LANE
60
40
HEAVY RAIL COMMUTER RAIL
BUSWAY LIGHT RAIL (EXCLUSIVE ROW)
30
The product of passenger capacity and speed is known as productive
capacity. 20
PEOPLE MOVER LIGHT RAIL (ON STREET)
10
CBD BUS LANE BUS IN MIXED TRAFFIC
0 0
10,000
20,000
30,000
40,000
50,000
60,000
Person Capacity (peak direction passengers/hour)
SOURCES: TCQSM speed and capacity estimation procedures, TCRP Report 13 (R5),Transportation Planning Handbook (R2), Characteristics of Urban Transportation Systems (R1) NOTES: ROW = right-of-way Speed ranges primarily reflect differing assumptions on stop spacing and dwell time. Capacity ranges primarily reflect differing assumptions for dwell time and number of cars per train. Peak hour factor and passenger loading assumptions reflect TCQSM recommendations.
Part 1/INTRODUCTION AND CONCEPTS
Page 1-21
Chapter 3—Capacity Concepts
Transit Capacity and Quality of Service Manual—2nd Edition CHAPTER 4. REFERENCES 1.
Cambridge Systematics, Inc., The Urban Institute, Sydec, Inc., Herbert S. Levinson, Abrams-Cherwony and Associates, and Lea and Elliott, Characteristics of Urban Transportation Systems, Revised Edition, Federal Transit Administration, Washington, DC (1992).
2.
Edwards, Jr., John D. (editor), Transportation Planning Handbook, PrenticeHall Inc., Englewood Cliffs, NJ (1992).
3.
Kimpel, Thomas J., James G. Strathman, Kenneth J. Dueker, David Griffin, Richard L. Gerhart, and Kenneth Turner, “Time Point-Level Analysis of Passenger Demand and Transit Service Reliability,” Report TNW2000-03, TransNow, Seattle, WA (July 2000). http://www.transnow.org/publication/Reports/TNW2000-03.pdf
4.
Kittelson & Associates, Inc., Urbitran, Inc., LKC Consulting Services, Inc., MORPACE International, Inc., Queensland University of Technology, and Yuko Nakanishi, TCRP Report 88: A Guidebook for Developing a Transit Performance-Measurement System, TRB, Washington, DC (2003). http://gulliver.trb.org/publications/tcrp/tcrp_report_88/intro.pdf
5.
Parkinson, Tom and Ian Fisher, TCRP Report 13: Rail Transit Capacity, TRB, National Academy Press, Washington, DC (1996). http://gulliver.trb.org/publications/tcrp/tcrp_rpt_13-a.pdf
6.
Pine, Randall, James Niemeyer, and Russell Chisholm, TCRP Report 30: Transit Scheduling: Basic and Advanced Manuals, TRB, National Academy Press, Washington, DC (1998). http://gulliver.trb.org/publications/tcrp/tcrp_rpt_30-a.pdf
7.
Pratt, Richard H., TCRP Web Document 12: Traveler Response to Transportation System Changes: Interim Handbook, TRB, Washington, DC (2000). http://gulliver.trb.org/publications/tcrp/tcrp_webdoc_12.pdf
8.
Soberman, R.M. and H.A. Hazard (editors), Canadian Transit Handbook, University of Toronto and York University, Joint Program in Transportation, Toronto, Ontario (1980).
9.
Special Report 209: Highway Capacity Manual, TRB, National Research Council, Washington, DC (1985).
10. TCRP Web Document 6: Transit Capacity and Quality of Service Manual, First Edition, TRB, Washington, DC (1999). http://gulliver.trb.org/publications/tcrp/tcrp_webdoc_6-a.pdf 11. Vuchic, V.R., Urban Public Transportation: Systems and Technology, PrenticeHall, Inc., Englewood Cliffs, NJ (1981). 12. Webster, F. V. and P.H. Bly, The Demand for Public Transport, Transport and Road Research Laboratory, Crowthorne, Berkshire, England (1980).
Part 1/INTRODUCTION AND CONCEPTS
Page 1-23
Chapter 4—References