4
This chapter investigates factors that facilitate postsecondary enrollment for subpopulations of high school students. Students that find themselves at risk and those with parents who have no college experience receive primary consideration.
Transition to College: What Helps At-Risk Students and Students Whose Parents Did Not Attend College Susan P. Choy, Laura J. Horn, Anne-Marie Nuñez, Xianglei Chen More and more high school students are being advised by their parents, teachers, and counselors to go to college. In 1990, 83 percent of high school sophomores reported that their mothers had advised them to go to college, up from 65 percent of sophomores in 1980 (Wu, 1993). During this same ten-year period, the proportion of sophomores whose teachers and counselors gave this same advice about doubled, from 32 to 65 percent. Students appear to have listened. Nearly all 1992 high school graduates (97 percent) reported that they expected to continue their education at some point, and 79 percent planned to do so immediately after finishing high school (Berkner and Chavez, 1997). By 1994, two years after they had graduated, 75 percent had enrolled in some form of postsecondary education, and 45 percent had enrolled in a four-year college. Despite the high aspirations and enrollment rates of this cohort overall, students with certain characteristics had enrolled in four-year colleges by 1994 at substantially lower rates than others. This chapter focuses on two such groups: students whose family backgrounds and early education experiences had put them at risk of not even completing high school and students whose parents had not gone to college (that is, neither parent had any education beyond high school). It synthesizes the findings of several studies that describe behaviors and practices that appear to increase the college-going rates of these two groups (see Horn, 1997; Horn and Chen, 1998; Horn and Nuñez, 2000). Although these studies examine enrollment NEW DIRECTIONS FOR INSTITUTIONAL RESEARCH, no. 107, Fall 2000
© Jossey-Bass Publishers
45
46
UNDERSTANDING THE COLLEGE CHOICE OF DISADVANTAGED STUDENTS
in all types of postsecondary education, only findings related to four-year college attendance are discussed here. Thus, all references in this chapter to students’ college enrollment refer to four-year colleges only. The data for these studies were drawn from the National Educational Longitudinal Study of 1988 (NELS), which began with a survey of a nationally representative sample of 1988 eighth graders. Follow-up surveys conducted in 1990, 1992, and 1994 captured this cohort’s high school experiences and transition to college. More information on this survey (NCES, 1996a) and how to use it are provided at the end of this chapter.
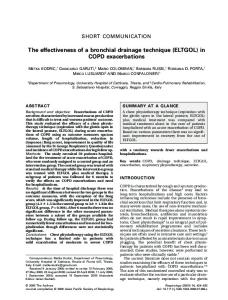
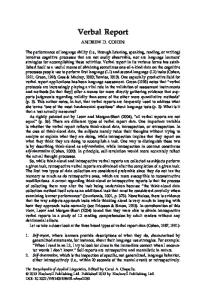
Overview of the Two Groups Based on analysis of the NELS cohort, certain characteristics have been shown empirically to put students at risk of not completing high school (Chen and Kaufman, 1997). Some of these characteristics are related to family background: being in the lowest–socioeconomic status (SES) quartile, coming from a single-parent family, and having an older sibling who dropped out of high school. Other characteristics are related to school experiences: changing schools two or more times (other than the natural progression from one level to the next), earning average grades of C or lower from sixth to eighth grades, and repeating one or more grades between first and eighth. Each of these characteristics independently increased the risk of dropping out of high school. Among the 1992 high school graduates, about one-quarter had been at moderate to high risk of not completing high school (Figure 4.1): 16 percent had been at moderate risk (two risk factors), and 9 percent had been at high risk (three or more). The same characteristics that put students at risk of not completing high school are associated with lower college-going rates. Only 35 percent of the 1992 high school graduates with any risk factors had enrolled in college by 1994, compared with 63 percent of graduates with no risk factors (Figure 4.2). Furthermore, the more risk factors they had, the less likely they were to have enrolled. Each risk factor was independently associated with a lower likelihood of going to college, but the risk factors were interrelated and cumulative in effect (Horn, 1997). Because the number of risk factors is more important than what they are, the focus here is on the number. Having parents who had not attended college is another characteristic that reduces the likelihood of going to college. If these students enroll in college, they are typically called first-generation students because they are the first generation in their immediate family to attend college. Twenty-seven percent of the 1992 high school graduates were in this category (Figure 4.1). By 1994, the college enrollment rate of the graduates whose parents had not gone to college was only 27 percent, compared with 42 percent for those whose parents had some college and 71 percent for those whose parents were college graduates (Figure 4.2). Parents’ education is defined here with reference to the highest level attained by either parent. No college means that
TRANSITION TO COLLEGE
47
Figure 4.1 Percentage Distribution of 1992 High School Graduates, According to Risk Status and Parents’ Education Risk Status Low risk (one risk factor) 32%
No risk factors 42% Moderate risk (two risk factors) 16% High risk (three risk factors) 9%
Parents’ Education Some college 42%
No college 27%
College graduate 32% Note: Percentages may not sum to totals because of rounding. Source: Horn and Chen, 1998, Figure 1, and Horn and Nuñez, 2000, Figure 1, based on data from National Center for Education Statistics, U.S. Department of Education, National Educational Longitudinal Study of 1988–1994, Data Analysis System (NCES, 1996b).
48
UNDERSTANDING THE COLLEGE CHOICE OF DISADVANTAGED STUDENTS
Figure 4.2. Percentage of 1992 High School Graduates Who Enrolled in a Four-Year College by 1994 Risk Status No risk factors Any risk factors One risk factor Two risk factors Three or more risk factors Parents’ Education No college Some college Bachelor’s or advanced degree 0
20
40 60 Percentage
80
100
Source: Horn, 1997, Table 5, and Horn and Nuñez, 2000, Table 8 based on data from National Center for Education Statistics, U.S. Department of Education, National Educational Longitudinal Study of 1988–1994, Data Analysis System (NCES, 1996b).
neither parent had any education beyond high school; some college means that at least one parent had some postsecondary education but that neither had earned a bachelor’s degree or higher; and college graduate means that at least one parent had earned a bachelor’s or advanced degree. The two groups discussed here (that is, those at risk of dropping out of high school and those whose parents did not attend college) overlap considerably. As the number of risk factors increased, so did the likelihood of having parents who had not attended college: 35 percent of students with any risk factors had parents who had not gone to college, as did 43 percent of those with two risk factors and 58 percent of those with three or more (Horn, 1997). Conversely, 80 percent of students whose parents had not gone to college had at least one risk factor: 32 percent had one, 27 percent had two, and 21 percent had three or more (NCES, 1996b). Students whose parents had no college experience averaged 2.0 risk factors, compared with 1.6 for those whose parents had some college and 1.3 for those whose parents were college graduates. In terms of their college enrollment rates, stu-
TRANSITION TO COLLEGE
49
dents whose parents had not gone to college most closely resembled those with two risk factors (the rate was 27 percent in both cases).
When They Leave the Pipeline to College Practically speaking, the pipeline to college has five sequential steps. To make it through, students must (1) aspire to a bachelor’s degree early enough to take the necessary preparatory steps (considered here to be during tenth grade), (2) prepare academically to a minimal level of qualification,1 (3) take admission examinations (SAT or ACT), (4) apply to a four-year college, and (5) gain acceptance and enroll. About 40 percent of 1992 high school graduates made it through the pipeline successfully and enrolled in a four-year college (Table 4.1). Another 5 percent enrolled in a four-year college but did not have a bachelor’s degree goal while in tenth grade, indicating that they changed their minds after they reported their aspirations in tenth grade (Horn, 1997). This 5 percent is not included in the analysis of progress through the pipeline. Table 4.1 shows the percentages of students who successfully completed each step. The decline in the percentage of students as they progressed through the pipeline indicates how many students were lost at each step. The largest loss of students was at the first step, entering the pipeline by aspiring to a bachelor’s degree while in tenth grade. Forty-four percent of high school graduates with any risk factors never entered the pipeline to college. Fiftysix percent of these graduates did enter, compared with 81 percent of those with no risk factors. The next largest loss occurred because students were not prepared academically: the proportion of students with any risk factors who both aspired to a bachelor’s degree and were prepared academically was 44 percent (meaning that 12 percent more dropped out of the pipeline at this step), compared with 75 percent for those with no risk factors. Additional, although smaller, losses from the pipeline occurred because some of the remaining students did not take the admission examinations, gain acceptance to a four-year institution, or enroll despite aspiring to a bachelor’s degree and being academically qualified for admission (about 4 to 5 percent more dropped out at each step). By 1994, 30 percent of the graduates with any risk factors had enrolled in college, which is barely half of those who had aspired to a bachelor’s degree when they were in tenth grade. In comparison, 58 percent of those with no risk factors had enrolled, which is almost three-quarters of those who had aspired to a bachelor’s degree. At each step, students were less likely to stay in the pipeline as the number of risk factors increased. The percentage of students who stayed in the pipeline to the end and did enroll declined from 39 percent of those with only one risk factor to 21 percent of those with two risk factors and to 10 percent of those with three or more risk factors. Students whose parents had not gone to college appeared to be as successful as students who had two risk factors (moderate risk) in progressing
81 56 64 49 39 46 64 86
Risk status No risk factors Any risk factors Low risk (one risk factor) Moderate risk (two risk factors) High risk (three or more risk factors)
Parents’ education No college Some college College graduate 33 53 79
75 44 54 36 23
56
29 49 78
73 40 51 31 19
52
Took SAT or ACT
Step 3
25 42 73
66 35 45 26 16
47
Applied to Four-Year Institution
Step 4
21 35 65
58 30 39 21 10
40
Enrolled in Four-Year Institution by 1994a
Step 5
Note: To be included in the second through fifth columns, students must have been included in all previous columns. aPercentages differ from Figure 4.1 because the students who did not have a bachelor’s degree goal in the tenth grade(that is, did not complete Step 1) are not included (5 percent). Source: Horn, 1997, Table 6, and National Center for Education Statistics, U.S. Department of Education, National Educational Longitudinal Study of 1988–1994 Data Analysis System (NCES, 1996b).
66
At Least Minimally Prepared Academically
Tenth-Grade Bachelor’s Degree Aspirations
Total
Step 2
Step 1
Table 4.1. Percentage of 1992 High School Graduates Who Progressed Through Each Step to Enrollment in a Four-Year College by 1994
TRANSITION TO COLLEGE
51
through each step (as indicated above, they had an average of two risk factors). They were much less likely than their peers with more educated parents to complete any of the steps. Compared with those students whose parents were college graduates, they were only about half as likely to aspire to a bachelor’s degree when they were in tenth grade (46 percent versus 86 percent) and only about one-third as likely to enroll in a four-year college (21 percent versus 65 percent). Because the greatest numbers of students leave the pipeline owing to their failure to complete the first two steps, this analysis suggests that efforts to increase college access might have the largest payoff when targeted toward encouraging students to aspire to a college degree and helping them prepare academically. However, because some students who are both motivated and prepared nevertheless leave the pipeline at later stages, assisting them with the application process, picking an appropriate college, and assembling the necessary financial resources would also help boost enrollment rates and would probably be much easier and less costly to accomplish.
What Makes a Difference Our analyses of the NELS data suggest that parents, peers, and school personnel can all contribute to increasing the college enrollment rates of students at risk of dropping out of high school and of students whose parents had no college experience. Although reaching similar general conclusions, the analyses of the two groups have slightly different perspectives and therefore can inform us in different ways. The analysis of at-risk students sought to explain why some students identified as being at risk of school failure manage to succeed in school and enroll in college despite their social and educational disadvantages. The analysis focused on a specific subset of 1992 high school graduates—those at moderate to high risk of not completing high school—and examined how the experiences of those who made it to college differed from those who did not. This type of comparison of at-risk graduates can provide important insights into what could be done to increase the success rate of those who did not enroll. The analysis of students whose parents did not go to college included all the 1992 high school graduates. It compared the mathematics curricula and college preparation activities of students whose parents did not go to college with those of their counterparts whose parents had more education. Understanding the differences can help educators and policymakers identify effective ways to improve college access for students who may be at a disadvantage because their parents have no firsthand college experience. Because students’ academic achievement and performance tend to vary with their parents’ education, the analysis controlled for academic ability while examining the effects of parents’ education.
52
UNDERSTANDING THE COLLEGE CHOICE OF DISADVANTAGED STUDENTS
Graduates Who Had Been at Moderate to High Risk of Dropping Out of High School Even though graduates who had been at moderate to high risk of dropping out of high school enrolled in college at a lower rate than their peers who had not been at risk, 27 percent of 1992 high school graduates at moderate risk (two risk factors) and 14 percent at high risk (three or more risk factors) managed to enroll (Figure 4.2). To understand better the experiences of the students who were successful, compared with those who were not, we investigated how certain engagement behaviors of students, their parents, and their peers and participation in college preparation activities affect the likelihood of enrolling in a four-year college. Many of the variables had a significant positive effect on enrollment. These engagement indicators, originally found to be important for keeping students from dropping out of high school, were also important for increasing the chances of at-risk graduates who made it through high school going to college. Before introducing the results, we describe the variables used and the method of analysis. Student Engagement with School. The level of school attendance and the number of extracurricular activities in which graduates had participated were used as indicators of their engagement in school. The attendance variable was an index based on a factor analysis of several items, including how many times they had been late for school, skipped school, or been absent. Students were characterized as having low, moderate, or high attendance, with the twenty-fifth and seventy-fifth percentiles being the cutoffs for low and high attendance, respectively. Extracurricular activities that were tallied included sports, band, theater, student government, academic societies, yearbook, service clubs, and hobby clubs. Parent Engagement with Student Learning. Parent engagement indicators included their educational expectations for their child and how involved they were with their child’s schooling. The involvement indicator was based on a factor analysis that incorporated how frequently parents discussed certain matters with their child: selecting high school courses, school activities of particular interest to their child, topics the child had studied in class, plans for taking college entrance exams, and applying to colleges. Parents were characterized as having little or no, some, or much discussion with their children (with the twenty-fifth and seventy-fifth percentiles being the cutoffs for little or no and much, respectively). Peer Engagement with Learning. The analysis included two measures of peer engagement with learning: the degree of importance that students believed their friends attributed to learning activities and how many of the students’ friends planned to attend a four-year college. The learning activities indicator was based on a factor analysis of how important they thought their friends considered certain activities: attending classes, getting good grades, finishing high school, and continuing their education past high school. The friends’ engagement with learning was categorized as not very,
TRANSITION TO COLLEGE
53
moderately, or highly important (with the twenty-fifth and seventy-fifth percentiles being the cutoffs for not very and highly, respectively). College Preparation Activities. Students reported whether they had participated in certain college preparation activities, including gathering information about financial aid, participating in outreach programs such as Upward Bound or Talent Search, making special efforts to prepare for college entrance examinations (including use of classes, tutoring, books, or computer programs), and receiving help from teachers or other school personnel in preparing college and financial aid applications. Enrolling in a Four-Year College. Enrolling in a four-year college was the outcome variable used for the analysis of the effects of the engagement and preparation variables. Because the outcome measure was dichotomous (enrolling or not enrolling), a logistic regression was used.2 Owing to their relationship to enrollment, the six risk factors and student achievement were controlled for. Two student achievement measures were included: the cumulative score from a battery of tests in mathematics, reading, science, and social science administered in eighth grade and the highest level of mathematics taken in high school. (Eight levels were constructed, ranging from a low of no mathematics to a high of completing calculus.) Some of the engagement and participation variables may be interrelated. For example, when parents have high expectations, students may be more engaged in school. Therefore, the four sets of variables were entered into the logistic regressions hierarchically, starting with parent engagement and then adding, in turn, student engagement, peer engagement, and college preparation activities. This made it possible to see how the effect of one set of engagement variables changed as the next was introduced. The logistic regression results are presented in terms of odds ratios (Table 4.2). For graduates who had been at moderate or high risk of not completing high school, these ratios describe the relative odds of their enrolling in a four-year college when they had a particular characteristic (such as having parents who frequently discussed school-related matters with them) compared with a reference group (such as those who had infrequent discussions with their parents). Because the odds ratios were computed after controlling for risk factors, student achievement, and the other variables in the table, they represent the independent effects of each variable shown. Results. Peer group effects were especially strong. In fact, having friends with college plans was the strongest predictor of college enrollment. If most or all of their friends had college plans, the odds of moderate- to high-risk students enrolling in college were four times higher than if none of their friends planned to go to college. Parental involvement was also important in predicting enrollment. The odds of enrolling in college were almost twice as great for students whose parents frequently discussed school-related matters with them as for those whose parents had little or no discussion with them. Parents’ educational expectations
54
UNDERSTANDING THE COLLEGE CHOICE OF DISADVANTAGED STUDENTS
Table 4.2. Four-Step Logistic Regression for Probability of Moderateto High-Risk Students Attending a Four-Year College Predicted by Parent Engagement, Student Engagement, Friends’ Engagement with Learning, and College Preparation Activities (N = 2,878) Odds Ratio for At-Risk Students Attending Four-Year College Versus Other
Predicted Variablea Parent engagement with student’s learning Parents discussed school-related matters with student Missing Some discussion Much discussion Little to no discussion (comparison group) Parents’ educational expectations for student Missing Vocational or trade Some college Bachelor’s degree Advanced degree High school diploma or less (comparison group) Student engagement with school Student’s class attendance Missing Moderate attendance High attendance Low attendance (comparison group) Extracurricular activities student participated in Missing One Two None (comparison group) Friends’ engagement with learning Importance of learning to student’s friends Missing Moderately important Highly important Not very important (comparison group) Number of friends who planned to attend a four-year college Missing Few to some Most to all None (comparison group)
Step 1
Step 2
Step 3
Step 4
0.93 1.51 2.16b
0.93 1.41 2.11b
0.87 1.36 1.97b
0.87 1.31 1.84c
1.54 0.78 1.50 2.30 1.93
1.44 0.71 1.41 2.12 1.77
1.23 0.78 1.27 1.82 1.46
1.35 0.80 1.22 1.70 1.30
1.03 1.28 1.49
0.85 1.16 1.38
0.82 1.05 1.25
1.68 1.22 1.86b
1.52 1.04 1.51
1.26 1.07 1.40
1.92 1.19 1.19
1.64 1.15 1.15
2.78 1.79 4.91b
3.31b 1.50 4.00b
TRANSITION TO COLLEGE
55
Table 4.2 (continued) Odds Ratio for At-Risk Students Attending Four-Year College Versus Other
Predicted Variablea College preparation activities Amount of aid information used by student Missing One Two or more None (comparison group) Number of people student talked to about aid Missing One Two Three Four or more None (comparison group) Participated in any high school outreach program Yes No (comparison group) Student got help preparing for entrance exam Missing Yes No (comparison group) Student received help from school with college application process Missing Yes No (comparison group)
Step 1
Step 2
Step 3
Step 4
0.71 1.01 1.27
0.78 1.45 1.41 1.36 1.18
1.97c
0.68 1.82b
2.66 1.39c
Note: Results in this table were estimated by the SUDAAN software, using the weight F3QWT92G. The �2 values for each respective step are 710.95, 735.55, 823.03, and 896.56. All are significant at p ≤ .01. aEach
logistic regression controlled for six risk factors—SES, number of times of changing school, grade point average from grades 6 to 8, single-parent family, ever held back, having one or more siblings who dropped out of school, and two achievement measures including the eighth-grade combined math, reading, science, and social studies test scores and level of mathematics courses taken over the four years of high school. bp ≤. 01. cp ≤. 05. Source: Horn and Chen, 1998, Table 7, based on data from National Center for Education Statistics, U.S. Department of Education, National Educational Longitudinal Study of 1988–1994 Data Analysis System (NCES, 1996b).
56
UNDERSTANDING THE COLLEGE CHOICE OF DISADVANTAGED STUDENTS
did not appear to affect the odds of enrolling. One possible explanation may be that parents’ expectations for their children are generally high, especially when their children are academically prepared for college (Horn, 1997). Consequently, expectations may vary little after controlling for students’ achievement level. College preparation activities were also related to enrollment. The odds of students who participated in any high school outreach program enrolling were about twice the odds of students who did not participate. Getting help from teachers or other school staff in applying for college also made a difference. Students who reported getting help in filling out their college applications or preparing for entrance examinations had higher odds of enrolling in college than students who reported receiving no assistance. Student participation in two or more extracurricular activities first appeared to increase the odds of enrolling in college, but when the peer engagement variables were added, the effect disappeared. The fact that colleges typically expect or encourage high school participation in extracurricular activities suggests that participation may be correlated with having friends with college plans. Student attendance was not a factor, perhaps because it is likely to be highly correlated with student achievement and parents’ involvement, which were already controlled for.
Graduates Whose Parents Had No College Experience Participating in a rigorous mathematics curriculum significantly increases the likelihood of attending college, and parents’ education is strongly connected to participating in such a curriculum. High school graduates whose parents had no college experience were less likely than their peers whose parents had graduated from college to participate in a mathematics curriculum leading to college enrollment. They were also less likely to have access to and be encouraged to follow such a curriculum and less likely to work with their parents in planning for college. This was true even for students who were the best prepared academically, where one would expect parents’ education to make the least difference. Mathematics Curriculum and College Enrollment. Taking algebra in eighth grade was strongly associated with taking advanced mathematics in high school, which, in turn, was strongly associated with a higher likelihood of attending college. Taking advanced mathematics means taking at least one course beyond Algebra 2, such as Algebra 3, Trigonometry, Precalculus, Calculus, Probability, or Statistics. Overall, 22 percent of the 1992 high school graduates took algebra in eighth grade, and 39 percent took advanced mathematics in high school; however, 78 percent of those who took algebra in eighth grade later took advanced mathematics in high school (Horn and Nuñez, 2000). Among those who took advanced mathematics in high school, about three-quarters (76 percent) enrolled in college by 1994 (Table 4.3). The enrollment rate dropped to 44 percent for those who took middle-level mathematics (Algebra 2), to 16 percent for those who took
57
TRANSITION TO COLLEGE
Table 4.3. Percentage of 1992 High School Graduates Who Enrolled in a Four-Year College by 1994, by Parents’ Education and Mathematics Level That Student Completed Parents’ Education
Total Mathematics course level completed No mathematics, low or nonacademic Middle academic I (Algebra 1 and Geometry) Middle academic II (Algebra 2) Advanced academic (Beyond Algebra 2)a
Total
No College
Some College
College Graduate
46
27
42
71
6
4
7
13
16 44 76
11 34 64
15 41 70
29 63 85
aCompleted
at least one class beyond Algebra 2 labeled “advanced” including Precalculus, Calculus, Trigonometry, Probability, Statistics, Algebra 3, and so on. Source: Horn and Nuñez, 2000, Table 8, based on data from National Center for Education Statistics, U.S. Department of Education, National Educational Longitudinal Study of 1988–1994 Data Analysis System (NCES, 1996b).
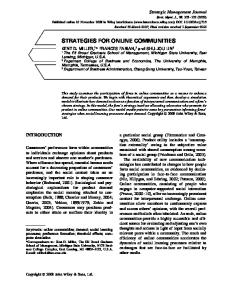
only algebra and geometry, and to 6 percent for those whose completion level was lower than algebra and geometry. These findings indicate that taking advanced mathematics courses in high school is an important intermediate step to college enrollment and that taking algebra in eighth grade is a critical first step. Despite the strong association between mathematics course-taking and college attendance, parents’ education still mattered. Considering only students who were at the highest level of mathematics proficiency in eighth grade according to tests administered as part of NELS, students whose parents had not attended college were less likely than their peers whose parents had graduated to take algebra in eighth grade and were less likely to take any advanced mathematics in high school even if they took algebra in eighth grade (Figure 4.3). Furthermore, they were less likely to enroll in college even if they took advanced mathematics. Among students who took advanced mathematics in high school, 85 percent of those whose parents were college graduates went to college by 1994, but only 64 percent of those whose parents had no college experience did so (Table 4.3). Although the advantage of taking algebra in eighth grade is clear, not all schools offer it as an option, and students whose parents did not go to college were especially likely to attend such schools. Among the students with the highest level of mathematics proficiency in eighth grade, 20 percent of the students whose parents had not attended college reported that algebra was not offered in their school, compared with 10 percent of those whose parents were college graduates (Horn and Nuñez, 2000).
58
UNDERSTANDING THE COLLEGE CHOICE OF DISADVANTAGED STUDENTS
Figure 4.3. Percentage of 1992 High School Graduates with the Highest Level of Mathematics Proficiency in Eighth Grade Who Took Alegebra in Eighth Grade and Advanced Mathematics in High School Percent 100 80 60
No college Some college College graduate
40 20 0 Algebra in eighth grade
Advanced Advanced math mathematics in high school in high school if took algebra in eighth grade
Source: Horn and Nuñez, 2000, Tables 4–6, based on data from National Center for Education Statistics, U.S. Department of Education, National Educational Longitudinal Study of 1988–1994, Data Analysis System (NCES, 1996b).
On the positive side, among students whose parents had no college experience, their mathematics curriculum significantly affected their likelihood of going to college. The more rigorous the curriculum, the more likely they were to enroll in college. For example, 64 percent of those who took advanced mathematics went to college, almost double the rate of those who stopped at Algebra 2 (34 percent) (Table 4.3). Multivariate analysis indicated that regardless of parents’ education, income, academic achievement, and other related factors, students who took algebra in eighth grade improved their chances of completing advanced mathematics courses in high school. In addition, students who took such courses in high school, regardless of their level of qualification for four-year college and parents’ education, income, and other factors, significantly increased their chances of enrolling in a four-year college (Horn and Nuñez, 2000). This suggests that one important way to increase the college enrollment rate of students whose parents have no college experience would be to encourage them to begin a rigorous mathematics sequence, starting with algebra in eighth grade. Curricular Choices. To help understand why students whose parents have less education are less likely to enroll in higher-level mathematics and, later, in college, we examined how different school and family agents were involved in guiding students in selecting courses. Considering only those with the highest level of mathematics proficiency in eighth grade (thus controlling for students’ ability), students whose parents did not go to college were less likely than those whose parents were college graduates to have
TRANSITION TO COLLEGE
59
their parents encourage them to take algebra (52 percent versus 70 percent) and more likely to choose their high school program alone (31 percent versus 22 percent) (Table 4.4). Similarly, if students took mathematics in their senior year and took Algebra 2 or higher, their parents were less likely to be involved in their choosing a mathematics course if they had not gone to college than if they had graduated (56 percent versus 74 percent). One might expect teachers and counselors to play a more important role if the parents were not involved, but that did not seem to be the case. Similar percentages of students were advised by teachers and counselors regardless of parents’ education (ranging from 55 to 62 percent). Planning For and Applying to College. Along with being less likely to participate in a rigorous mathematics curriculum, students whose parents did not attend college were also less likely than their peers with more educated parents to participate in planning activities that lead to college enrollment, even when the students were college qualified, as defined earlier. For example, Table 4.5 shows that college-qualified students whose parents had no college experience were less likely than those whose parents had graduated from college to report that they often discussed SAT or ACT preparation (7 versus 15 percent in tenth grade and 16 versus 27 percent in twelfth grade) or postsecondary plans with their parents (41 versus 49 percent in tenth grade and 42 versus 61 percent in twelfth grade). In addition, the likelihood of college-qualified students’ parents participating in the following activities increased with the parents’ education: attending a program on educational opportunities for their children, attending a program about student financial aid, accompanying their child on a school visit to decide about application or enrollment, or seeking financial aid information. Although one might expect schools to substitute for parents in some of these planning activities, this was generally not the case. There was no significant relationship between parents’ education and whether collegequalified students received help from their school with various tasks associated with applying for college. Overall, 52 percent received help filling out college applications, 33 percent received help preparing an admission essay, and 46 percent received help arranging days off to visit colleges (Horn and Nuñez, 2000). College-qualified students whose parents had not attended college or had only some college were more likely than those whose parents were college graduates to report that they had received help with a financial aid application for college (51 and 47 percent versus 34 percent), but they were probably also more likely to be applying for aid.
Implications of the Findings Students with risk factors associated with dropping out of high school and students whose parents did not attend college are less likely than other classmates to enter the college pipeline and more likely to leave the pipeline at each step along the way. Therefore, efforts to help students develop
60
UNDERSTANDING THE COLLEGE CHOICE OF DISADVANTAGED STUDENTS
Table 4.4. Percentage of Academically Well-Prepared 1992 High School Graduates with Access to Various Sources of Help Algebra in Eighth Gradea
High School Programa
Parents Chose Encouraged with Student to Take Parents
Chose Alone
Senior-Year Mathematics Courseb
Parents Counselor Teacher Helped Helped Helped Choose Choose Choose
Total
64
49
25
67
56
61
Parents’ education No college Some college College graduate
52 59 70
41 48 52
31 28 22
56 66 74
61 55 55
57 60 62
aIncludes
only students with the highest level of mathematics proficiency in eighth grade. only students who took Algebra 2 or higher in their senior year. Source: Horn and Nuñez, 2000, Tables 10, 12, 13, based on data from National Center for Education Statistics, U.S. Department of Education, National Educational Longitudinal Study of 1988–1994 Data Analysis System (NCES, 1996b).
bIncludes
college aspirations early, encourage them to follow a rigorous academic curriculum, and support them through the application and enrollment process all have the potential to keep students in the pipeline and improve college enrollment rates. The largest payoffs will come from helping students to enter the pipeline and persist through the second step (preparing academically) because of the large numbers who leave then. For moderate- to high-risk students, parental involvement was convincingly linked to an increased likelihood of attending college. The odds of enrolling in college were almost twice as great for students whose parents frequently discussed school-related matters with them compared with those of students whose parents rarely did so. Peer influence was a strong factor for these students as well. If most or all of their friends planned to go to college, they were much more likely to enroll themselves. The analysis of the relationship between mathematics course-taking and college enrollment demonstrated the increased enrollment rates associated with following a rigorous mathematics curriculum, regardless of any other background characteristics, including parents’ education. Preferably, such a curriculum would begin with algebra in eighth grade but definitely would include advanced mathematics courses in high school. The findings of the analyses reported here suggest many actions that schools can take to help students in the two groups studied to increase their likelihood of attending college. For example, schools can provide algebra in eighth grade and high-level advanced mathematics in high school and encourage students (especially those with high ability) to take those courses. They can institute outreach programs, targeting promising students
Postsecondary Plans
7 9 15
Parents’ education No college Some college College graduate
16 20 27
22 41 41 49
45 42 47 61
51 29 39 51
42
39 46 48
46
61 71 82
74
Parents Visited College
72 83 83
81
Parents Sought Financial Aid Information
Source: Horn and Nuñez, 2000, Tables 14–17, based on data from National Center for Education Statistics, U.S. Department of Education, National Educational Longitudinal Study of 1988–1994 Data Analysis System (NCES, 1996b).
10
Total
Student Financial Aid
Parents Attended Programs on
Educational Tenth Grade Twelfth Grade Tenth Grade Twelfth Grade Opportunities
SAT or ACT Preparation
Students and Parents Discussed Often
Table 4.5. Percentage of College-Qualified 1992 High School Graduates Who Planned for College with Their Parents
62
UNDERSTANDING THE COLLEGE CHOICE OF DISADVANTAGED STUDENTS
whose friends may not be college bound or whose parents did not attend college or are less involved in their children’s education. Schools can also help students prepare for SAT and ACT tests and help them complete their applications for admission and financial aid, focusing on students who may not get such help from their parents. This is particularly important when students’ parents did not attend college and therefore may be unfamiliar with the requirements. For students whose parents did not go to college, teachers and counselors can assist them in two ways. First, they can act as proxies for parents by helping students choose an appropriate curriculum and guiding them through the college application process, and second, they can help encourage parents to participate in their children’s schooling and learn the important steps necessary so they can help their children with college-related matters. Notes 1. The determination of academic qualification was based on the index developed by Berkner and Chavez (1997). This index is a composite measure based on high school rank in class, ACT and SAT scores, high school grades, and the 1992 NELS mathematics and reading test composites. Students were considered minimally prepared for a fouryear college as long as they met at least one of the following criteria: ranked at the fifty-fourth percentile or higher in their graduating class; earned a grade point average of 2.7 or higher in academic courses; achieved a combined SAT score of at least 820 or an ACT score of at least 19; or scored at the fifty-sixth percentile or higher on the NELS test. 2. SUDAAN was used to perform the analyses. For a detailed description of this software, see Shah, Barnwell, Hunt, and LaVange (1995).
References Berkner, L., and Chavez, L. Access to Postsecondary Education for the 1992 High School Graduates. Washington, D.C.: National Center for Education Statistics, U.S. Department of Education, U.S. Government Printing Office, 1997. (NCES 98–105) Chen, X., and Kaufman, P. “Risk and Resilience: The Effects of Dropping Out of High School.” Paper presented at the annual meeting of the American Educational Research Association, Chicago, Illinois, April 1997. Horn, L. Confronting the Odds: Students At Risk and the Pipeline to Higher Education. Washington, D.C.: National Center for Education Statistics, U.S. Department of Education, U.S. Government Printing Office, 1997. (NCES 98–094) Horn, L., and Chen, X. Toward Resiliency: At-Risk Students Who Make It to College. Washington, D.C.: Office of Educational Research and Improvement, U.S. Department of Education, 1998. Horn, L., and Nuñez, A. Mapping the Road to College: First-Generation Students’ Math Track, Planning Strategies, and Context of Support. Washington, D.C.: , National Center for Education Statistics, U.S. Department of Education, U.S. Government Printing Office, 2000. (NCES 2000–153) National Center for Education Statistics (NCES). National Educational Longitudinal Study of 1988. Restricted file. Washington, D.C.: National Center for Education Statistics, U.S. Department of Education, 1996a. (NCES 96–130)
TRANSITION TO COLLEGE
63
National Center for Education Statistics (NCES). National Educational Longitudinal Study of 1988, Data Analysis System. Washington D.C.: Office of Educational Research and Improvement, U.S. Department of Education, 1996b. (NCES 96–127) Shah, B., Barnwell, B., Hunt, P., and LaVange, L. SUDAAN Users Manual. Raleigh, N.C.: Research Triangle Institute, 1995. Wu, S. America’s High School Sophomores: A Ten Year Comparison, 1980–1990. Washington, D.C.: National Center for Education Statistics, U.S. Department of Education, U.S. Government Printing Office, 1993. (NCES 93–087)
SUSAN P. CHOY, LAURA J. HORN, ANNE-MARIE NUÑEZ, and XIANGLEI CHEN are researchers with MPR Associates, Inc.