EGYPT HEALTH COMMUNICATION SURVEY
2006
El-Zanaty& Associates
CHL Programs
Tulane University
EGYPT HEALTH COMMUNICATION SURVEY 2006
Fatma El-Zanaty Noha EL-Ghazaly Dominique Meekers
TABLE OF CONTENTS 1
INTRODUCTION.......................................................................................................1 1.1 1.2 1.3 1.4 1.5
2
SOCIO-ECONOMIC CHARACTERISTICS OF HOUSEHOLDS AND RESPONDENTS ........6 2.1 2.2 2.3 2.4 2.5
3
Modes of Transmission .......................................................................................15 Symptoms of Avian Flu Virus .............................................................................15 Ways of Protection from Avian Flu Virus............................................................16 Attitudes Toward Avian Flu ................................................................................ 16
PRACTICES AND BEHAVIOR CHANGE RELATED TO BIRDS ...................................17 5.1 5.2 5.3 5.4
6
Exposure to TV Spots about Avian Flu................................................................12 Exposure to TV Programs about Avian Flu..........................................................13 Exposure to Printed Media about Avian Flu.........................................................13 Exposure to Seminars/Community meetings about Avian Flu ..............................14
KNOWLEDGE AND ATTITUDES OF AVIAN FLU VIRUS ...........................................15 4.1 4.2 4.3 4.4
5
Household Composition ........................................................................................6 Education of the Household Population .................................................................7 Household Environment ........................................................................................8 General Characteristics of Respondents .................................................................9 Television Watching Habits.................................................................................11
EXPOSURE TO MESSAGES ABOUT AVIAN FLU ......................................................12 3.1 3.2 3.3 3.4
4
Background...........................................................................................................1 Goals and Objectives ............................................................................................1 Organization of the 2005 Egypt Health Communication Survey.............................2 Implementation of the 2005 Egypt Health Communication Survey ........................2 Coverage of the Survey ........................................................................................5
Bird keeping at home ..........................................................................................17 Behavior Changes ............................................................................................... 17 Behavior Changes among respondents who have birds at home………………… 18 Reporting the Infected Cases .............................................................................. 18
EXPOSURE TO MESSAGES ABOUT SAFE PRACTICES .............................................19 6.1 6.2 6.3 6.4 6.5 6.6 6.7 6.8 6.9
Exposure to Messages about Hand Washing ........................................................19 Exposure to Messages about Safe Injection..........................................................19 Exposure to Messages about Second Hand Smoking............................................ 20 Exposure to Messages about Antenatal Care........................................................20 Exposure to Messages about Postnatal Care.........................................................21 Exposure to Messages about Family Planning .....................................................21 Exposure to Messages about HIV/AIDS ..............................................................21 Exposure to Health Campaigns............................................................................ 22 Safe Practices Changes........................................................................................23
APPENDIX A DETAILED TABLES....................................................................................25 Chapter 2 ...........................................................................................................25 Chapter 3 ...........................................................................................................33 Chapter 4 ...........................................................................................................45 Chapter 5 ...........................................................................................................57 Chapter 6 ...........................................................................................................68
APPENDIX B QUESTIONNAIRES .....................................................................................91 Household Questionnaire ...................................................................................91 Individual Questionnaire ....................................................................................98 Alam Simsim Module ...................................................................................... 114 Caretaker Questionnaire ............................................................................ 114 Child Questionnaire................................................................................... 122
APPENDIX C SURVEY STAFF........................................................................................129 Technical and Administrative Staff .................................................................. 129 Filed Staff ........................................................................................................ 130
INTRODUCTION
1
1.1 Background While existing large-scale nationally representative surveys, such as the 2005 Egypt Demographic and Health Survey, are an excellent source of information for data on knowledge, attitudes, and health behaviors, they typically include very limited information about population exposure to health communication activities. The 2005 EHCS remedies this by asking respondents very detailed questions about exposure to health communication activities, and a more limited set of questions about health knowledge, attitudes, and behaviors. To ensure comparability with the 2005 EDHS data, the sampling frame of the 2005 and 2006 EHCS is based on the one used for the DHS. The Communication for Healthy Living project is based on the philosophy that households are the producers of health and thus aims at integrating health care services and focusing on systems. The USAID-funded Health Communication Partnership is working with the CHL project to build capacity for health communication in the public, NGO, and private sectors in Egypt. The project involves such innovative activities as a “Newlyweds Initiative”, including a group wedding celebration to focus on young married couples taking responsibility for their own health. The CHL program has a national television variety show which features newlywed couples, and over 100 television and radio programs featuring messages on health, overpopulation, and in support of gender equity. To date, CHL has reached close to 1,129 outreach workers and health care providers through specialized training, seminars, and public events in its three project governorates (Fayoum, Menya, Qena) and it has proved a successful way to engage many audiences in selected focal villages in those governorates. Since December 2005, highly pathogenic H5N1 avian influenza viruses have swept through poultry populations across Asia and parts of Europe. The outbreaks are historically unprecedented in scale and geographical spread. Their economic impact on the agricultural sector of the affected countries has been large. From December 2003 to mid-July 2005, outbreaks of avian influenza A (H5N1) in poultry occurred in nine countries (Cambodia, China, Indonesia, Japan, the Republic of Korea, the Lao People’s Democratic Republic, Malaysia, Thailand and Viet Nam). Since late July 2005, outbreaks in domestic poultry as well as wild birds have been reported in the Russian Federation, Kazakhstan, Romania, Mongolia, Turkey and Croatia. In addition, during this period outbreaks in poultry have increased again in Indonesia, Thailand, Viet Nam and China. On February 17, 2006, the Government of Egypt has announced finding cases of H5N1 in domestic poultry. Responding to the Government of Egypt request, CHL has produced 3 TV spots on bird flue to increase knowledge about mode of transmission, safe practices, symptoms of the disease, and to increase reporting of suspected infected cases. The Egyptian State Information Service/IEC Center requested technical assistance from the John Hopkins University Media/Materials Clearinghouse to help them set up the infrastructure and systems to establish and manage an efficient Arabic/English Resource Center. Thus, both the SIS/IEC center and CHL program needed to evaluate their communication interventions. In this regard, the Egypt Health Communication Survey 2005 (EHCS) was designed to provide information about the reach of the communication interventions of avian flu and other health issues and their effect on behavior change.
1.2 Goals and Objectives The goal of research and monitoring efforts is to assess the reach and impact of the CHL program activities on the family members’ values, attitudes, intentions, and health competency; to encourage life-stage appropriate health behaviors, and to increase demand for and utilization of
1
health information and services. The 2006 EHCS was designed to provide estimates for key indicators mainly exposure to different messages designed and produced by CHL as well as the effect of the communication interventions on behavior change. The survey results are intended to assist the technical staff at the CHL project and the SIS/IEC Center to design new communication strategies and activities for improving the health status of Egyptians. The specific objective of this survey is to assess to what extent the IEC campaign on bird flue succeeded in reaching the public in Egypt and in increasing knowledge of modes of transmission, and safe practices. The specific objectives are to: • • • •
Assess the level of exposure to the campaign among different groups in Egypt. Assess the level of knowledge of modes of transmission among different groups in Egypt. Assess the knowledge of safe practices and reporting among different groups in Egypt. Assess the exposure to messages about safe practices among different groups in Egypt
In addition, a separate module questionnaire was utilized to Sesame Workshop campaign on Avian Flu. The primarily goal of this module is to investigate health hygiene practices and awareness about Avian Flu among children. The results of this part of the survey will be presented in a separate report.
1.3
Organization of the 2005 Egypt Health Communication Survey
The 2006 Egypt Health Communication Survey was a national survey conducted in the whole country under the auspices of the State Information Service/IEC Center. The survey was funded by the United States Agency for International Development (USAID), as part of the external evaluation of the impact of the Health Communication Partnership (HCP). Tulane University’s Department for International Health and Development (Tulane/IHD), School of Public Health and Tropical Medicine, has been selected as the external evaluator for the HCP program. To assess the reach and impact of the various initiatives of the CHL program, as well as other programs, on national level the 2006 Egypt Health Communication Survey was implemented by El-Zanaty & Associates, with limited technical assistance from Tulane/IHD.
1.4
Implementation of the 2005 Egypt Health Communication Survey
The 2006 EHCS was executed in four stages. The first stage involved preparatory activities, including the design of the sample, as well as development of the survey questionnaires and related instruments. The preparatory stage was initiated in April 2006, and all of the activities were completed by early May 2006. The second stage took place from 10th of May 2006 for three weeks, and involved training of field staff and interviewing of eligible households and individual respondents. The third stage involved all of the data processing activities necessary to produce a clean data file, including the data entry, verification of the data, editing, and coding, as well as consistency checking and tabulations. This stage started soon after the beginning of the fieldwork and lasted till the end of June 2006. The focus of the final stage of the survey was data analysis and report preparation. This phase began in July 2006 and took about 2 months.
Sample design As previously mentioned, this survey is a national survey that was implemented in 21 governorates. The survey collected data from ever-married women in the age group 15-49 years, husbands of eligible women and never-married male and female youth aged 15-24 years. To permit estimation of the main indicators at the national level, a systematic random self-weighed sample was selected from each governorate (i.e., a total of about 1,530 households). Based on household composition data from the EDHS and the EHCS 2005, it was expected that this process would yield around 4200 interviews with around 1300 women, 1200 husbands, and about 1500 youth.
2
Sample selection The sample of the study was a multistage random sample consisting of the following stages:
First Stage: Prior to EHCS 2005 a discussions with the technical staff of Tulane/IHD and the CHL project took place and it was agreed that 21 governorates were selected in this stage with probability proportional to size. Then the number of households in each governorate was determined proportional to the size of the selected governorate (self weighted sample). The same was applied in the 2006 EHCS. Second Stage: The PSUs of the 2005 EDHS of the selected governorates were used as a frame for the 2006 EHCS survey. A total of 153 PSUs were selected randomly from all governorates from both urban and rural units (the same PSUs as in the 2005 EHCS). However, for the 2006 survey only one segment was chosen from each PSU. Third Stage: Using the household listing in these segments, a systematic random sample of about 10 households was chosen from each segment (153 PSU). A total of 1530 households were selected for the survey. Eligibility: In the selected households, interviews were conducted with all eligible household members. Eligible household members included ever- married women aged 15-49 years, husbands of those eligible women, and never-married youth aged 15-24 years. Questionnaire development The 2006 EHCS involved two types of questionnaires: a household questionnaire and an individual questionnaire. The household questionnaire was adapted from the 2005 Menya Village Health Survey (MVHS 2005). The individual questionnaire focused predominantly on exposure to health communication, with a set of additional questions on Avian flu and concern about message and on health behaviors. In addition, a special module about the Alam Simsim program was designed for children and their guardians. The household questionnaire consisted of two parts: a household schedule and a series of questions relating to the socioeconomic status of the household. The household schedule was used to list all usual household members. For each of the individuals included in the schedule, information was collected on the relationship to the household head, age, sex, marital status (for those 15 years and older), educational attainment (for those 6 years and older) as well as identifying individuals eligible for the individual interview. The second part of the household questionnaire obtained information on characteristics of the physical and social environment of the household (e.g., type of dwelling, availability of electricity, source of drinking water, household possessions, and average monthly income and expenditures on the household. The individual questionnaire was administered to all ever-married women aged 15-49 who were usual residents, husbands of women in the reproductive age, and never-married male and female youth aged 15-24. In general, individual questionnaires gathered information on the following topics: • • • •
Respondent’s background Exposure to media channels and avian flu campaigns Knowledge of the mode of transmission of the avian flu virus. Reporting avian flu cases.
• Exposure to health messages.
3
Data collection activities
Staff recruitment. To recruit interviewers and field editors, a list of interviewers and field editors who had worked with El-Zanaty and Associates on the EDHS 2005 was prepared to identify those who were qualified to participate in the training. This action was taken to reduce the duration of training and to enhance the quality of the data. All candidates for the interviewer and field editor positions were university graduates and had intensive experience in DHS surveys. Another basic qualification was the willingness to work in any governorate covered in the survey.
Training materials. A variety of materials were developed for training personnel involved in the fieldwork. A lengthy interviewer’s manual was prepared and given to all field staff. The manual presented general guidelines for conducting an interview as well as specific instructions for asking each of the questions in the 2006 EHCS questionnaires. Other training materials, including special manuals describing the duties of the team supervisor and the rules for field editing, were prepared. Supervisor and interviewer training. Interviewer training for the 2006 EHCS data collection began in the 15th of May 2006. Eleven supervisors and 32 interviewers participated in the training program (10 male interviewers and 22 female interviewers). The training program was held in Cairo for 4 days. The training program included: • Lectures related to basic interviewing techniques and specific survey topics (e.g., Avian flu reproductive health and family planning, communication interventions, healthy life style and passive smoking); • Sessions on how to fill out the questionnaire, using visual aids; • Opportunities for role playing and mock interviews; • One day of field practice in area not covered in the survey;
• One quiz. Trainees who failed to show interest in the survey, who did not attend the training program on a regular basis were terminated immediately. A special session for supervisors was conducted during the training and prior to the main fieldwork training. This session focused specifically on the supervisor’s duties including field editing instructions.
Fieldwork. Fieldwork for the 2006 EHCS began in 19th of May and was completed by early June 2006. A total of 40 staff was responsible for the data collection. The field staff was divided into 10 teams; each team was composed of a supervisor and three interviewers (1 male interviewer and 2 female interviewers). Each team worked in 1 to 3 governorates depending on the total sample size assigned for each team. Data processing activities
Office editing. Questionnaires were collected from teams by staff from the central El-Zanaty & Associates office that was responsible for conducting visits to field teams on regular basis. Office editors reviewed questionnaires for consistency and completeness, and a few questions (e.g., occupation) were coded in the office prior to data entry. To provide feedback for the field teams, the office editors were instructed to report any problems detected while editing the questionnaires; these problems were reviewed by the senior staff. If serious errors were found in one or more questionnaires from any team, a list of those errors and ways to avoid them were reported and sent to all teams. Machine entry and editing. The machine entry and editing phase began while the interviewing teams were still in the field. The data from the questionnaires were entered and edited on
4
microcomputers using the Census and Survey Processing System (CSPro), which is a software package for entering, editing, tabulating, and disseminating data from censuses and surveys. Eight microcomputers with 8 data entry personnel processed the 2006 EHCS data. During the machine entry, 100% of each segment was reentered for verification. By working one shift 6 days per week, the data processing staff completed the entry was completed by the mid of June. In addition, recoding and editing of data was completed by the end of June 2006.
1.5
Coverage of the Survey
Table 1.1 summarizes the outcome of the fieldwork for the 2006 Egypt Health Communication Survey, by region and urban-rural residence. The table shows that, during the main fieldwork phase of the survey, out of 1,530 households selected for the 2006 EHCS, 1,500 households were found and 1,494 households were successfully interviewed, which represents a response rate of almost 100%. A total of 1,322 women were identified as eligible to be interviewed. Questionnaires were completed for 1,320 of those women, which represents a response rate of almost 100%. A total of 1,230 husbands were identified as eligible to be interviewed; out of those, 1,211 husbands were successfully interviewed, a response rate of 99%. Finally, 1,473 youth were interviewed out of 1,500 eligible youth with a response rate of 98%. No substantial variation in the response rates among different respondents across region and urban-rural residence were found. Table 1.1 Results of the Household and individual Interviews Number of household and eligible women, husbands, and youth interviewed and response rates, by region and urban-rural residence, EHCS 2006. Urban/rural
Region
Urban Rural Urban Rural Urban Lower lower Lower Upper Upper Upper governorates Egypt Egypt Egypt Egypt Egypt Egypt Urban Rural Total Household Results Households sampled Households found Households Interviewed Household response rate Individual Results Women sampled Women interviewed Women response rate (%) Husbands sampled Husbands interviewed Husbands response rate (%) Never-married male youth sampled Never-married male youth interviewed Never-married male youth response rate (%) Never-married female youth sampled Never-married female youth interviewed Never-married female youth response rate (%) Youth sampled Youth interviewed Youth response rate (%)
290 280 280 100.0
680 666 664 99.7
201 191 191 100.0
479 475 473 99.6
560 554 550 99.3
159 158 155 98.1
401 396 395 99.7
650 629 626 99.5
880 871 868 99.7
1,530 1,500 1,494 99.6
197 197 100.0 174 172 98.9
599 598 99.8 561 557 99.3
142 142 100.0 131 131 100.0
457 456 99.8 430 426 99.1
526 525 99.8 495 482 97.4
119 407 118 407 99.2 100.0 108 387 108 374 100.0 96.6
458 457 99.8 413 411 99.5
864 863 99.9 817 800 97.9
1,322 1,320 99.8 1,230 1,211 98.5
131
403
78
325
351
60
291
269
616
885
126
398
78
320
336
57
279
261
599
860
96.2
98.8
100.0
98.5
95.7
95.0
95.9
97.0
97.2 97.2
101
258
66
192
256
66
190
233
382
615
100
257
66
191
256
66
190
232
381
613
99.0 232 226 97.4
99.6 661 655 99.1
100.0 144 144 100.0
99.5 517 511 98.8
99.6 502 493 98.2
99.7 998 980 98.2
99.7 1,500 1,473 98.2
100.0 100.0 100.0 607 126 481 592 123 469 97.5 97.6 97.5
5
Socioeconomic Characteristics of Households and Respondents
2
The objective of this chapter is to provide a demographic and socioeconomic profile of the respondents in the 2006 EHCS survey along with a descriptive assessment of the environment in which the respondents (ever-married women, husbands, male and female youth) live. This was accomplished by examining the general characteristics of the households in the sample. Information is presented on the age, sex, and education of the household population as well as on housing facilities and household possessions. This chapter also provides a profile of the respondents (ever-married women, husbands, and never-married youth 15-24) who were interviewed in the 2006 EHCS survey. Information is presented on a number of basic characteristics of the 2006 EHCS respondents, including age, residence, education, and work status. The profile of the households included in the 2006 EHCS, described in this chapter, will provide a context for the results presented in the following chapters. In addition, it may provide useful input for social and economic development planning.
2.1
Household Composition (Table 2.1)
Table 2.1 presents the distribution of households in the EHCS sample per region by sex of the head of the household and by the number of household members. The importance of these characteristics is that they are often associated with socioeconomic differences between households. For example, female-headed households are frequently poorer than male-headed households. In addition, the size and composition of the household affects the allocation of financial and other resources among household members, which in turn influences the overall well-being of these individuals. Household size is also associated with crowding in the dwelling, which can lead to unfavorable health conditions. The household composition is presented based on de jure members (i.e., usual residents). Females were the household head for 12% of the households (see Figure 2.1). There is minor variation in the proportion of femaleheaded households by region. In Urban Governorates 16% of households are femaleheaded, compared to 10% in rural Upper Egypt. The average number of persons per household is 5.0, with some variation across the different regions. The average number of persons per household in Urban Governorates is 4.1 compared to 4.9 in Lower Egypt and 6.1 in Upper Egypt (see Figure 2.2). Slightly more than one-quarter of households has 3 members or fewer, while 20% of the households have 7 or more members.
Fig. 2.1: % of Female Headed Households 15 12 10
Total
Urban
Rural
6
Fig. 2.2: Mean Household Size 6.1 5.6 5
Total
5.2
4.9 4.2
Urban
Rural
4.1
Urban govern orate s
5.6 4.6
4
Total
Urban
Rural
Total
Lower Egypt
2.2
Urban
Ru ral
Upper Egypt
Education of the Household Population (Table 2.2)
The educational level of the household members is among the most important characteristics of the household because it is associated with many issues including reproductive behavior, knowledge and exposure to different messages. Results from household interviews can be used to look at both educational attainment among household members and school attendance among children and young adults. Educational attainment Data on the educational level of the household population (age 6 and over) is presented in Table 2.2 in the annex. Primary and preparatory education (9 years of schooling) is considered basic education and is compulsory. The secondary stage, which includes an additional 3 years of schooling, is not compulsory. The results in Table 2.2 confirm that there is a gap in the educational attainment between males and females. Overall, 84% of males in the EHCS households have ever attended school compared to only 69% of females (see Figure 2.3). Among those who attended school, the mean number of years of schooling for males is 7.7, while the mean level for females is 6.1 (see Figure 2.4). The highest mean number of years of schooling for males and females was found in urban Lower Egypt (9.5 for males and 8.1 for females).
Fig. 2.3: % Who ever attended school 90
84
82
69
Total
81 62
Urban Male
Rural Fe male
In general, respondents from urban areas are more educated than respondents from rural areas. Looking at the educational level across the different regions, it is clear that respondents from Urban Governorates are more educated than respondents from the other regions. Only 8% of males and 17% of females from Urban Governorates had no education. In addition, respondents in Urban Governorates and urban Lower Egypt reported the highest percentage of university or higher education attendance, with 30% of males and 22% of females having attended university or higher in Urban Governorates. The situation is different in Upper Egypt where 19 % of males and 36 %
7
of females had no education, while only 13 % of males and 8 % of females have attended university or higher. An examination of the differences in Fig. 2.4: Mean Number Years of Schooling educational indicators between regions (among those who attended school) indicates substantial differences 9.1 between regions in the educational 8 7.7 attainment of both males and females. 6.9 6.1 For example, the mean number of 5 years of schooling for males is 9.5 years in urban Lower Egypt compared to 7.2 years in rural Lower Egypt and 6.6 years in rural Upper Egypt. Additionally, female education has Total Urban Ru ral substantial differences across regions. Male Fe male For example, while the mean number of years of schooling is 8.1 years in urban Lower Egypt and 8.0 in Urban Governorates, the mean number of years of schooling is only 4.4 years in rural Upper Egypt. Also, the gap between male and female years of education is greatest in rural Upper Egypt (2.2 years) and the least in Urban Governorates (0.8 years).
2.3
Household Environment (Table 2.3 – 2.4)
Housing characteristics Information on housing characteristics, including electricity, the source of drinking water, type of sanitation facilities, type of flooring, and number of rooms in the dwelling is shown in Table 2.3. These are important determinants of the health status of household members, particularly children. They can also be used as indicators of the socioeconomic status of households. Overall, almost all 2006 EHCS households live in dwellings More than 95% of with electricity, and more than 95% of households have households have access to access to piped water, mainly within their dwelling or yard. piped water, mainly within For most households, the source of their drinking water is their dwelling or yard. within their dwelling or yard. Some variations exist between regions; while all households from Urban Governorates have access to piped water in their dwelling, only 85% of households in rural Upper Egypt have access to piped water in their dwelling or yard. More than half of the households in the 2006 EHCS have traditional toilets, mainly without bucket flush, and 42% have modern flush toilets. Less than one percent of households have no toilet facility. There are differences in the type of toilet facility across regions. Around 82% of households from Urban Governorates and, 79% of households from urban Lower Egypt have modern toilets compared to only 10% of households from rural Upper Egypt. In general, traditional toilets are more common in rural areas while modern toilets are more common in urban areas. With regard to flooring, 57% of households live in dwellings with cement tile floors, 19% live in dwellings with cement flooring, 12% live in dwelling with ceramic or marble tile flooring, and 11% live in dwellings with earth or sand flooring. There are differences among the different regions with regard to the flooring materials. Around 3 in 10 households in rural Upper Egypt live in a dwelling with earth/sand floors, while less than 1% of households in Urban Governorates have sand flooring. Cement tiles were used more in urban Lower Egypt (70%) and least used in rural Upper Egypt (37%). The 2006 EHCS questionnaire included a question on the number of rooms that a household had (excluding the bathrooms, kitchen, and hallways). Merging this information with the information on the number of persons in the household provides a measure of crowding. Table 2.3 shows that
8
only 8% of households have 1 or 2 rooms, 473% have 3-4 rooms, and 19% have 5 or more rooms. The mean number of rooms per household is 3.8, and there is an average of 1.4 persons per room.
Household possessions Information on household ownership of durable goods and other possessions is shown in Figure 2.5. With regard to durable goods, 95% of EHCS households own a television (color or black and white), four in five households own a radio with a cassette recorder, around 9 in 10 own an electric fan, 94% own a washing machine, 95% own a gas/electric cooking stove, 87% own a refrigerator, and 45% own a water heater. In addition, 57% of the households have a telephone, and more than one-third have a mobile phone.
95
Fig. 2.5: % of Households who have various possessions 94
89
Te le vision
95
87
Ele ctirc fan
Refrige rator
Washin g Gas/ele ctric machin e ccok ing stove
In general, households in Urban Governorates and urban Lower Egypt own more of these items than households in other regions, while households in rural Upper Egypt are less likely to have the convenience of these items than the other regions. Less than 30% of households own livestock/poultry: 46% of households in rural areas own these items compared to only 3% of households in urban areas. It is worth mentioning that 49% of households in rural Upper Egypt own livestock or poultry. Reported ownership of livestock/poultry in all regions is much lower than in the 2005 EHCS. This may be the result of the governmental decree on awareness about the risk of contracting avian influenza as a result of handling poultry. The survey also collected information on household ownership of means of transportation. Overall, only 8% of households own a car/van/truck, with the highest rate of ownership in Urban Governorates (14%) and the lowest rate in rural Upper Egypt (4%). Relatively few households have a motorcycle (1%). Rates of ownership of bicycles vary from 20% in rural Upper Egypt and 21% in rural Lower Egypt to only 2% in Urban Governorates.
Households in rural areas are more likely (30%) to own land or farm compared to households in urban areas (6%).
As expected, households in rural areas are more likely to own land or a farm compared to households in urban areas (29% and 5% respectively).
2.4
General Characteristics of Respondents (Table 2.5- Table 2.5a)
This section discusses the characteristics of the survey respondents, including age, educational level, and work status. The results for ever-married women, ever-married men, and never married youth are discussed separately. Background characteristics of ever-married women Results of this survey indicate that 37% of the ever-married women interviewed in the 2006 EHCS are 30 years old or less and around one-third are 40 years old or more; there are fewer women in the 15-19 group (4 %) than in the other cohorts. This was expected as many women aged 15-19 are not yet married, and hence not included in the sample of ever-married women. Overall, 94% of ever-married women are currently married and 6 % are widowed or divorced.
9
Regarding the educational level of women, 36% of ever-married women have no education, while 42% completed secondary or higher. Only 14% of women from Urban Governorates have never been to school, compared to more than half of women from rural Upper Egypt. Regarding work status for women, 12% of women are working for cash. About one-quarter of women from urban Lower Egypt are working compared to 13% of women from rural Lower Egypt. Additionally, 22% of women from urban Upper Egypt are working for cash compared to 6 % of women from rural Upper Egypt. Background characteristics of husbands Background characteristics of husbands are shown in Table 2.5. From the age distribution of husbands presented in Table 2.5 it is clear that husbands are typically much older than their wives. Slightly more than half of the husbands are 40 or older and only 17% are under age 30. Husbands are also more educated than their wives. Fifty percent of husbands completed secondary or higher and only 21% of husbands have no education. One-third of husbands from rural Upper Egypt have no education compared to 8% of husbands from Urban Governorates. Additionally, husbands from urban areas are more educated than husbands from rural areas. Ninety six percent of husbands are currently working, with 95% of husbands working for cash. Differences between regions are minimal. Fig. 2.6: Background Characteristics of Women and Husbands 88 69
36
29
21 9
13
13
31
30
16
13
No Prim ary Primary S econ dary complete education incom plete comple te /some se condary Education status
21
12
Highe r
Wom en
Work ing cash
Hu sban d
Not work ing cash
Work status
Background characteristics of never-married female youth Background characteristics of never-married female youth are shown in Table 2.5a. Due to the fact that only never-married female youth aged 15-24 were interviewed, about two-thirds of nevermarried female youth are in the age group 15-19 and around one-third are in the age group 20-24. Only 10% of never-married female youth have no education. Around one-quarter of them obtained higher education. Only 20%-eight percent of never-married female youth from Urban Governorates have no education compared to 21% of those from rural Upper Egypt. Only 7% of never-married females are currently working for cash. Nine percent of never-married female youth from urban Upper Egypt are working for cash compared to 4% of never-married female youth from rural Upper Egypt.
10
2.5
Television Watching Habits
Television plays a vital role in providing respondents with information. To obtain information about the role of TV as a source of information, questions were asked to assess respondents’ exposure to TV, and their preferred channels. The results indicate that females (ever-married women and At least 90% of all groups youth) are more likely to watch TV than male respondents. watch TV, except husbands About 97% or more of ever-married women and female youth in rural Upper Egypt reported that they regularly/sometimes watch TV compared to 92% or less among male youth and husbands. Respondents in Urban Governorates are more likely than those in other regions to regularly/sometimes watch TV. Most of those who watch TV prefer channels one and two from the national/local channels. On the other hand, a substantial percentage of all groups of respondents reported a preference for satellite channels. Respondents in urban areas Fig. 2.7: % of respondents who prefer specific TV are more likely than rural Channels respondents to prefer satellite channels. Data from the 2006 EHCS revealed that Rotana Cinema is the 32 preferred channel for all 25 24 19 19 16 groups of respondents, 16 16 14 14 14 13 11 12 10 9 except for husbands who prefer Iqraa/Majd/ElN. Rotan a Re ligiou s Dre am ART Youth were slightly more ch an ne ls likely ever-married women and husbands to prefer ART Wome n Hu sband Fe male Male channels.
11
EXPOSURE TO MESSAGES ABOUT AVIAN FLU
3
In response to the government’s concern about the outbreak of Avian Influenza, the CHL program has implemented a national communication strategy to provide households with key messages about avian influenza, especially farmers and poultry breeders. This communication campaign included informative TV spots, TV programs, flyers, seminars, community meetings, and seminars at health facilities. In this regard, all respondents were asked a series of questions to identify their exposure to avian influenza messages via the different media channels and to investigate and recall of these messages. The results of those questions are presented in this chapter. 3.1 Exposure to TV Spots about Avian Flu (Table 3.1) In response to the government of Egypt’s desire to increase public awareness about Avian Flu, three TV spots were produced. Respondents were asked if they watched on a TV spot on Avian Flu during the 3 months prior to the survey. If yes, they were asked what they learned from the spots and if they discussed the spot with anyone. The results indicate that exposure to avian influenza TV spots is higher among women and female youth than among husbands and male youth. Around 80 % of women and 76 % of female youth watched TV spots on Avian Flu. Respondents in Urban governorates are less likely to report exposure to Avian flu spots than those in other areas. The highest level of exposure was observed among women in Urban Upper Egypt (86%), husbands in Urban Lower Egypt (77%), female youth in rural Lower Egypt (81%), and male youth in Lower Egypt (71%).
Fig. 3.1: % of respondents exposed to TV spots about Avian Flu 80 76 72 67
Wome n
Hu sbands
Ne ve rNe vermarrie d m ale marrie d youth fem ale you th
Virtually all respondents learned something from the spots. Less than one third of all respondents either did not see the spots or did not learn anything from them. Respondents were most likely to mention that they learned what Avian flu is, how to protect themselves from Avain flu, how to deal with birds, how to handle birds, how to identify an infected bird, the importance of hand washing, and how to deal with dead birds. Respondents who saw the Avian flu spots were asked if Around one-third of women they discussed the spots with anyone. The results indicate in Upper Egypt did not talk that around 18 percent of women mentioned that they did not talk about the spot. Around one-third of women in to anyone about the spots Upper Egypt did not talk about the spots compared with compared with ony 7 % in only around 7 % in Lower Egypt. Male youth are least Lower Egypt. likely to discuss the spots (26%). Women and husbands are most likely to report discussing the spot with their spouse (48% and 57%, respectively). Male and female youth are most likey to discuss the spots with family members.
12
3.2 Exposure to TV Programs about Avian Flu (Table 3.2- Table 3.2a) During the three months preceding the survey, many TV programs about avian influenza were aired. These programs explained what avian flu is, how to protect oneself, how to identify infections, and how to report suspected cases. Respondents were asked whether they saw such TV programs during the 3 months prior to the survey. Tables 3.2 and 3.2a present the results. Fig. 3.2: % of respondents exposed to TV Exposure to TV programs about avian flu progams about avian flu is lower than exposure to the spots about 46 avian flu. Around 45 % of women, 43% 45 43 of husbands, and 46% never-married 40 female youth report watching a TV program about avian flu. Never-married male youth were less exposed to TV programs about avian flu in the 3 months preceding the survey (40%). Significant Wome n Hu sbands Ne verNe ve rdifferences exist by region and urbanmarrie d marrie d m ale rural residence. fem ale you th
youth
Around one third of all respondents reported that the program taught them how to protect themselves from avian flu. Around 25% of women, husbands, and female youth, and 20% of male youth learned what avian flu is and how to handle birds. 5-10% of all groups reported learning how to handle birds, how to identify an infected bird, how to deal with dead birds, and the importance of hand washing. 3.3 Exposure to Printed Media about Avian Flu (Table 3.3- Table 3.3c) The 2006 EHCS also collected information about exposure to print media about avian flu. Respondents were asked if they read anything about the subject during the 3 months prior to the survey. In addition, they were asked if they saw any posters/flyers/ billboards about avian flu in the 3 months prior to the survey. If yes, they were asked where they saw this and what they learned from it. One in ten women read something about avian flu in the 3 months prior to the survey. Exposure among husbands, female and male youth is slightly higher (17%, 15%, and 13 percent respectively). This is may be due to the higher level of education among these latter groups.
Fig. 3.3: % of respondents exposed to print media about avian flu 17
15
11 8
9
13 10
8
About ten percent of all respondents reported seeing posters/flyers/brochures Wome n Hu sbands Ne ve r-m arrie d Ne ver-marrie d about avian flu. Urban respondents are fem ale you th male youth more likely to report seeing those Re ad Saw materials than rural respondents. However, the highest level of exposure to those materials was observed among women from urban Lower Egypt. Women and husbands are most likely to report seeing posters, flyers, and brochures about avian flu in health units (3%), while female and male youth are most likely to report seeing them on street ( 4%,and 5% respectively). Respondents report that print media about avian flu taught them what the disease is, how to handle with birds, how to protect themselves from avian flu, and how to identify infected birds. However,
13
around 90% did not see posters/flyers/brochures about avian flu, or did not learn anything from them. 3.4 Exposure to Seminars/Community meetings about Avian Flu (Table 3.4) One of the interventions adopted by the CHL program during the outbreak of avian flu in Egypt consisted of community meetings and seminars that talked about the subject. The 2006 EHCS investigates to what extent respondents were exposed to those activities, and what they learned during these meetings and seminars. As confirmed in many previous surveys, attendance of community meetings is very low. 3% of women, 4 percent of husbands, 4 % of never-married female youth, and 1% of never-married male youth attended community meetings/seminars that talk about avian flu. Women from urban areas are most likely to attend community meetings/seminars about avian flu. Because of the small number of respondents who attended community meetings or seminars about avian flu, we are unable to assess what the respondents learned from these meetings and seminars.
Fig. 3.4: % of respondents who attended seminars or community meetings about avian flu 4 3.6
2.5 1.2
Wome n
Hu sbands
Ne ve r-m arrie d Ne ver-marrie d fem ale you th male youth
14
KNOWLEDGE AND ATTITUDES OF THE AVIAN FLU VIRUS
4
Knowing about the modes of transmission of the avian flu virus helps people understand how to protect themselves from infection. The 2006 EHCS included questions on knowledge about the ways of transmission, about symptoms of avian flu in people and birds, and about the ways to protect oneself from infection. The results of these questions are presented in the following sections. 4.1 Modes of Transmission (Table 4.1- Table 4.1a) Respondents were asked if they know how Fig. 4.1: % of respondents who know how avian flu is transmitted. The results indicate avian flu is transmitted 94 92 92 91 that knowledge about how avian flu is 82 81 transmitted is high; around 83% of women, 78 78 85% of husbands, 86% of never-married female youth, and 82% of never-married male youth report knowing how avian flu is transmitted. Knowledge of the modes of Ne ve rWome n Hu sbands Ne vertransmission varies by region, especially for m arried male marrie d youth fe m ale youth women and never-married male youth. For example 97% of male youth in Urban Urban Ru ral Lower Egypt reported knowing how avian flu is transmitted compared to only 68% in rural Upper Egypt. The most frequently mentioned mode of transmission is handling live birds (mentioned by 60% of women, 63% of husbands, 62% of female youth, and 59% of male youth). Touching dead birds was reported by 38-45% of respondents. Other responses, such as not cooking birds well, eating birds or eggs, were reported by 10% or more of all respondents. Around 17% of women, 16% of husbands, 14% of female youth, and 18% of male youth mentioned that they do not know a mode of transmission. In addition, respondents were asked if avian flu can be transmitted from one person to another. Around one quarter of women and male youth and one fifth of husbands and female youth agreed that avian flu can be transmitted from person to another, with significant differences by region. For example 10% of women in urban governorate belief this, compared with 31% in rural Upper Egypt.
The most frequently mentioned modes of transmission are handling live bird and touching dead birds.
4.2 Symptoms of Avian Flu Virus (Tables 4.2- 4.3a) Respondents were asked about their knowledge of symptoms of avian flu in people and birds. The results indicate that over 75% of all respondents reported that they know the symptoms of avian flu in either humans or birds. Knowledge is lower in rural than urban areas among all subgroups.
Fig. 4.2: % of respondents who report knowing the symptoms of avian flu in humans 89 88and birds 88 85
80
Wome n Humans
81
Husbands Brids
82
79
Ne ve rNe vermarried marrie d male fe male youth youth
The most commonly reported symptoms of avian flu in humans are fever (70% of all respondents). Other symptoms, such as cough, inflammation in eye bellows, congestion of the throat, and muscle pain were reported by about one third of respondents. The most frequently reported symptoms of avian flu in birds were weakness (55%), blowzy in feathers (40%), and lack of egg production (reported by 37% of women, 36% of husbands, and 31% of both female and male youth). 4.3 Ways of Protection from Avian Flu Virus (Table 4.4Table 4.4a)
About half of all respondents reported weakness and blowzy in feathers as symptoms of Avian Flu in birds
When respondents were asked if they know ways to protect More than two-thirds of themselves from avian flu, 91% of women and husbands, 92% of all respondents never-married female youth, and 89% of never-married male mentioned that not youth reported that they know ways to protect themselves from breeding birds at home is avian flu. Some variations exist between regions. Two-thirds of one of the protective all respondents mentioned that not breeding birds at home is the measures against best way to protect oneself from getting avian flu. Respondents contracting Avian Flu. from Urban Governorates are most likely to mention this, while respondents from rural Upper Egypt are least likely to do so. One-third of all respondents noted that it is important to fully cook birds to prevent infection. Other responses include keeping children and elderly away from birds, wearing gloves or plastic bags when contacting birds or dead birds, and regular handwashing with water and soap. 4.4 Attitudes Toward Avian Flu (Table 4.5-Table 4.5a) To investigate attitudes related to avian flu, a series of About one-quarter of all statements were read to the respondents and interviewers asked respondents among if respondents strongly agreed, agreed, disagreed or strongly different groups agreed disagreed with the statement. Around 95% of all respondents that there is a possibility agreed or strongly agreed that getting infected with avian flu that they would get would be very serious. Only around 25% of all respondents agreed or strongly agreed that it is possible to get infected with infected with Avian Flu. avian flu. Most respondents agreed that careful handling of birds is an effective way to avoid infection with avian flu (82% of women, 83% of husbands, 85% of never-married female youth, and 79% of never-married male youth). Few respondents agreed that it is possible that the avian flu problem will increase in the coming years (27% of women, 25% of husbands, 26% of female youth, and 31% of never-married male youth).
16
PRACTICES AND BEHAVIOR CHANGE RELATED TO BIRDS
5
The Avian Influenza communication strategy developed by the Communication for Healthy Living project included a number of messages about the precaution to be taken by Egyptians to avoid contracting avian influenza, and about safe ways to handle and dispose of birds. Thus, the survey collected information to assess the impact of this communication campaign on behavior change. This chapter examines practices related to bird handling and ownership. In addition, the chapter looks at self-reported behavior changes related to bird keeping and handling.
5.1 Bird keeping at home (Table 5.1-5.1c) Eligible respondents were asked if they had birds at home at the time of the interview and if so where they keep them. In addition, if respondents reported that they do not keep birds at home they were asked if they had birds at home during the 6 months prior to the interview. Table 5.1 present the percentage of respondents who reported having birds at home. Slightly less than one-fifth of respondents mentioned that they had birds at home at the time of the interview. Among those who keep birds at home, around 3 in 5 respondents mentioned keeping the birds in a cage inside the house, either in one of the rooms, on the roof, or courtyard. One-quarter of respondents mentioned that birds where kept in a cage- outside the house (in courtyard or the roof).
Fig 5.1: % of respondents who keep birds at Home
18
17
Wom en
14
Hu sban ds
C urren tly
40
40
37
37
19
Ne verNe ve rmarrie d m ale marrie d youth fe male youth The past 6 month s
About two-fifth of the respondents mentioned that they had birds during the 6 months prior to the survey (i.e., around 40 percent got rid of the birds they had). Almost all respondents mentioned that the birds were slaughtered for food (96 percent or more).
5.2 Behavior changes (Table5.2-5.2c) Respondents were asked about changes in practices related to keeping and handling birds in the past 3 months preceding the survey. Those practices include avoiding contact with birds, keeping children and elderly away from birds, talking with others about ways to protect themselves against avian flu, practices related to handling birds and eggs, and reporting dead birds to authorities.
Fig. 5.2: % of respondents who had contact with Birds in Past 3 Months 65 62
56 38
37
Wom en Urban
Hu sban ds Rural
54 37
31
Ne ve rNe vermarrie d marrie d m ale fe male youth youth
17
Table 5.2 shows that the most commonly reported behavior change in the preceding three months was to discuss with others how to protect oneself from avian flu (70 percent of women, 71 percent of husbands, 69 percent of never-married female youth, and 61 percent of never-married male youth). Slightly more than half of women and never-married female youth reported avoiding contact with birds. Half of husbands and 47 of never-married male youth also reported avoiding contact with birds during the past 3 months preceding the survey. Female respondents were more likely to report washing their hands with soap after preparing poultry for cooking, handling poultry and eggs differently, and washing kitchen utensils more carefully after preparing poultry for cooking (58 percent of more among women and 4 in 10 never-married female youth).
5.3 Behavior changes among respondents who have birds at home (Tables 5.35.3a) Respondents, who mentioned that they had birds at home at the time of the interview, were further asked if they changed their behavior or took precautions to avoid infection. Information was collected about changes in how birds are handled, in how birds are kept, and in keeping children and elderly people away from birds. Forty-eight percent of women, 42 percent of husbands, 54 Around fifty percent of percent of never-married female youth and 38 percent of respondents mentioned never-married male youth mentioned that they changed the that they go to nearest way they handle birds. Among respondents who have birds at hospital if got infected. home, only about one-third of women, 30 percent of husbands, 29 percent of never-married female youth, and 15 percent of never-married male youth reported caging the birds. Around two-fifth of women, husbands and never-married female youth, and one-fifth of never-married male youth mentioned that they kept children and elderly people away from birds.
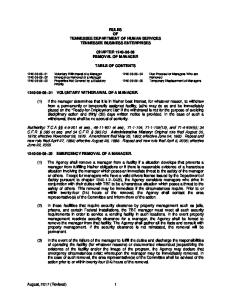
5.4 Reporting the Infected Cases (Tables5.4-5.4a) Respondents were asked what to do if they got infected with avian flu, 98% mentioned going to the nearest hospital. Similarly, most respondents reported that if someone in the family got infected, they should be taken to the nearest hospital. Relatively few people said they would report people who keep birds at home to the authorities, or that they would report it if they found a dead bird. 48% reported not doing anything if they know that someone is keeping birds at home or if they found dead birds in the street. However, around one-third reported that if they find dead birds in the street they will report it to the authorities.
18
EXPOSURE TO MESSAGES ABOUT SAFE PRACTICES
6
Promoting healthy lifestyles for households is one of the main objectives of the CHL program. To encourage healthy behaviors and life styles, the program aims to increase demand for health services. Thus, with these objectives in mind, CHL communication messages promote handwashing, use of safe injections, avoiding smoking or second hand smoke, and use of antenatal and postnatal care. Exposure to such messages was investigated in the survey to monitor the reach of those messages.
6.1 Exposure to Messages about Hand Washing (Table 6.1) Respondents were asked if they saw any messages during the 6 months prior to the survey about hand washing. The results show that around half of women and nevermarried female youth saw a message about hand washing; husbands and never-married male youth are less exposed to such messages (around 40% of both). Most of those who reported that they were exposed to such messages mentioned that they saw it on TV. Only 4% of women and female youth, and 2% of husbands and male youth reported they heard the message on the radio.
Fig. 6.1: % or respondents exposed to TB messages about 59 Hand Washing 47
48 50
47 35
Wom en Urban
Hu sban ds Rural
40
35
Ne verNe ve rmarrie d m ale marrie d youth fe male youth
Women are most likely to recall messages about hand washing before preparing food (32%), followed by hand washing to prevent disease (29%). Husbands, female youth, and male youth are most likely to recall messages encouraging hand washing to prevent disease (26%, 31%, and 24% respectively), followed hand washing before preparing food (20%, 27%, and 19% respectively). Messages about hand washing before eating and after defecation had lower recall.
6.2 Exposure to Messages about Safe Injection (Table 6.2) Several communication programs provide information about safe injections, with the aim of reducing Hepatitis infections. To assess the extent to which efforts to inform Egyptians about safe injection practices are succeeding, all respondents were asked if they saw or heard any messages about safe injections during the six months preceding the survey. Overall, exposure to safe injection messages was lower than exposure to messages about hand washing. Around one-third of women, husbands, and female youth were exposed to such messages, mainly on TV. However, male youth have lower exposure (around 25%).
Fig. 6.2: % of respondents exposed to TV Messages about 38 36 36 35 Safe Injections 33 29
30 22
Wom en Urban
Hu sban ds Rural
Ne ve rNe vermarrie d marrie d m ale fe male youth youth
The most frequently recalled message was that one should not share or reuse needles; which was reported by around 25% of women, husbands, and female youth and only 20% of male youth. Respondents also recalled messages indicating that hepatitis C, tetanus, HIV/AIDs can 19
be spread by infected needles (19% or less), that one should ask providers to use disposable needles (15% or less), or purchase a disposable syringe for the provider to use (10% or less).
6.3
Exposure to Messages about Second Hand Smoking (Table 6.3)
Non-smokers who are exposed to second hand smoke have a higher risk of suffering of heart disease than those who live and work in a smoke-free environment. Accordingly, to assess awareness of the risk of second hand smoke, the 2005 EHCS questionnaire included questions asking whether the respondents heard/seen any message about the health effect of second hand smoke during the six months preceding the survey from different sources. Those who had been exposed to such messages were asked to recall messages.
Exposure to Messages about Second Hand Smoking on TV 50
52
50 46
50
45 41
Wom en Urban
Hu sban ds Rural
44
Ne ve rNe vermarrie d marrie d m ale fe male youth youth
Around half of all respondents exposed to second hand smoking messages during the 6 months prior to the survey, mainly on TV. Differentials by region are limited. Three main messages were recalled by all respondents; the most frequently one was smoking endangers the health of people around smokers which was reported by around 40% or more of all respondents, followed by diseases caused by second hand smoke; which was reported by more than one third of respondents. The other recalled message was effect of smoking on children and pregnant women which was mentioned by much lower percentages.
6.4
Exposure to Messages about Antenatal Care (Table 6.4)
Respondents were asked if they seen/heard a message or received any information about antenatal care during the 6 months before the survey, and what messages they received. Exposure is quite high among women only however, among other respondent is low. The main source of information is TV; other sources were reported by very low percentage. Significant differences are clear between regions and urban rural. Respondents from rural areas are more likely to expose to antenatal care messages than urban respondents, especially for never-married female and male youth.
41
Exposure to Messages about Antental Care on TV 40 32 25 20
18
14 8
Wom en Urban
Hu sban ds Rural
Ne ve rNe vermarrie d marrie d m ale fe male youth youth
The recall messages reported by respondents were mainly; importance of antenatal care, number of times a pregnant women should receive ANC, and danger sings during pregnancy. Those messages were recalled by around 25% of women or more, however lower percentages of husbands, female youth and male youth recalled those messages.
20
6.5 Exposure to Messages about Postnatal Care (Table 6.5)
The exposure to
The 2006 EHCS respondents were asked if they received postnatal care information about postnatal care during the 6 months preceding information is very low the survey. The exposure to postnatal care information is very among all respondents. low. The highest level of exposure was observed among women (21%), and female youth (15%). Exposure among husbands and male youth are much lower (10% and 5% respectively). Variations are clear between regions. The main source of information is the TV among all respondents. The recalled messages mentioned by women were; need to check mother’s health (18%), need to check child’s health (18%), early detection of disease (7%), and when mother should start use of family planning (5%). Same messages were recalled by husbands, female and male youth.
6.6
Exposure to Messages about Family Planning (Table 6.6)
Respondents were asked if they saw/heard or received any information about family planning during the 6 months prior to the survey. The majority of women reported receiving information about family planning during the 6 months prior to the survey. The main source of FP information is the TV (74%), followed by “from a family member and friends” (17%) and “from a health worker at a health facility” (15%). Differences are minor between regions. Exposure among never-married female youth (68%) is lower than among women, however, exposure is much lower among husbands and male youth (59%, and 50% respectively).
75
73
Exposure to Messages about Family Planning on TV 63 57
Wom en Urban
52
Hu sban ds Rural
68
47
48
Ne verNe ve rmarrie d m ale marrie d youth fe male youth
The most frequently messages recalled by all respondent was knowledge of FP methods, which was reported by around two-thirds of women, around half of husbands and female youth, and by more than one-third of male youth. Benefits of small family was recalled by a significant percent of respondents; 22-33% of all respondents. Other messages were recalled but with lower percentages; Spacing births 3-5 years, and using FP after birth of first child.
6.7
Exposure to Messages about HIV/AIDS (Table 6.7)
Respondents were asked if they have heard/seen and Never-married male and information about HIV/AIDS during the six months female youth are more likely preceding the survey. The results of the 2006 EHCS to see/hear information about show that never-married male and female youth are more HIV/AIDS. likely to see/hear information about HIV/AIDS (about 30% )than women and husbands do (21% and 25% respectively). All respondents reported TV as the source of information they received about HIV/AIDS. Minor variations were observed between regions. The most frequently message the respondents reported seeing/hearing is how HIV/AIDS is transmitted, which was reported by 17% of all women, 21% of husbands, 22% of nevermarried female youth, and 25% of male youth. The other message which was reported by all respondents is How to avoid getting HIV/AIDS which was reported by almost same percentages (16% among women, 20% among husbands, 20% among never-married female 21
youth, and 22% among male youth). Other messages were reported by less than 1%. Variations are somewhat clear between Upper Egypt and other regions. Recalling Messages about How HIV/AIDS is Transmitted 21
22
Husban ds
Ne ve rmarrie d fe male youth
17
Wome n
6.8
25
Ne ve rmarried m ale youth
Exposure to Health Campaigns (Tables 6.8- 6.10)
One of the objectives of the EHCS 2006 was to monitor the level of exposure to health communication activities in Egypt that can be used to assess the impact of such programs on health knowledge, attitudes, and behaviors. Specifically, the survey aimed to collect data that can be used to inform the design of the Communication for Health Living Project, and to help measure its reach and impact. The 2006 EHCS remedies by asking respondents very detailed questions about exposure to health communication activities, especially; family doctor spot, youth health is your wealth slogan, and Issal Istasher. The results are presented in Tables 6.8-6.10. Family Health Clinics will Include all Kinds of Examinations (Women) 5.7
3.4
3.1 2.7
2.6
2.4
2.3
2.5
2.2
1.5
Total
Urban
Ru ral
Urban gove rn orate s
Total
Urban
Rural
Lower Egypt
Total
Urban
Rural
Upper Egypt
Exposure to family doctor spot is very low, only17 % of women and never-married female youth mentioned that they saw such a message on TV, while 14% of husbands, and 13% of male youth reported seeing the spot on TV. Family’s doctor is available in every health unit is the messages recalled most by all respondents. Other messages were recalled by only 7% or less among all respondents; Among theses messages are Family’s doctor will be a private doctor for all family members to check their health, there will be a file for the history of diseases and their reasons for each family member, sharing in the cost of treatment in 22
Family’s doctor system, and family health clinics will include all kinds of examinations. Variations are clear by region. Exposure to your health is your wealth slogan is More than half of women and significantly more than family’s doctor. More than half never-married female youth of women and never-married female youth have have seen/heard your health is seen/heard your health is your wealth (around 55%, 60% respectively), and close to 50% of husbands and male your wealth youth admitted seeing/ hearing it. The main source of their exposure is TV, 5% of respondents reported other sources; newspaper, posters, and in health facility. As for Isaal Istashir spot, around 60% of women, and never-married female youth have ever seen the spot, around 10 percentage points higher than exposure among husbands and male youth. Exposure to Issal Istashir spot is higher in Upper Egypt compared with other regions. The main source of exposure as usual was TV followed by pharmacy or clinic. For example 55% of women reported that they saw the spot on TV, while 20% reported that they saw it on pharmacy or clinic. Same pattern was observed among other respondents. The most frequently messages recalled about Issal Istashir are; Advise people to consult a doctor/pharmacist about problems/inquiries, consult a doctor/pharmacy/medical center that has the symbol of "isaal istashir, and Describes/promotes use of FP methods. Those messages were reported by 11% of all respondents or more. Exposure to (Isaal Istashir) Spot on TV (Women)
76
65 61 55
55
54
52
49
48
42
Total
Urban
Ru ral
Urban gove rn orate s
Total
Urban
Rural
Lower Egypt
6.9
Total
Urban
Rural
Upper Egypt
Safe Practices Changes
A series of questions were asked to respondents in the EHCS 2006 to assess their behavior in the main area of concern to CHL. First respondent were asked if they called the hot line to get information about AIDS, if visited a health facility to get information or advice on AIDS, wash hands more to protect from diseases, purchased disposable syringes, and asked provider if he uses disposable syringe. The results indicated that less than 1% of respondents called the hot line to get information about AIDS. Women and husbands are more likely to go health facility to get advice than youth do, where 3% of female and male youth visited a health unit to get information or advice on AIDS compared with 4% among husbands and 9% among
23
women. Surprising respondents form Upper Egypt, especially rural are more likely to report contacting health unit to get information or advice about AIDS. Practices related to health hygiene and safe injections are more common. Around one quarter of male respondents reported washing hands more to protect form disease, and by around one third of female respondents. Around 25% of all women and one-fifth of husbands reported purchasing disposal syringe’s, which is almost double the percentage among youth (12% of females, and 14% of males). Seven percent of women and 6% of husbands asked providers to use disposal syringes, compared with 2% of youth (male and female).
Safe Practices Changes 35 32 25
26
23 20 12
14
Some other practices were Women Husban ds Ne ve r-m arrie d Neve r-married fe male you th male youth asked about to all respondents including; creating nonWash hands m ore to prote ct Purch ase d disposable syringe s smoking area, avoid second hand smoking. Only 7% or less of all respondents reported creating a non-smoking area in their home, with no significant differences between regions, except Urban Upper Egypt, where around 18% of women and husbands mentioned creating a non-smoking place. The percentage of respondents who reported that they avoid second hand smoking varies from around 22% of women, 20% of female youth, to 17% of male youth, and 13% of husbands. The percentage of respondents who reported avoiding second hand smoking was more common in rural than in urban areas. Other practices were addressed to women only; family planning use went for antenatal care, and for postnatal care. The results indicated that 9% of women went for ANC and only 4% went for postnatal care. The percentage of women who used FP methods is much higher (29%). Some differentials were observed between regions.
24