Strategic Development of Higher Education and Science in Georgia Policy Analysis of Higher Education according to Five Strategic Directions
II – Funding and Financial Management of Higher Education and Research Expert – Lela Chakhaia
Tbilisi 2013
1
Table of Contents 1. Hypothetical model ............................................................................................................................. 3 a. Amount and sources of funding hig her education and research ........................................................ 3 Amount of state funding................................................................................................................... 4 b. Mechanis ms of funding and financial management .......................................................................... 7 State funding recipient ..................................................................................................................... 7 2. Situatioin in Georgia ......................................................................................................................... 12 a. amount and sources of funding ........................................................................................................ 12 Sources of funding.......................................................................................................................... 14 b. Mechanis ms of funding univers ities and research in Georgia ......................................................... 14 3. Recommendations ............................................................................................................................. 21 Higher education and research funding models .................................................................................. 22 First (short and middle length) model of funding ............................................................................ 22 Assessment and analyses of existing funding mechanis ms ............................................................... 23 Mechanisms of students aid ............................................................................................................ 24 Second (long-term) model of funding ............................................................................................. 26 Bibliography:......................................................................................................................................... 27 European Commission (2008); Higher Education Governance in Europe ................................................ 27 OECD, (2013), Education at a Glance: OECD Indicators 2013, OECD, Paris ........................................... 27 World Bank, 2009, Georgia Poverty Assessment, Washington, World Bank......................................... 27
This section of paper will present higher education and research funding situation analysis in Georgia, compliance of this situation with sustainable development of the desired model and recommendations to build closer ties with this model. Described hypothetical model in this document will be based on goals of higher education in Georgia declared at the national level and successful international practices.
2
1. Hypothetical model Higher education and research funding and management model for Georgia should be based on the following principles, which are derived from national higher education goals: •
Development of higher education and research should be included in priority areas of the state funding.
•
Higher education should be equally accessible to everyone, regardless of the starting conditions
•
Higher education and research should be integrated
•
Higher education and research institutions should have a high degree of autonomy in financial management
In addition to these basic principles, demographic, geographic and cultural characteristics should be considered during the development of a hypothetical model. Various aspects of funding and financial management of European and other developed countries are reviewed below, various indicators in the field of higher education and research are analyzed based on the principles described above, and optimal parameters are developed for the hypothetical model. Current situation and parameters are also considered in development of the hypothetical model. We believe that the model for Georgia should be based on experience of successful European educational systems. First of all the peculiarities of Georgia are closer to European countries; Historically Georgian educational system has a lot in common with system with the communist past; Participation in higher education in Georgia have traditionally been more or less close to the performance of European countries. It should also be noted that best examples for Georgia would be smaller countries. We think that the example of Estonia is especially important, as it is a small post-Soviet country that achieved considerable success in the development of higher education.
a. Amount and sources of funding higher education and research One of most important issue in analysis of higher education funding and financial management is the total amount of funding and the share of the state in this amount In this part we will consider the following parameters: •
Total state funding allocated for higher education and research.
•
Research funding amount
•
Comparison of state and private spending on higher education
Hypothetical parameters given in his model will be specified on medium term planning (2014-2017 years); Model specifications are conditional and can be changed. 3
Amount of state funding In most developed countries, state funding of higher education and research is a priority. In recent decades, state funding increased in parallel with the increased participation in higher education. Despite the global economic crisis, we can observe growth trend of financing in developed countries during last years, the first table shows the share of higher education and research expenses in the state budget and gross domestic product (GDP) 1 in developed countries. As the table shows, in 2010 higher education and research expenses from state budget of developed countries equaled 1.4 % of GDP and 3.1 % of the total budget (OECD 2009). We believe that medium-term funding for higher education and research should equal at least 1.2% of GDP and 3% of the state budget. 2 Table 1. State funding for higher education and research in higher education institutions
Countries
State budget %
GDP %
Chile
3.9
0.9
Czech Republic
2.2
1.0
Denmark
4.2
2.4
Estonia
3.0
1.2
Finland
3.9
2.2
France
2.3
1.3
South Korea
2.6
0.8
Netherlands
3.3
1.7
Poland
2.6
1.2
Slovakia
2.1
0.8
Slovenia
2.7
1.4
Spain
2.5
1.2
Sweden
3.9
2.0
United Kingdom
2.0
1.0
USA
3.3
1.4
Russia
2.5
1.0
OECD average
3.1
1.4
EU average
2.7
1.4
Georgia 1.8 Source: OECD. 2009; Ministry of Financeof Georgia; 2012
0.5
1
The tables display only the indicators of the selected states that may be interesting for some reasons. For the data of other countries, see annex 2 Here is meant the share of funding spent by universities. Further on this issue see the coming section.
4
It is impossible to separately discuss the state budget for higher education expanses without considering the private expenditures. Despite the fact that the majority of European countries, according to the policy document, should encourage the funding of higher education funding from private sources, the largest share of the costs of higher education funding in these countries comes from the state budget. For example in Scandinavian countries this number exceeds 90%. It should be noted that majority of the countries where the rate is lower than 70% are former communist bloc countries (Poland, Lithuania, Bulgaria, Latvia and Cyprus). However, none of the EU countries have the rate lower than 55%. As for other developed countries, in some countries this figure is much lower than in EU states, and rate of state funding is about one third or a quarter of expenses (United kingdom, USA, South Korea). The dynamics of the share of state expenditures in developed countries is also interesting. In the last 20 years, the share of the state expenses decreased by 10% in developed countries; if in 1995 the share was 78%, in 2010 it decreased to 68%. Particularly sharp decreased of this index was observed in the United Kingdom (from 80% to 25%). The downward trend of the state expenditures is particularly visible in nonEuropean countries, where tuition fee is traditionally high. In accordance, the growth of t he involvement in higher education leads to a disproportionate increase in private expenditures. In other countries the rate is stable or slightly changed. We think that considering Georgia’s population, social background and recognition of higher education as a national priority, also taking into account the current model of funding of higher education and university research, at least 50% of total funding must come from state budget. 3
Funding sources Countries significantly differ from each other depending on what source the funding of higher education and research comes from. When you speak about the sources of funding, main distinctions are between state funding, household/individual expenses and other private sources of funding. In order to evaluate how accessible higher education is, we need to see what share of financing households and individuals have to pay, and the social categories of the population who have to pay this tax. Countries differ significantly from each other in funding higher education expenses by households. As the table below shows, in majority of European countries this figure is very low. Costs incurred by households and individuals are traditionally higher in countries where the state spends relatively little on the higher education and research. For example, the rate is very high in Chile and the United Kingdom (70% and 56% respectively). The next section discusses how the total funding is distributed to the various sources of funding for higher education and research in Georgia. To make higher education funding more evenly distributed among the various sources, and do not burden the households and individuals, we believe that in mediumterm perspective their share of funding should not exceed 40% of total funding of universities.
3
See the section two for a detailed overview about the distribution of the share of funding of higher education and research between various sources and an argument about the recommendation.
5
In addition to the state budget funds and household expenses, quite large sums of money are spent from other private sources on higher education and research in developed countries. These sources mainly come from various businesses and banks. These additional sources of funding will be considered for presenting the hypothetical model of funding. It is desirable to allocate at least 10% of total funding from other sources. 4 Table 2. Higher education funding distributed according to the sources, 2010 State funding
Household expenditure
Other expenditures
Chile
22.1
70.1
7.8
Czech Republic
78.8
9.4
11.8
Denmark
95.0
4
1
Estonia
75.4
17.9
6.7
Finland
95.9
1
3.1
France
81.9
10.1
8.0
Korea
27.3
47.1
25.6
Netherlands
71.8
14.7
13.5
Poland
70.6
22.5
6.9
Portugal
69.0
23.4
7.6
Slovakia
70.2
11.8
18.0
Slovenia
84.7
10.6
4.7
Spain
78.2
17.6
4.2
Sweden
90.6
0
9.4
United Kingdom
25.2
56.1
18.7
USA
36.3
47.8
15.9
Russia
62.2
28.2
9.6
OECD average
68.4
-
EU average
77.3
-
-
Georgia
36
64
05
private
-
6
Source: OECD, 2009; Salmi and Andguladze, 2012.
4
5
We can discuss these parameters as a conditioinal assumption indicating on a desirable directin of development and change. The Georgian indicator is calculated based on the joint student database of 2009
b. Mechanisms of funding and financial management State funding recipient Europe and other developed countries differ from each other depending on by whome and how the the funds provided by the state for higher education and research are disposed. Typically, the sum may be granted to tree main direcitons: be transmitted directly to the institution of higher education, to other nongovernmental organization, or given to individuals and households. The amount of sum given to individuals and household, in turn may be divided in the form of grants and student loans. As the table below shows, the budget is distributed quite differently in different countries. In developed countries an average of 78% of funds is directly transferred to the property of the universities. In some countries, where the rate is lower (United Kingdom), the s tate will spend more on direct support mechanisms for students, as in such cases, the tuition fee is also more expensive. Direct deposit amounts to universities in Georgia are steadily declining in recent years. According to the 2013 budget plan, the rate is halved compared to the previous year and is less than 10% of total expenses. As we can see, in most developed countries the state student lending mechanism is developed, which is currently not working in Georgia. Table 4: The distribution of public funding allocated to higher education
Direct university funding
Scholarships/grants for households and students
Student loans
Funds given to other individuals
Chile
59.6
30.8
20.3
4.6
Czech Republic
97.4
2.6
0
0
Denmark
72.1
23.9
3.9
0
Estonia
86.8
4.7
8.5
0
Finland
84.8
14.9
0
0.3
France
92.3
10.5
0
0 7
Korea
91.5
6.4
4.8
0.3
Poland
87.8
11.7
0.4
0
Slovakia
77.1
19.3
1.2
2.4
Slovenia
76.6
23.4
0
0
Spain
90.6
11.2
0.3
0
Sweden
75.5
9.6
14.9
0
United Kingdom
32.3
0.3
33.5
33.9
USA
72.3
24.0
3.7
0
OECD average
78.3
14.5
9.8
2.0
Georgia
21
89
0
0
Source: OECD, 2011; Ministry of Finance of Georgia, 2012. It should be noted that a direct comparison of Georgia’s index to data from other countries is not justified. Georgia's funding mechanism is essentially different from the existing funding mechanisms in other countries. Voucher-type funding is the main and almost the only source of funding for higher education in Georgia. 4 In other countries, money transferred to students and their families are spent to help them (and not university funding). Comparing the volume of social grants in Georgia to other countries ’ assistance given to students and household might be more justified.
Mechanisms of state funding distribution Recently, the European countries are changing higher education institutional funding mechanis m, which is mainly reflected in the growing autonomy of state funding resources management and simplification of rules needed in allocation of funds. In order to receive public funding, two major rules apply in universities of Europe: block grants and funding consideration. The latter implies that the universities will be given amount of money for specific purposes, and therefore they have no right to use their own discretion to distribute the money. It should be noted that only a few countries have a mechanism for funding consideration (Greece, Czech Republic, Cyprus, Bulgaria, and Latvia). In the case of block-grants, certain amount of money will be given to the university directly, without specifying purposes. In the majority of European countries the block - grants are the main mechanism of funding, and the main internal structures of university decide how to allocate funding received from the state. Typically, the block-grants cover such expenses as staff salaries and ongoing expenses. In many countries the block-grants are also used for research expenses. It should be noted that in some countries
4
For more detailed information of the funding mechanisms in Georgia, see the next section.
8
block-grant disposal should be in accordance with scheme given in advance by Universities to state (Belgium, France, Lithuania, and Hungary). In different countries there are different models of allocation of the state -based higher education funding between various education institutions. Various states use different principle when deciding how to distribute the money to various institutions of higher education and how to transfer these funds between them. The most common funding distribution mechanism of funds is based on the funding formula. Almost all European countries use this formula (see Annex 1). The universities in most European countries receive direct state funding, and the amount of funding available depends on several parameters. Option, which is most commonly found in the funding formulas, is number of students registered at the university in previous year; depending on the training direction, different weight is given to this option. In some countries it is not crucial how many students were registered in the previous year, but it is crucial how many students can a university receive according to agreement between the state university officials (Estonia, Latvia and Finland). In certain countries the funding formulas also include other components, such as a university building maintenance costs (France, Finland), location (United Kingdom), the number of personal (Greece, France, Poland, Portugal). Lately in Europe more and more popular is to include a new component in the formula - performance / progress indicator. About half of the EU member states are already using the progress indicator to determine the amount of funding for the university. In this way, the states want to ensure that funding be dependent not only resources, but also on the product. Key component of this parameter are student progress indicators, such as university completion rate, number of credits earned, etc. Some countries also use indicators of academic staff qualification (Poland, Portugal, and Romania), the institution's official assessment results (Greece, Lithuania, and Portugal). For more information, see Annex 2. In addition to funding formulas, there may be other principles for universities funding. This can be negotiation between the state and the university, funding for specific research projects, etc. Because Georgia’s higher education funding system is significantly different from the European one, it is difficult to imagine a hypothetical model in which the goals of higher education will be matched, principles of equal access and equality will be achieved and at the same time will not be different from the current funding system. We believe that in the medium term perspective, an optimal solution for Georgia will be the modification of current model in a way to maintain the voucher funding element, but at the same time introduce mechanism of block-grant funding in universities through the funding formula. So it will be possible for universities to develop competitive and s table environment. Also, university research funding mechanism should be introduced through block-grants, amount of which will be based on the performance indicators. In the long run, we think that most acceptable model of higher education and university research funding is a block-grant system.
9
Tuition fees and student support mechanisms When we discuss the issue of accessibility to higher education, we should have two key parameters in mind: tuition fees and student support mechanisms. Developed countries are significantly different from each other in both of these parameters. In certain countries, students in higher education institutions are free from tuition fees. Tuition fees are also very different by disciplines. In general, tuition fees and the establishment of appropriate mechanisms in order to help students pay these fees is one of the most important issues in higher education policy. On the one hand, to increase quality it is important to provide university with appropriate expensive technical resources and highly qualified professionals, and to do so and find necessary financial resources for it, increase of tuition fees is an attractive opportunity. But, on the other hand, it is required to provide equal access for socially vulnerable and low-income students regardless of what kind of starting conditions they have. In this regard, the developed countries' systems are very different from each other. For example, the Scandinavian countries, where the tax system is progressive, higher education students do not pay the tuition fees. In USA, Korea and Chile the average tuition fee per year is more than USD 5000. In European countries tuition fees exceed USD 1500 only in UK, Netherlands and the Slovak republic. In Georgia tuition fees for both public and private institutions is quite high compared to developed countries. In recent years, public universities have increased tuition fees and in 2012 the maximum cost was GEL 2250, which is 39% of national GDP per capita. This figure is even higher in private schools and equals average of 73%. As the table shows, Georgia belongs to the group of countries with highest tuition fees. Table 5: The average cost of higher education (nominal and per capital GDP %) Country
Public institution
State supported private institution
Independent private institution
Australia
4140
11.60%
X5
8933
Netherlands
1851
4.40%
X
-
United kingdom
X
USA
6312
13.30%
X
New Zealand
3019
11.10%
4159
15.40%
-
Austria
853
2.10%
853
2.10%
235-11735
5
4840
12.90%
25.10%
22852
48.35
0.6%-29.5%
X - indicates that the parameter is not recorded in the country - the lack of data
10
Norway
0
0
5641
9.40%
Island
0
2311-6831
7.5%-22.1%
8433-12650
27.3%40.9%
Belgium
599
1.60%
683
1.80%
-
France
190-1309
0.6-3.8%
1127-8339
3.3%-24.1%
1128-8339
Ireland
2.800-10000
7.5%-27%
X
-
Italy
1281
3.90%
X
4713
14.40%
Mexico
0
X
5365
37.00%
Poland
0
X
1889-2537
10.7%14.3%
Portugal
1233
5.10%
4991
Slovak republic
M2707
11.90%
X
-
Spain
1038
3.20%
X
-
Switzerland
879
2.05
-
7262
16.90%
Japan
4602
13.20%
X
7247
20.85
Korea
5315
19.60%
X
9586
35.40%
Kazakhstan*
2759
32.70%
1000 - 10000 27 %-271%
Georgia
1333
41.50%
1212 - 6424
20.70%
3.3%-24.15
-
37%-200%
Source OECD 2009; National Examinations Center, 2011 If we compare the figures from 4th and 5th table, we can see a trend that in countries where a large part of the budget is allocated for students and households, tuition fees are higher. In countries where a big part of state funding goes to universities, the price is low, or almost none. This is natural; because of high cost of tuition, the state undertakes to directly help students and their families. Depending what attitude the country has towards financing higher education, which student aid system works in it and how much the tuition fee is, it is possible to separate the funding in four models: 1-st model
2-nd model
3-rd model
4-th model
Tuition fee
Low
High
High
Low
Student aid system
Strong
Strong
Weak
Weak
Involvement
High, 75%
High, 76%
Low, average
Average
Liberal
Liberal
Corporate, mixed
Liberal
Liberal
Mixed
Funding from other Low private sources Social system
Social oriented
Tax system
Progressive
High equality
11
Countries
North countries
European USA, Netherlands, United Kingdome
Chile, Japan, Korea
Other countries
European
Source: OECD, 2009 (Adapted) In recent years particularly notable was the move of United Kingdom and the Netherlands from the second to the fourth model. In these countries tuition fee in universities has increased significantly compared to previous years, but at the same time support systems for students went into practice. Also in these countries, large share of higher education funding comes from other private sources (businesses, corporations, etc.). Georgia is currently close to the third model of funding - tuition fees are too high, but there are no strong student support mechanisms, which leads to accessibility problems for socially vulnerable people. Countries that have this model, like Georgia, are characterized by the distribution of funding based on meritocracy. Hypothetical model desired for Georgia in medium term perspective is closer to the second model, which includes high tuition fees and a strong support system for students. However, even in this case, like in other countries with this model, the average tuition fe e in public universities should not exceed 20% of GDP per capita. The second essential component of the mechanism is strengthening student aid. Since the current voucher system is a way for indirect funding of universities, rather than a tool for student aid. Social grants should be strengthened so that state should pay tuition fees for all socially disadvantaged citizens, who will be able to satisfy the requirements for admission to universities.
2. Situatioin in Georgia a. amount and sources of funding Amount of Funding of higher education in Georgia After an unprecedented economic downturn in the first half of 90s, a rapid economic growth was observed from the begining of 2000s. Along with economic growth, expenditures in the national budget increased too. The expenditure from state budget is similar with developed countries average figure. Nevertheless, the share of education spending in GDP, as well as the state budget, is stably low year after year compared to other countries. On this basis we can conclude that, the state funding of education increased less compared to other priorities. The table below shows the dynamic of the different priority areas for funding since 2006. Table: The dynamics of the priority areas for funding 2006
2007
2008
2009
2010
2011
12
17,1 Expenditure on genera l public services
12,3
21,1
22,9
28,3
27,4
Social security 17,9
16,1
17,8
21,1
19,6
20,8
Economics
13,9
11,1
8,9
12,9
12,4
12,3
Internal security and order
12,5
14,2
15,3
13,6
12,1
12,0
Defense
20,3
31,0
24,0
13,7
10,1
9,9
Education
9,9
7,9
6,5
7,9
8,4
8,3
Healthcare
5,9
4,9
4,4
5,4
6,5
6,4
Culture, sports, religion
2,1
2,0
1,6
1,8
1,8
1,6
Environment
0,6
0,6
0,3
0,4
0,3
0,3
Source: Ministry of Finance of Georgia, 2008, 2009, 2010, 2011, 2012, 2013 With regard to the higher education and research, the following table shows the dynamics of funding in these areas over the past years. It seems that the share of the total funding has increased slightly, but in recent years it has decreased. Especially a sharp decline was in research funding - compared to 2011 in 2005 its share in GDP has decreased twice. Table: The dynamics of state funding for higher education and research 2005
2006
2007
2008
2009
2010
2011
GDP
11621000
13789900
16998600
19736700
17986000
20743400
24344000
Higher education funding
21702.7
33510
39690.1
47154.7
62967.6
61,731.9
60880.9
Research funding
20117.7
17361.2
22136.4
31495
27790.2
28,428.9
20,442.30
Total
41820.4
50871.2
61826.5
78649.7
90757.8
90160.8
81323.2
Higher Education Funding % of GDP
0.19%
0.24%
0.23%
0.24%
0.35%
0.30%
0.25%
Research funding % of GDP
0.17%
0.13%
0.13%
0.16%
0.15%
0.14%
0.08%
13
Share of 0.36% 0.37% 0.36% 0.40% 0.51% 0.44% total funding in GDP Source: Ministry of Finance of Georgia, 2008, 2009, 2010, 2011, 2012, 2013
0.33%
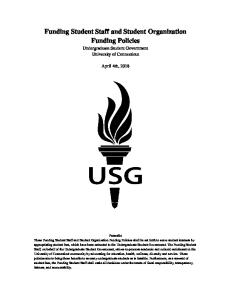
Sources of funding Georgia's share of households in higher education funding, as can be seen from Table 2, is currently very high. In Georgia, as in the post-Soviet countries there has been an unprecedented privatization of higher education costs. The share of private expenditures is high, both in private and state universities. As the graph below shows, in the post-Soviet countries the overwhelming majority of students in both public and private universities pay tuition fee. 64% of the total students pay full cost of education, out of which 49% are in state higher education institutions, while 15% - in private universities. However, considering the fact that about 25% of students pay part of tuition fees in Georgia, the country has one of highest scores in number of students who pay tuition fees, even between former Soviet countries.
Source: CIS statistical database
b. Mechanisms of funding universities and research in Georgia Mechanisms of funding distribution In 2004, higher education institutions funding system has changed substantially in Georgia, which meant, first of all, the replacement of direct funding to student-tied funding. The purpose of the amendments was to change the system of students’ admission, eradication of corruption in process of distribution and management of funds for institutions of higher education from state (World Bank, 2006). The state gradually minimized the direct funding of higher education institutions, and has almost completely replaced it with the financial support of students. Although there are some similarities with the system of financing in European countries, where number of students in universitis is a main component of funding formula, the funding mechanism is still very different. First of all, the money from state to 14
student covers only to the so-called teaching fee. In addition, the state funds not by the number of students, but by the number of students successful on the national examinations. The rest of students ha ve to pay a tuition fee (for details see the next section). Trends in funding of higher education in Georgia are very much like the rest of the post -Soviet and post-communist countries trend. As in other countries, in 90s government-subsidized higher education has changed, and privatization started. This occurred in two main ways: the opening of private universities and by adding so-called "Paid" seats in public institutions of higher education. These changes were implemented as a result of increased demand for higher education in the conditions of a free market economy. As a result of the reforms carried out in Georgia in 2004 -2005, the privatization process for higher education costs, was further deepened and the higher education became one of the lea st dependent on the state funding, in region and in world. The lack of state funding could have extremely negative consequences concerning the quality and availability. Lack of funding prevents universities from improving the quality; current scarce reso urces are going forward to personal salaries and current expenses. As for availability, as the analysis above shows, the burden of financing higher education in Georgia is on private individuals - students and their families . Under current system of student funding, as the analysis shows, the state is most likely funding students who are already financially ensured. Another novelty of higher education funding system reforms carried out in 2004-2005, was involving private institutions in the system. Students who are enrolling in private institutions and are successful in the exams are receiving state grants too. The current system of funding for higher education has certain strengths and disadvantages. Strong side of current system is that it was effective alternative to opaque system when it was developed. The fact that private universities have been granted an opportunity to receive public funding, can also be regarded as somewhat positive change. Most importantly, the main driving force of change was the desire to increase competition between higher education institutions in accordance with the quality (World Bank, 2006). However, in reality this type of financing has many negative sides. First of all, the lack of funds allocated from the state budget for higher education funding is somewhat explained by the existence of this exclusive model - because the state grant covers tuition costs, increase in funding will also result in an increase in tuition fees. In addition, such a mechanism leads to delivery o f the programmes for which there is a demand, and conversely, a decrease of less prestigious programmes from higher education institutions . In many cases, these less prestigious programmes are more expensive. As a result of the changes introduced in the 2011-2012 academic year (see the next section in detail) the degree of this problem is somewhat reduced, although it remains a significant issue. The third problem that is created by existing funding mechanism is that private higher education institutions are in relatively privileged position. As the table below shows, the share of students with state grants in the total quantity in private institutions is about the same as in public higher education institutions. Respectively proportionately to the number of students, they receive about the same amount of funding from state. In case of the state budget cuts and abolition of the state education funding, a state grant is the only way of getting funding. In addition, as the private universities can set any amount of tuition fee, unlike the public universities, their joint income is significantly higher than that of public institutions. 15
Similar trends have been observed in the research funding system. If before the reform, state funding for a variety of educational and scientific institutions for research activities was given directly to institution based on its past experience, after the reform, the state funding for scientific research is almost exclusively based on the grant competition. The following diagram s hows the dynamics of higher education and research funding mechanisms from 2005 until 2013. It is obvious that direct funding of institutions steadily decreases, and at the same time, individual funding is steadily increasing. Figure: Dynamics of Higher Education and Research Funding in Georgia in 2005 - 2013
Source: Ministry of Finance of Georgia, 2007. 2008, 2009, 2010, 2011, 2012, 2013 In conditions when universities lack funding, the only way for conducing university research is to obtain research grants. Only way to get state funding for research is to participate in the National Science Foundation's (legal entity of public law of Ministry of Education and Science) grant competition. Grant competitions are conducted by National Science Foundation in centralized way through an independent scientific council, and therefore, it is possible to ensure transparency and fairness. However, negative side of exclusively centralized funding of research through grant competitions is that universities and research institutions need to adapt their own research interests.
Mechanisms of students aid in Georgia Major financing mechanism in Georgia is a student targeting funding. The largest share of the grant will be awarded based on the meritocracy, depending on scores of national exams. Students earn funding depending on their scores in exams which could be 100, 70, 50 or 30% of maximum established tuition fee in the public institutions of higher education. The main aim of the introduction of the Unified National Examinations in 2005 was the elimination of corrupt practices in receiving and distributing state funding. Corrupt practices are eliminated, but the second question is, how socially fairly is the poor state funding for higher education distributed. The next section analyzes the socio-economic and demographic characteristics of the grantees. As for funding on the basis of social need, according to the Law on Higher Education, total of 6 - to 10% - of the scholarships has been allocated on this matter. This funding is open to the children who lost parents in the war, students living in the occupied territories, in the mountainous and ecological migration 16
areas, etc. It should be noted that the number of students in each of these categories are allocated according to the resolution, if contestants numbers are more than number of seats, funding is based on the meritocratic basis. For 2012-2013 academic year, 488 student seats are allocated for partial or full funding, and GEL 1,118, 208 is allocated from the state budget. It should be noted that there are only 20 of these 488 students, who are registered in the database of socially vulnerable families and their rating score is equal to 70,000, or less. As the table below shows, only a very small number of students have access to educational grants, and the number of students funded on basis of social need is particularly low. Table: Distribution of students according to the type of university and amount of funding in 2011 academic year Public education institutions
Private institutions
Total
Quantity
%%
Quantity
%
Quantity
%
37,490
62
11,285
70
46,796
62
30%
8,116
13
1,631
10
9,747
13
50%
4,744
8
992
6
5,736
8
70%
3,123
5
721
4
3,844
5
100%
5,738
9
1,448
9
7,186
9
Total meritocratic grants
21,721
35
4,792
29
26,513
34
Students which pay fees Meritocratic grants
Social needs-based from total 30%
204
38
242
50%
242
12
254
70%
426
29
455
100%
1556
3
164
1
Total number of students
60,468
100
16,191
100.0 75,363
1720
2 100
Source: data from National Center for Educational Quality Enhancement, 2010. 17
Before 2011-2012 academic year grant was awarded only by scores earned on the National exam (excluding social grants). Now, a new option - discipline has been added to funding mechanism. Those applicants who apply for the Law, Healthcare, Business (other than tourism), Mass Communication / Journalism, International Relations and Public Administration directions, can get only 100% - grant. If on National exams they have received score not enough for 100% grant, they do not get funding. Such a change in funding mechanism was caused by the fact that the number of applicants was very high in these disciplines, and majority of grant recipients were on this disciplines, as the table below shows. In areas that the government announced as priority, number of students who applied was small, and little number of students received grants (agriculture, engineering and construction). Table: Distribution of students according to academic disciplines Grantees Discipline
Total number of students
Quantity
%
Quantity
%
Education
104
0.4
1686
2.5
Service Industry
307
1.2
1098
1.6
Agriculture
378
1.5
3410
5.0
Engineering, construction, manufacturing
1454
5.8
7908
11.6
Science
2587
10.4
6764
9.9
Medicine and Health Care
2730
10.9
10809
15.9
Arts and Humanities
2819
11.3
10113
14.8
Social sciences, business and law
14571
58.4
26321
38.6
4376
14.9
7254
9.6
Total
24950
100
68109
100.0
Total
29326
--
75363
--
Source: data from National Center for Educational Quality Enhancement, 2010.
Who studies and who receives funding As noted above, the admission of students to higher educational institutions, as well as the distribution of funding, is mainly based on meritocracy. Unfortunately, the national examinations database does not contain any information on the socio-economic status of students and their families. Consequently, it is impossible to analyze the distribution of funding by these parameters. However, w e can see how the funding is distributed according to the students' place of origin. As a national examination results analysis shows the highest scores in exams are received by entrants from Tbilisi, followed by residents of other big cities, residents of small towns and villages are at the end. Funding is distributed according to these scores. As the chart below shows, 73% of students living in rural areas and small towns pay full tuition fees, while this figure is 60% for students from Tbilisi. Table: Distribution of students by place of residence
18
Student's place of residence
Tbilisi
Other big cities
Small cities Total sand rural country areas
Grantees
40%
32%
27%
33%
Including a 100% grant
(6%)
(4%)
(4%)
(5%)
70% grant
(7%)
(5%)
(4%)
(6%)
50% grant
(10%)
(9%)
(6%)
(8%)
30% grant
(17%)
(14%)
(13%)
(14%)
60%
67%
73%
67%
Full students
tuition
fee
paying
in
Source: data from National Center for Educational Quality Enhancement, 2010.
It is also possible to analyze the representatives of which social and economic background are involved in higher education. In general, we have observed the changing trends of participation in higher education in Georgia. After the collapse of the Soviet Union, almost in all post-Soviet countries the involvement in higher education has been increasing. This was due to the establishment of new institutions , creating new and more diversified educational programmes, meeting the growing demand. This growing trend in Georgia stopped and started to decline after many of the new school closed, the quality of which has come into question, and the adoption of the new funding system. Currently in Georgia, only about 25% of the relevant age group is involved in higher education. The household data analysis shows that in terms of engagement are very different from each other in different population groups. Engagement indicator is closely linked with the economic conditions of the family, region, place of residence and e thnic ascription. Table: Distribution of young people involved in higher education, according to the various social groups. Subgroup
The involvement of the relevant age group
The poorest
9.3
2 nd Quintile
14.2
3 rd Quintile
20.3
4 th Quintile
28.1
The richest
37.7
City
33.2
19
Village
9.3
Kakheti
12.3
Tbilisi
41.9
Shida Kartli
11.9
Kvemo Kartli
13.8
Samckhe Javakheti
9.9
Adjara
10.4
Guria
7.2
Samegrelo
14.7
Imereti
17.2
Mckheta-Mtianeti
15.1
Georgian
23.6
Azerbaijan
2.8
Armenian
16.5
Other ethnic groups
17.5
Total
21.7
Source: Salmi and Andguladze, 2012 These data are particularly interesting in view of the fact that index of inequality of Georgia is one of highest across the region. After the collapse of the Soviet Union, economic inequality has increased in all countries, however as seen in the diagram below, this figure fell in the later stage of the transition period. Georgia, along with Russia, is one of the rare exceptions where the inequality ratio is increasing. Diagram: Economic inequality index (Gini coefficient) dynamics in Georgia and other countries of region
20
Source: World Bank, 2013
3. Recommendations As the analysis in the previous section shows Georgia's higher education and research funding principles and practices are not compatible with the declared national objectives in higher education and country long-term development strategy. In particular, •
In spite of the higher education and research is declared as national priority, funding for these areas is not sufficient to ensure their long-term development, and creation of region and world competitive product.
•
Current mechanism of state funding for higher education and research creates an unstable environment for higher education institutions.
•
Existing mechanism of state funding for higher education puts public education institutions in disadvantaged position compared to private institutions.
•
For now sources of funding for higher education and research, as well as the forms, are not properly diversified in order to ensure the quality and availability.
•
Despite the fact that the equal access to higher education is a national goal, the analysis shows a significant difference in the level of engagement between different social and economic groups. Moreover, despite the absence of relevant data, we can assume that most of the state funding is granted for students who come from relatively wealthy families; the economically and socially less privileged students and their families have to finance their own education.
Thus, the current model of higher education and research funding could be hindering the development of quality as well as prevent equal access. The following recommendations are based on desired higher education and research development model, as well as the current situation. As mentioned in the first part, a quantitative index can be 21
conditional. The quantitative parameters are instruments for identifying potential changes directions in model of higher education and research funding.
Higher education and research funding models Based on the fact that the European models of higher education and research funding and the systems of financial management are fundamentally different from ours, in the long run radical changes will be necessary to reach the desired hypothetical model. Below we represent two models for reforming higher education and research funding. The first model takes into account refinement of funding model for elimination of above-mentioned problems in short and medium terms. The quantitative parameters have been developed in accordance with the Government's medium-term economic growth forecasts. Second, the long-term model is an ideal hypothetical model of higher education and research funding, implementation of which requires complex changes in the education sector.
First (short and middle length) model of funding This model does not encompass to fundamentally change the existing mechanism of funding, and therefore we believe that its implementation in short and medium term is realistic. But at the same time it provides the necessary changes for achieving national objectives in the field of education and research in terms of current mechanism. In particular, it is aimed at: •
Creating competitive but at same time financially stable environment for universities
•
Increase the competitiveness of public universities
•
Increasing access to higher education
•
The development of university research
To summarize, the following changes should be made to achieve these goals: •
Increase the total amount of funding
•
Amplification / enactment of direct funding of public higher education institutions
•
Block-grant funding system for research
•
Increasing the volume of social grants
•
Implementing a system of long-term student loans
Amount of funding As mentioned in the previous sections, higher education and research funding allocations for a share of GDP and total government budget in Georgia compared to the developed countries is much less. Situation is compared to the Western European countries and the former communist bloc countries, as well as other developed countries. We believe that for improving the quality of the area as well as improving the access 22
to the resources, government needs to invest more in it. The following table shows how state funding could be increased for higher education and research contributions over the next three years compared to the expected performance of GDP. As noted in the first section, in the short and medium term, we can take conditionally an optimal indicator of GDP - 1.2%.
Mechanism of direct funding for public higher education institutions This mechanism is aimed to somewhat compensate unpleasant situation of public high education institutions compared to private universities. Together with the scholarships, also block -grants should be assigned from the state budget for public higher education institutions, the amount of which will be calculated based on the formula. Following components can be included in the formula in accordance to the experience of European countries: 1. Resources a. Numbers of seats in different programmes (again weighted according to the disciplines) b. The number of personnel 2. Results a.
Academic staff qualification
b.
The quality of academic programmes and teaching
Public universities will be able to use direct funding at their own discretion, as it happens in European countries while assuming block-grants.
Assessment and analyses of existing funding mechanisms In short-term perspective it is necessary to assess individual components of the mechanisms of funding and financial management. Since the medium term model includes both preservation of the voucher system, as well as implementation of the block-grant system to public universities, two different formulas are needed: •
Tuition fee / voucher amount. Currently there are no set rules for calculating tuition for public higher education institutions. Therefore it is necessary to develop the components in the near future, based on which voucher amount is determined for undergraduate and master's students in a variety of directions.
•
Block-grant funding formula. Above is given a list of optional components, which can contain a formula. As well as a more detailed list is given in the Annex, about how the formula is calculated in various European countries. It is necessary to accurately determine the parameters university direct funding is based onand what is the formula weight of each of these settings.
23
In addition, it is necessary to assess the current priorities for the funding mechanism. It should be assessed in two main angles: 1. how to attract applicants; 2. what is the connection to the labour market in medium and long term. According to the results of the assessment the shape of the priority areas for funding may change.
Block-Grant system for research In European countries, universities are eligible to receive funding to finance research from the state in two different ways: in form of direct block-grants, when the University spends finances with its own views and on a competitive basis of specific research projects. Since in Georgia only the latter one operates, universities often have very limited resources to carry out independent research. In accordance to the short and medium term, we need to implement a new separate block-grant mechanism for the research. Both public and private universities should be able to get research block-grant. The amount of research block-grants for universities, based on the experience of European countries, should be based on the following parameters: 1. Resources a. The number of doctoral students b. The number of research projects (weighted according to the survey profile) c. The number of academic staff working on research projects 2. Indicators of outcomes a. The number of academic publications b. The number of doctoral dissertations defended c. Amount of funding from other sources (public grant competitions and private sources) d. Participation in international scientific research projects Again, the block-grant formula of funding research should be designed, which may include the above components (or several of them), which will be given appropriate weight formula. Funding of university research by block-grant formula will increase independence level of universities, as well as promote healthy competition between the various universities and in accordance with the progress in research.
Mechanisms of students aid As described in the previous chapter, the main source of funding for higher education and research in Georgia is the state and households. At the same time, the share of households excess state's share of funding for higher education in particular, as well as the same rate in the developed countries and the other countries of our region. Taking into account the level of economic inequality in the country, higher education funding obligation is a heavy burden for low-income families. In accordance with medium term, it is important to strengthen students’ aid mechanism, and to reduce the share of the total e xpenses of the household in higher education. In the table below, from hypothetical model with optional parameters, is 24
showed how you can arrange financing for households and institutions of higher education more fairly next three years. According to this model, the share of households in amount of funds allocated for higher education is diminishing over the years, although nominally it does not change. At the same time, it is necessary to increase the number of social grants. If in the future with increa sed education grants, 20% of the total amount will be spent on social grants, the number of current recipients of social grants compared to current time will increase about 7 times. It is also important that the great majority of social grants to be giv en to the families with lowincome / beyond poverty line, and to be issued lesser to other social categories. The part of increased government funding should be directed to establishing mechanism of longterm low-interest loans for students. This mechanism is well performing in Europe and in many developed countries; it is desirable that it also starts running in Georgia. Table: the approximate distribution of financing of higher education and research in mid -term perspective in case of the 1 st model.
2012
2013
2014
2015
2016
2017
GDP Per capita
3,519.60
3,864.30
4,199.50
4,541.80
4,911.90
5,312.20
Nominal GDP
26,138,900
28,677,000
31,164,700
33,704,700
36,451,600
39,422,400
Amount spent on higher education 116126.2 and research
116832
325000
365000
400000
450000
% in GDP
0.44
0.40
1.043
1.083
1.097
1.141
The average tuition fee
2000
2000
2000
2000
2000
2000
% in per capita GDP
56.33
51.34
47.62
44.04
40.72
37.65
The amount of funds allocated for 67543.2 educational grants
70600
150000
150000
150000
150000
Among which social grants
4900
45000.00
45000.00
45000.00
45000.00
7.00
30.00
30.00
30.00
30.00
The number of students receiving 2300 social grants
2400
22000
22000
22000
22000
Direct funding of universities
20789.9
10500
50000
70000
80000
80000
Research Funding
27793.1
35732
70000
85000
100000
120000
Among them block - grants
0
0
30000
35000
45000
60000
The share of research funding in higher education and research costs
23.93
30.58
21.54
23.29
25.00
26.67
Research funding share in GDP
0.11
0.12
0.22
0.25
0.27
0.30
The share of social educational grants
grants
4700 in 7.00
25
Student Loans
0
The amounts spent by households
130000
The share spent by households in the 59.54 total expenses amount
0
65000
70000
80000
90000
130000
130000
130000
130000
39.39
37.14
36.11
36.11
Second (long-term) model of funding According to this model, following radical changes should be implemented: •
To transform university funding system as a whole in block-grant funding system. Total state funding for universities should be handed directly to public ins titutions.
•
Block-grants to be issued to cover basic expenses, such as tuition costs (staff salaries) and ongoing costs.
•
Block-grants to be issued for the university research projects. Private higher educational institutions will be able to receive these types of block-grants.
•
Block-grants, like in European countries, should be granted based on a formula. The formula should consist of resource indicators, as well as the result indicators.
•
In addition to the grants based on a formula, the state can transfer funds to public universities based on negotiations on specific cases, if it comes to national strategic goals.
•
Universities have the right to dispose of the funds received from the state at their discretion
•
Private universities (profit, as well as non-profit) will be able to receive public funding in certain circumstances. This may be a funding in case when priority for the state and the academic programmes are economically beneficial in the long run, less prestigious and academically relevant programmes, teacher training programmes, adult education programmes.
•
Rules should be developed for tuition taxing by institutions for higher education
•
Based on the agreement with the state, public higher education institutions should ensure number of so called “free” seats, which students will be able to get based on both - academic merit and social needs.
•
There should be a powerful mechanism for social support of students. Funding issued to students and households should be socially orientated. These funds ma y be issued in the form of grants to cover tuition fees, as well as some additional expenses
•
There should be a long-term low-interest student loans system. Loans should be given based on a social necessity, as well as on meritocracy.
26
Bibliography:
Ministry of Finances of Georgia (2008) Georgian State Budget Ministry of Finances of Georgia (2009) Georgian State Budget Ministry of Finances of Georgia (2010) Georgian State Budget Ministry of Finances of Georgia (2011) Georgian State Budget Ministry of Finances of Georgia (2012) Georgian State Budget Ministry of Finances of Georgia (2013) Georgian State Budget Law of Georgia on Higher Education Centre for the Study of Higher Education Management (CEGES). Rates of return and funding models in Europe. Final report to the Directorate-General for Education and Culture of the European Commission. Valencia: CEGES, 2007. - 141 p. Chevaillier, Thierry; Eicher, J. Cl. Higher Education Funding: A Decade of Changes. In: Higher Education in Europe , 2002, Vol. 17, No. 1-2, 2002. - pp. 89-99. Estermann T, Nokkala T. & Steinel M (2011) University Autonomy in Europe II the scorecard. The European University Association European Commission (2008); Higher Education Governance in Europe Policies, structures, funding and academic staff OECD, (2013), Education at a Glance: OECD Indicators 2013, OECD, Paris. OECD (2007) Strehl, F.; Reisinger, S.; Kalatschan, M. Funding Systems and their Effects on Higher Education Systems. - Paris: OECD Publishing. - OECD Education Working Papers, No. 6. Salmi, J.&Andguladze, N. (2012). Tertiary Education Governance and Financing in Georgia. Policy note, World Bank. World Bank, 2009, Georgia Poverty Assessment, Washington, World Bank.
27