IEEE TRANSACTIONS ON MAGNETICS, VOL. 40, NO. 2, MARCH 2004
A Dynamic Core Loss Model for Soft Ferromagnetic and Power Ferrite Materials in Transient Finite Element Analysis D. Lin, P. Zhou, W. N. Fu, Z. Badics, and Z. J. Cendes
Abstract—A dynamic core loss model is proposed to estimate core loss in both soft ferromagnetic and power ferrite materials with arbitrary flux waveforms. The required parameters are the standard core loss coefficients that are either directly provided by manufacturers or extracted from the loss curve associated with sinusoidal excitation. The model is applied to calculating core loss in both two-dimensional and three-dimensional transient finite element analysis, and the results are compared with measured data. Index Terms—Core loss, finite element analysis, hysteresis, minor loop, power ferrite, soft ferromagnetic, transient.
I. INTRODUCTION
I
T IS STILL challenging to predict core loss under transient conditions in the design of magnetic power devices such as inductors, transformers, and electric machines. While approaches exist for loss computation in power devices in the frequency domain, an appropriate method for core loss computation in the time domain remains unclear. In the frequency domain, loss separation is widely used with problems involving magnetic laminations. Loss separation breaks the total core loss into static hysteresis loss , classical [1] eddy current loss , and excess loss
(1) , and the parameter , the total Given the coefficients core loss per unit volume in the frequency domain can be and frecalculated in terms of peak magnetic flux density quency . When this approach is applied to the time domain, the computation of the eddy current loss and the excess loss is straightforward. However, the computation of hysteresis loss is still difficult. With ferrite materials, a well-known empirical approach proposed by Steinmetz a century ago is normally used
order to estimate the power loss with nonsinusoidal excitation, a modified Steinmetz equation (MSE) was developed [3] (3) where is the equivalent frequency of the nonsinusoidal induction waveform, and is the repeated frequency. With the introduction of an equivalent frequency, MSE provides a good fit to experimental measurements under triangular magnetization [3]. However, MSE is only suitable in the frequency domain. Many time-domain hysteresis models have been proposed for instantaneous loss calculation. These are mainly based on the Jiles–Atherton model [4], [5] or the Preisach model [6]. Although these models describe hysteresis phenomena quite well, their practical use is limited by the high number of empirical parameters and/or the prohibitive experimental effort required [3]. In this paper, an alternative time domain dynamic hysteresis model is developed for soft magnetic and power ferrite materials based on the idea of an equivalent elliptical loop. This model is able to consider the effects of minor loops and predicts instantaneous hysteresis loss with good accuracy. In addition, the required parameters in the model are the same as those required in the frequency domain approaches (1) and (2). These parameters are either directly available from manufacturers or can be easily extracted from standard loss curves under sinusoidal excitation. II. FORMULATIONS A typical value of hysteresis loss parameter in (1) is 2. In in a static hysteresis loop can this case, the magnetic field be decomposed into two components: a reversible component and an irreversible component . As a result, hysteresis loss can be computed by
(2)
(4)
, and are empirical parameters obtained from where experimental measurement under sinusoidal excitation [2]. In
The reversible component can be directly obtained from the curve without considering a hysteresis loop. In normal fact, is related to the reactive power in the material and is associated with the hysteresis loss. Consequently, the instantaneous hysteresis loss is
Manuscript received July 1, 2003. The authors are with Ansoft Corporation, Pittsburgh, PA 15219 USA (e-mail: [email protected]). Digital Object Identifier 10.1109/TMAG.2004.825025
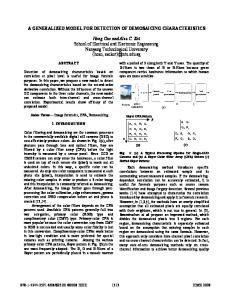
Fig. 2. Triangular magnetization with varying repeat frequency ( 200 mT and 20 kHz).
T =
For the more general case of
2 in (1), (9) is extended to (13)
Fig. 1. Equivalent elliptical loop (EEL) having the same area as the original hysteresis loop.
where
takes the same sign as
and (14)
Equation (5) indicates that the key to computing is the pro. Fig. 1 defines an equivalent elliptical cedure used to obtain is evaluated by tracing an elliptical loop (EEL) in which loop having the same area as that of the original hysteresis loop. The ellipse in Fig. 1 can be described as (6) where is directly obtained from a historical record of the flux density and is determined by requiring that the core loss calculated in the time domain must be the same as that obtained in the frequency domain under the same sinusoidal excitation. From (4) and (6), the time-average hysteresis loss with sinusoidal excitation is
when 2. As expected, (13) becomes (9) with To obtain from the history record of stored elliptical loops, two rules are applied. One is the wiping-out rule: all ellipses inside the current ellipse are wiped out. The other rule is that if a smaller ellipse (minor loop) is created, the current ellipse is pushed into the recorded ellipse list and the new ellipse is taken as the current ellipse. In the same way, based on the Steinmetz equation (2), the core loss for ferrite material in the time domain is derived as (15) where (16)
(7) Let (7) be equal to the frequency domain solution of . Then, one obtains (8)
(17) 1 has the measure of the magnetic field , and When (15) becomes (5). In this case, only the hysteresis loss compo. nent is considered and becomes III. VALIDATION
Thus (9) With a similar procedure, the eddy current loss and excess loss in the time domain can be expressed as, respectively (10) and
To validate the proposed model, measured data for 3C85 fer1.3 2.55, rite are used from [5]. The parameters 12 are quoted from [7]. The computed results are and first compared with the measured data under various triangular magnetizations. Thereafter, the proposed model is validated by comparing the computed results to the analytical results when 1.5. A. Triangular Magnetization With Varying Repeat Frequency
(11) 8.763 363 is from the numerical integration of (12)
The triangular waveform of magnetizing flux density in Fig. 2 is applied for the measurement, where the repeat frequency varies from 2 to 20 kHz while the triangular magnetization cycle remains constant. Fig. 3 shows the comparison between the computed average core loss based on (13) and the measured data. It can be seen that they match quite well.
1320
IEEE TRANSACTIONS ON MAGNETICS, VOL. 40, NO. 2, MARCH 2004
Fig. 3. Comparison between calculation and measurement for triangular 1.3; 2.55, and magnetization with varying repeat frequency ( C 12).
=
=
=
Fig. 6. Comparison of analytical results with the predictions of EEL and MSE for triangular magnetization with varying duty cycle.
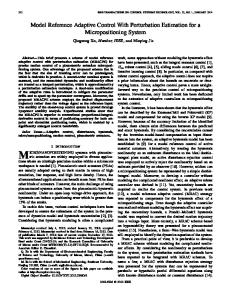
Fig. 7. Computed instantaneous core loss of a 250-kVA three-phase 19.16; 1, and 2.45. amorphous metal power transformer with C
=
=
=
the MSE (3) are also included in Fig. 6. It can be seen that EEL provides exactly the same values as the analytical results, whereas the MSE does not. When the duty cycle approaches 1, the error by the MSE can reach to 40%. IV. APPLICATIONS Fig. 5. Comparison between calculation and measurement for triangular 12). magnetization with varying duty cycle ( 1.3; 2.55; and C
=
=
=
B. Triangular Magnetization With Varying Duty Cycle A variable duty cycle triangular magnetization as shown in Fig. 4 is further used for validation [5]. The duty cycle, which , varies from 0.5 to 0.95. Fig. 5 shows the is defined as computed results by EEL together with the measured data. The plot shows that in the duty cycle range 0.5 to 0.9, the computed and measured results are in good agreement with discrepancy within 6%. For the last point, the discrepancy is about 17%. This is because the parameters used in the empirical approach (2) are valid only within a certain frequency range. When duty cycle approaches 1, the high frequency components due to the to exceed the valid sudden change of flux density from frequency range of the fixed parameters. C. Comparison to Analytical Results When If in the Steinmetz equation (2), the corresponding time domain solutions by (15) can be obtained from (16) becomes constant. The loss analytically since obtained from EEL compared with the analytical results under 1.5 12 is shown in Fig. 6. For the sake of comparison, the loss predications in the frequency domain by
The proposed model has been used to compute the core loss for both soft ferromagnetic and power ferrite materials in two-dimensional (2-D) and three-dimensional (3-D) transient FE analysis. In the 3-D case, the scalar model (5), (10), and (11) for soft materials is modified as (18) (19)
(20) For ferrite materials, the 3-D model based on components , and , from (15) are expressed as (21) Equations (18) to (21) can also be used for 2-D core loss computation when the component is set to zero. Two applications are presented. One is the core loss computation for a 250 kVA three-phase amorphous metal power transformer with five legs. Using 3-D transient FE analysis, the computed instantaneous core loss is shown in Fig. 7. Fig. 8 gives
LIN et al.: DYNAMIC CORE LOSS MODEL
1321
In Fig. 10, the coefficient component is derived from
for classical eddy current loss (22)
Fig. 8. Computed 3-D core loss distribution for the 250-kVA three-phase amorphous metal power transformer.
where is the lamination thickness and is the conductivity. Coefficients for hysteresis and excess loss components are de2, (1) rived through a curve regression algorithm. When can be written as
TABLE I COMPUTED AND MEASURED CORE LOSS OF THE 250-kVA THREE-PHASE AMORPHOUS METAL POWER TRANSFORMER
(23) Based on the manufacturer-provided loss curve are determined from and
,
(24) Thus,
and
are given by (25) (26)
where is the frequency at which loss curve is measured. From Fig. 10, it can be observed that there are 12 loss spikes in one period, say from 0.02 to 0.04 s. This is caused by the 12 slots in one pole pair. The periodic variation of the envelope of the loss spikes is due mainly to the uneven yoke of the square stator laminations.
Fig. 9. Geometry of the BLDC motor.
V. CONCLUSION
Fig. 10. Computed instantaneous core loss of the BLDC motor with k 260.4, k 0.822; k 40.54, and 2.
=
=
=
=
TABLE II COMPUTED AND MEASURED CORE LOSS OF THE BLDC MOTOR
A dynamic core loss model is proposed to predict instantaneous core loss in unison with both 2-D and 3-D transient FE analysis. This model is practical for industrial applications because it provides reasonable accuracy and all necessary parameters are either directly available or extracted from manufacturer-provided loss curves. This model is able to consider both pulsating and rotating field effects. The effect of dc bias magnetization can also be taken into account by setting the area of the ellipse in Fig. 1 as a function of the dc bias magnetization at which the loss curve is measured. REFERENCES
the corresponding core loss distribution. The computed time-average core loss is compared with the measured result in Table I. The second example is the core loss of a 165 W, 4-pole permanent magnet brushless DC (BLDC) motor shown in Fig. 9. Using 2-D transient FE analysis, the computed instantaneous 2 is shown in Fig. 10. core loss based on (18) to (20) with The average core loss is derived over the last period and is compared with measured data in Table II. The measurement was done under no-load condition and the frictional loss is assumed to be 1% of the rated power. Table II shows that the error between the computed and measured results is 4.6% when the frictional loss is assumed to be 1.65 W (1% of the rated power).
[1] G. Bertotti, “General properties of power losses in soft ferromagnetic materials,” IEEE Trans. Magn., vol. 24, pp. 621–630, Jan. 1988. [2] C. P. Steinmetz, “On the law of hysteresis,” AIEE Trans., pp. 3–64, 1892. Reprinted under the title “A Steinmetz contribution to the ac power revolution,” introduction by J. E. Brittain, in Proc. IEEE, vol. 72, 196–221, Feb., 1984. [3] J. Reinert, A. Brockmeyer, and R. W. De Doncker, “Calculation of losses in ferro- and ferromagnetic materials based on the modified Steinmetz equation,” IEEE Trans. Ind. Applicat., vol. 37, no. 4, pp. 2087–2092, 2001. [4] D. C. Jiles and D. L. Atherton, “Theory of ferromagnetic hysteresis,” J. Magn. Magn. Mater., vol. 61, pp. 48–60, 1986. [5] A. Brockmeyer and L. Schulting, “Modeling of dynamic losses in magnetic material,” in Proc. EPE, vol. 3, Brighton, U.K., 1993, pp. 112–117. [6] I. D. Mayergoyz, Mathematical Models of Hysteresis. New York: Springer, 1991. [7] L. Jieli, T. Abdallah, and C. R. Sullivan, “Improved calculation of core loss with nonsinusoidal waveforms,” in Proc. 36th Annu. Meeting IEEE Industry Applications Society, vol. 4, 2001, pp. 2203–2210.
A Dynamic Core Loss Model for Soft Ferromagnetic and ... - IEEE Xplore
2, MARCH 2004. A Dynamic Core Loss Model for Soft Ferromagnetic and Power Ferrite Materials in Transient. Finite Element Analysis. D. Lin, P. Zhou, W. N. Fu, ...
AbstractâThe primary aim of this special session is to inform the conference's interdisciplinary audience about the state-of-the-art in developmental studies of ...
systems for Internet, voice, and data services requires measure- ... of the model at a test network, as well as its use for definition of .... 1. Multipath signal propagation; cable with one tap. impedance variations within the indoor network.
combination is shown to be optimal for the Viterbi algorithm. I. INTRODUCTION. Variable Length Codes are widely used in modern com- pression codecs such ...
AbstractâAnalysis of cranial nerve systems, such as the ante- rior visual pathway (AVP), from MRI sequences is challenging due to their thin long architecture, structural variations along the path, and low contrast with adjacent anatomic structures
mance Variability, Interactive Multi-tier Applications, Geo- distribution. I. INTRODUCTION. CLOUD computing promises to reduce the cost of IT organizations by ...
Hierarchical, cluster-based routing greatly reduces rout- ing table sizes compared to host-based routing, while reduc- ing path efficiency by at most a constant factor [9]. More importantly, the amount of routing related signalling traffic is reduced
AbstractâThis paper proposes a joint random field (JRF) model for moving vehicle detection in video sequences. The JRF model extends the conditional random field (CRF) by intro- ducing auxiliary latent variables to characterize the structure and ev
21, NO. 10, OCTOBER 2010. Incorporating the Loss Function into Discriminative. Clustering of Structured Outputs. Wenliang Zhong, Weike Pan, James T. Kwok, ...
AbstractâDue to the high beam divergence of standard laser diodes (LDs), these are not suitable for wavelength-selective feed- back without extra optical ...
Dept. of Computer Science, UCLA. Los Angeles, USA. {tuanle, kalantarian, gerla}@cs.ucla.edu. AbstractâDelay Tolerant Networks (DTNs) are sparse mobile.
Jan 9, 2012 - remedy for the system as faults occur and save the remaining com- ponents. ... by the proposed protection method through monitoring the flying.
Universitat der Bundeswehr, Munchen. W.Heisenberg Weg 39, D-85577 Neubiberg, GERMANY. Fax: +49 89 6004 2082. Abstract. In this survey paper covering ...
tive specifications for voice over asynchronous transfer mode (VoATM) [2], voice over IP. (VoIP), and voice over frame relay (VoFR) [3]. Much has been written ...
Dec 2, 2004 - time, the computer and consumer electronics indus- tries are defining ... tered on data synchronization between desktops and personal digital ...
ACCEPTED FROM OPEN CALL. INTRODUCTION. Two trends motivate this article: first, the growth of telecommunications industry interest in the implementation ...
search strategy to a great number of habitats and prey distributions. We propose to synthesize a similar search strategy for the massively multimodal problems of ...
Aug 29, 2008 - Page 1 ... then apply the model to design an optical feedback controller ... we use the compressed model to design and demonstrate a con-.
Dec 17, 2013 - AbstractâThis brief presents a scheme of model reference adaptive control with perturbation estimation (MRACPE) for precise motion control ...