Polymer 45 (2004) 1477–1483 www.elsevier.com/locate/polymer
Miscibility behaviour of amorphous poly(3-hydroxybutyrate) (a-PHB)/styrene –vinyl phenol copolymer (STY-co-VPH) blends applying an association model A. Gonzalez1, L. Irusta, M.J. Ferna´ndez-Berridi*, M. Iriarte, J.J. Iruin Polymer Science and Technology Department and Institute for Polymer Materials (POLYMAT), University of the Basque Country, P.O. Box 1072, 20080 San Sebastian, Spain Received 3 July 2003; received in revised form 14 October 2003; accepted 8 December 2003
Abstract In this work a Fourier transform infrared (FTIR) study of blends of styrene – vinyl phenol copolymers (containing different proportions of styrene) with atactic PHB is presented. The equilibrium constant describing phenolic OH/ester carbonyl hydrogen bonds ðKA Þ has been experimentally determined from the quantification of the hydrogen-bonded carbonyl group fraction as a function of temperature, and the effect of functional group accessibility on KA values has been discussed. An average value of KA ¼ 41 has been employed to perform a prediction of miscibility maps employing the association model of Painter and Coleman. A fairly good agreement between theoretical predictions and experimental results has been obtained. q 2003 Elsevier Ltd. All rights reserved. Keywords: Poly(3-hydroxybutyrate); Poly(styrene-co-vinyl phenol); FTIR
1. Introduction It is well known that hydrogen-bonding interactions play an important role in the compatibility or/and miscibility of polymeric blends. Fourier transform infrared (FTIR) spectroscopy can be used to identify the presence of intermolecular interactions between different polymeric components. An example of them is the study of poly(3hydroxybutyrate) containing blends with styrene – vinyl phenol copolymers. Painter and Coleman [1 –4] have developed an association model, which has obtained important success predicting phase behaviour of hydrogen bonded polymer blends. In this model a balance between unfavourable physical and usually favourable chemical forces determines the free energy of mixing. The favourable energy accounts for the hydrogen-bonded interactions and can be determined from association equilibrium constants. These constants can be experimen* Corresponding author. Tel.: þ 34-943-018194; fax: þ 34-943-212236. E-mail address:
[email protected] (M.J. Ferna´ndez-Berridi). 1 On leave from the Chemical Engineering Faculty. Universidad de Oriente, Santiago de Cuba. (Cuba). 0032-3861/$ - see front matter q 2003 Elsevier Ltd. All rights reserved. doi:10.1016/j.polymer.2003.12.053
tally obtained from measurements of the fraction of intermolecular hydrogen bonded acceptor groups using infrared spectroscopy. The authors of this association model propose the determination of self-association and inter-association equilibrium constants from low molecular weight polymer analogues and to scale them to the polymer, taking into account the difference of molar volume. The polymer molar volume is referred to the average specific repeat unit, defined in such a way to contain one phenolic hydroxyl group, and estimated from group contributions [3 –7]. In addition, Painter and Coleman, in a later revision of the model, point out that the macromolecular nature of the polymer blend must be taken into account in order to scale the equilibrium constants, obtained in compounds analogue to the polymer. The fact of the existence of covalent linkages between the polymeric segments results in an accentuation of the number of the same type of contacts (from a chain bending back of itself, both locally and through long range effects), over that calculated on the basis of a simple random mixing of segments. This behaviour makes the inter-association equilibrium constant, measured in polymer blends, lower
1478
A. Gonzalez et al. / Polymer 45 (2004) 1477–1483
than that obtained from low molecular weight analogues [8,9]. This effect has been introduced in the association model through the incorporation of a new parameter, (denoted g), which reflects the fraction of intra molecular contacts, originated by the macromolecular nature of the blend. Literature reports agree on a value between 0.25– 0.35 [10] for this parameter. Furthermore, Painter and Coleman in recent experiments have demonstrated that the inter-association constant KAstd for PVPH blends with poly(vinyl acetate) (PVAc), which has been spaced or separated by dimethylbutadiene (DMB) or ethylene (E) units, increases with the amount of inert spacers [11,12]. The authors have attributed this effect to the steric hindrance that the proximity of the interacting units imposes upon hydrogen bonding. Although several attempts have been made to quantify this phenomenon, only particular expressions have been deduced. Related to this, the authors have been investigating vinyl cinnamate copolymers and their blends with copolymers containing 4-vinyl phenol, as potential systems that could be used to study the effect of cross-linking on functional group accessibility [13] and phase behaviour. It is the purpose of this communication to explore the effect of chain connectivity for PHB blends with PVPH, which has been separated by styrene units, and to predict the miscibility window for this system in order to ratify the validity of the association model.
Table 1 Characterisation of styrene–vinyl phenol copolymers % molar copolymer
Tg (K)
Styrene % molar
Mn
Mw
PI
STY-co-VPH 10:90 STY-co-VPH 20:80 STY-co-VPH 30:70 STY-co-VPH 40:60 STY-co-VPH 50:50 STY-co-VPH 80:20
451 442 434 425 417 392
13.3 20.2 32.1 41.1 50.4 80.1
5893 7490 12,400 24,350 17,300 31,000
11,425 16,050 26,100 74,950 36,100 60,600
1.9 2.1 2.1 3.1 2.1 1.9
rate of 20 8C/min was used in all Tg measurement, and Tg was recorded as the midpoint of heat capacity change. Table 1 summarises the composition, Tg and molecular weight of the obtained copolymers. Polymer samples for infrared analyses were prepared by casting films on KBr windows from 1% solution in methyl ethyl ketene (MEK). After most of the solvent had evaporated the samples were carefully dried under vacuum at 100 8C for 72 h to completely remove residual solvent. Infrared measurements were recorded on a Nicolet, model Magna 560 FTIR spectrometer at a resolution of 2 cm21. A minimum of 10 scans was signal averaged. A variable temperature cell, equipped with a temperature control unit, mounted in the spectrometer, was employed for the temperature-dependent IR measurements. The films were sufficiently thin to be within the absorption range where the Lambert –Beer law is obeyed.
2. Experimental
3. Results and discussion
2.1. Materials
3.1. Thermal analysis
Atactic poly(3-hydroxybutyrate) (a-PHB) was prepared following the method proposed by different authors [14,15]. Average molecular weights, as determined by gel permeation chromatography (GPC) are Mn ¼ 122; 000; Mw ¼ 233; 000 (referred to polystyrene calibration standards). Glass transition temperature of the polymer is Tg ¼ 273 K: Styrene –vinyl phenol copolymers were synthesised by solution free radical copolymerisation of appropriate mixtures of styrene and acetoxystyrene, followed by selective removal of acetoxy protective groups. Details of the synthesis and characterisation of the copolymers have been reported elsewhere [16,17].
DSC thermograms of all blends of a-PHB with the copolymer containing a 10 mol% of vinyl phenol showed two glass transition temperatures close to those of pure components, indicating that the system is immiscible.
2.2. Preparation and characterisation of blends and copolymers The composition of styrene – vinyl phenol copolymers containing from 10 to 90 wt% of VPH (denoted STY-coVPH (x:y)), was determined by 1H NMR (Bruker 300 MHz spectrometer). Thermal analysis was conducted on a Perkin– Elmer DSC-2C apparatus, with a TADS Data Station. A heating
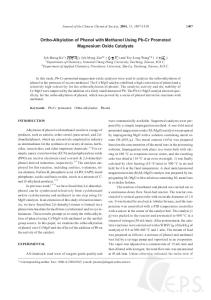
Fig. 1. Thermograms of blends of a-PHB with styrene–vinyl phenol copolymer (80 mol% of styrene). (A) 80/20; (B) 40/60 and (C) 20/80.
A. Gonzalez et al. / Polymer 45 (2004) 1477–1483
1479
However, DSC thermograms obtained for different composition blends of PHB with the copolymer containing 20 mol% of vinyl phenol (Fig. 1) exhibit single Tg0 s that are intermediate between those of the pure materials. This is good evidence that they are all single phase. The Tg0 s were determined to be respectively 285, 320 and 362 K. Blends of a-PHB with the rest of copolymer compositions were also miscible, at least at the size scaled measured by DSC. Therefore, it can be concluded that blends of aPHB/STY-co-VPH exhibit a different miscibility behaviour depending on the copolymer composition. 3.2. FTIR studies It is well known that poly(vinyl phenol) is a strongly selfassociated polymer. This association is characterised by two equilibrium constants K2 and KB ; which describe the formation of dimers and multimers respectively. In aPHB/STY-co-VPH blends besides the self-association of the vinyl phenol units, inter-association between phenolic OH and carbonyl groups of a-PHB must be considered. This equilibrium can be described by a constant named KA : Scheme 1 displays a schematic representation of the intermolecular interactions between phenolic OH groups of styrene/vinyl phenol copolymer and the carbonyl group of a-PHB. Fig. 2 shows the infrared spectra of different composition a-PHB blends with the copolymer (30:70) recorded at 140 8C in the region of 1800– 1650 cm21. All spectra show two characteristic bands whose intensities vary systematically as a function of composition [18]. The band at 1739 cm21 can be assigned to free carbonyl-stretching vibrations (non-hydrogen bonded), and the band at 1720 cm21 corresponds to carbonyl groups bonded to hydroxyl groups. The wideness of this second band reflects a broad distribution of hydrogen bonded CvO, and its intensity decreases as a-PHB content increases. Fig. 3 shows the hydroxyl-stretching region between 3700 –3100 cm21 for the same blends. The two bands at approximately 3539 and 3450 cm21 are assigned to the free and bonded O –H stretching vibrations, respectively. The fraction of free hydroxyl groups decreases with a-PHB content due to the relative increase of carbonyl groups. In
Fig. 2. FTIR spectra in the 1800–1650 cm21 region recorded at 140 8C, of a-PHB blends with styrene–vinyl phenol copolymer (30:70). (A) 10/90; (B) 20/80 and (C) 40/60.
addition, the maximum peak position of the hydrogenbonded hydroxyl mode shifts to higher wave-numbers as PHB content increases, which is attributable to a decrease in the average strength of intermolecular hydrogen-bonded species. Fig. 4 shows the infrared spectra at 140 8C of 10/90 blends containing different copolymer compositions. The features of these spectra are consistent with those expected for the respective copolymers. Thus, the fraction of carbonyl groups, which are hydrogen bonded decreases with the styrene ratio in the copolymers. Infrared spectra in the carbonyl-stretching region obtained at temperatures from 100 to 160 8C for a 20/80 a-PHB/STYco-VPH (30:70) blend sample are shown in Fig. 5. As expected, the intensity of the band at 1720 cm21, due to bonded carbonyl stretching vibration groups, decreases with temperature [19]. 3.3. Determination of the inter-association equilibrium constant between phenolic/carbonyl groups From the infrared spectra of PHB/STY-co-VPH blends, the inter-association equilibrium constant, KA ; and the association enthalpy can be calculated. It has to take into account that the inter-association equilibrium constant is
Scheme 1.
1480
A. Gonzalez et al. / Polymer 45 (2004) 1477–1483
Fig. 3. FTIR spectra in the hydroxyl-stretching region 3700– 3100 cm21 recorded at 140 8C, of a-PHB blends with styrene–vinyl phenol copolymer (30:70). (A) 10/90; (B) 20/80 and (C) 40/60.
defined for each system independently of blend composition. Therefore, in this case a series of KA values as a function of copolymer composition will be calculated. The dependence of KA on temperature will define the value of the association enthalpy. The methodology of the calculation implies the determination of the ‘free’ carbonyl fraction for blends at different compositions and temperatures. As can be seen in Fig. 2, the two infrared bands are very close together and in order to calculate their relative contributions, a curve resolution is necessary. For this purpose the software, Spectra Fit, developed by Painter and Coleman was used. Once the two individual contributions are known, the fraction of free carbonyl groups can be determined by means of Eq. (1). ff ¼
Af Af þ ðAB =1:5Þ
ð1Þ
Fig. 4. FTIR spectra in the carbonyl-stretching region 1840– 1640 cm21 recorded at 140 8C, for 10:90 blends, at different copolymer compositions. (A) 30:70; (B) 50:50 and (C) 80:20.
Fig. 5. FTIR spectra in the region 1800–1640 cm21 of a 20/80 aPHB/copolymer (30:70) heated to 160 8C and recorded as a function of decreasing temperature.
Where Af and AB are the areas of free and associated carbonyl bands respectively, and 1.5 accounts for the different absorption coefficients of bonded and free carbonyl functional groups [1]. The stoichiometry of the system relates the free carbonyl fraction as a function of blend composition with the self and inter-association equilibrium constants [20,21]. Using the self-association constants K2 and KB reported in literature [22], and assuming an initial value of KA ; the free carbonyl fraction as a function of blend composition can be calculated. A least square fit procedure is then applied to fit the experimental and theoretical curves and determine a value of KA for each temperature. In this work, the commercial software, Fit K; was used to perform this calculation. In order to minimize the experimental error, it is essential to select the most adequate composition range. Painter and Coleman reported that the optimum blend compositions for quantitative analysis vary from system to system and simulations are greatly recommended for determining the optimum interval [22]. Nevertheless, they usually propose C¼0 that the most accurate range in the determination of fHB spectroscopically is from 0.4 to 0.7, because this is the interval where both free and hydrogen bonded carbonyl bands have significant absorbance. A simulation of the hydrogen bonded carbonyl fraction as a function of composition, using two different KA values, is shown in Fig. 6. As can be seen, in this case, the optimum blend composition lies between 0.6 and 1. Similar studies have also been performed with blends of a-PHB and different copolymer compositions. For all systems, only the 10/90 wt% blends, no matter the composition of the copolymer, were clearly inside this interval and, therefore, KA was determined only from values obtained from these blends. Although at first glance, this determination, limited to a unique value, could seem not strict, it is considered that the implied error in KA calculation operating this way is less when compared with
A. Gonzalez et al. / Polymer 45 (2004) 1477–1483
1481
Table 3 Determination of KA values for at 10:90 blend containing different copolymer compositions
Fig. 6. Simulation at 140 8C of the fraction of hydrogen bonded carbonyl groups as a function of composition for blends of a-PHB/STY-co-VPH (20:80).
that in the case of determining KA from different composition values, obtained in non-appropriate conditions. Table 2 summarises the results obtained for the curve resolution and free carbonyl fraction as a function of temperature for a 10:90 blend containing 10 mol% of styrene. Similar calculations were performed for the rest of copolymer compositions. From these results, the inter-association equilibrium constant KA was determined at different temperatures for all copolymer compositions, using a least squares fit of the stoichiometric equation and software application [20]. Table 3 summarises the results for different blends with copolymers of variable styrene composition. As can be seen, for a particular copolymer KA decreases as temperature increases. A van’t Hoff type dependence (Fig. 7) was assumed for the inter-association constant with temperature [1,3,22,23]. From the slope of the representation of ln KA vs 1=T; the enthalpy of hydrogen bonding can be calculated and the values are summarised in Table 4.
T (K)
PVPH
10:90
20:80
30:70
40:60
50:50
80:20
373 383 393 403 413 423 433
10.5 10.0 8.8 7.7 6.8 6.1 5.6
11.2 9.5 8.4 7.5 6.8 6.0 5.4
15.3 13.5 11.9 10.6 9.3 8.4 7.6
11.2 9.8 8.7 7.8 6.9 6.3 5.7
11.9 10.5 9.3 8.2 7.4 6.6 6.0
13.5 12.0 10.7 9.5 8.4 7.6 7.0
12.0 10.2 9.4 8.4 7.8 7.3 6.8
As can be seen, the enthalpy of hydrogen bonding does not show a clear dependence on copolymer composition. Therefore, we can conclude that the hydrogen bonding strength is not a function of copolymer composition. Using an average enthalpy of 2 3.6 kcal/mol, the values of the inter-association equilibrium constant have been scaled to 25 8C, taking a reference molar volume of 100 cc/mol. Table 5 shows the standard KA values at 25 8C as a function of styrene composition in the copolymer. At first instance it seems that the inter-association equilibrium constants show an erratic dependence on styrene composition. However, it must bear in mind that the equilibrium constant measurements must be carried out about 10 8C above Tg of the blend. Due to the thermal instability of PHB, infrared measurements above 433 K imply polymer degradation. Unfortunately blends of PHB with copolymer compositions of 0:100, 10:90 and 20:80 are not above Tg (443, 433 and 425 K respectively) in the employed experimental conditions. Therefore, if KA values for these compositions are omitted, the equilibrium inter-association constant increases as the space between hydroxyl groups along the styrene –vinyl phenol copolymer chain increases. This effect might be a question of steric accessibility and can be related to the loss of internal degrees of rotational freedom in the chain where functional groups are chemically bonded. Similar results have been reported on in literature [24]. The average value of KASTD at 25 8C (41) is in accordance
Table 2 Determination of different parameters at several temperatures for the system 10/90 a-PHB/STY-co-VPH (10:90) T (K)
PL (cm21)
IL
WL (cm21)
AL
PA (cm21)
IA
WA (cm21)
AA
fL (cm21)
373 383 393 403 413 423 433
1743 1743 1743 1743 1743 1743 1743
0.217 0.220 0.226 0.224 0.216 0.217 0.219
21 21 21 21 21 21 21
4.79 4.96 5.08 5.03 4.86 4.87 4.93
1718 1718 1718 1718 1718 1719 1719
0.279 0.277 0.280 0.276 0.264 0.260 0.259
37 37 37 37 37 37 37
11.04 10.93 11.07 10.94 10.46 10.31 10.25
0.39 0.40 0.41 0.41 0.41 0.42 0.42
1482
A. Gonzalez et al. / Polymer 45 (2004) 1477–1483
Table 4 Values of hydrogen bonding enthalpy for different copolymers STY-co-VPH
hA (kcal/mol)
0:100 10:90 20:80 30:70 40:60 50:50 80:20
23.9 23.8 23.8 23.7 23.7 23.6 23.0
with that given in literature [25] for different blends containing hydroxyl-carbonyl interactions. 3.4. Miscibility map predictions applying the association model
Table 5 Values of dimensionless interassociation equilibrium constants, for different copolymers STY-co-VPH
KA 25 8C
0:100 10:90 20:80 30:70 40:60 50:50 80:20
36.5 36.5 50.0 37.0 39.9 44.9 42.0
Table 6 Range of studied variables Variable
Lower level
Average level
Upper level
KA dPHB (cal/cm3)0.5 dSTY (cal/cm3)0.5 dPVPH (cal/cm3)0.5
36.5 9.2 9.1 9.5
43.3 9.6 9.5 9.9
50.0 10.0 9.9 10.4
KA and DHA values can be employed to calculate free energy of mixing of PHB and STY-co-VPH copolymers using the association model of Painter and Coleman (Phase calculator 2.1 commercial software). Fig. 8 shows the miscibility map calculated at 140 8C, using the original free energy equation [1] and assuming an average value of KASTD ¼ 41 at 25 8C. According to this prediction, the system a-PHB/STY-coVPH can be considered a single phase at almost all compositions, except for copolymer compositions lower than 1% of vinyl phenol. However, DSC results are not consistent with a single phase for compositions higher than 10% in styrene. In order to check the validity of the results, a study about the influence of some parameters employed in the calculations has been performed. The free energy of mixing has been calculated essentially from two contributions: one favourable and the other one unfavourable. The contribution of unfavourable physical forces to the free energy of mixing is determined using polymer solubility parameters [26], obtained from group
molar attraction constants, what implies large inherent errors. According to bibliographic reports [1], the potential error is at least ^ 0.4 (cal/cc)0.5. Taking into account this fact, solubility parameters of PHB, PVPH and polystyrene, have been considered. On the other hand, the favourable contribution is governed by equilibrium association constants; therefore, the inter-association equilibrium constant was also considered. According to this, 16 miscibility maps were calculated varying the solubility parameters of PHB, VPH and STY and the inter-association equilibrium constant. The planning of the experiments has been done upon the basis of a complete factorial design. The minimum and maximum levels were selected considering the errors involved in each calculation. Lower and upper levels of the inter-association equilibrium constant correspond with lower and higher experimental values respectively. The average value is defined by means of the arithmetical mean.
Fig. 7. van’t Hoff plot of ln KA vs. 1=T for a-PHB/STY-co-VPH (30:70) blends.
Fig. 8. Miscibility map for blends of a-PHB with different styrene–vinyl phenol copolymers at 140 8C.
A. Gonzalez et al. / Polymer 45 (2004) 1477–1483
1483
applying the association model of Painter and Coleman. Miscibility in hydrogen bonded a-PHB/STY-co-VPH blends is governed by solubility parameters of both a-PHB and styrene.
References
Fig. 9. Simulation of phase behaviour employing different values of solubility parameters of PHB for a-PHB/STY-co-VPH blends at 140 8C.
Table 6 shows the selected levels for the variables employed in this study. The results of these calculations show that the inter-association equilibrium constant and the solubility parameter of VPH have not significant effect on the form and extent of the single-phase region of the miscibility map, at least in the considered interval. However, the form and extent of the single-phase region is dominated by the difference between the solubility parameters of PHB and STY. Fig. 9 shows the theoretical predictions using different values of the PHB solubility parameter. As can be observed, a value of 10.51 (þ 0.9 over the average value) of the solubility parameter of PHB allows reproducing the experimental map of miscibility. In addition, the experimental phase behaviour can also be predicted using values closer to those reported in bibliography, provided that the difference between both values is maximum.
4. Conclusions Inter-association equilibrium constants have been determined by infrared spectroscopy for PHB/STY-co-VPH STD blends. An average value of K25 8C ¼ 41 has been obtained, which is within the range of literature data for systems containing carbonyl/hydroxyl group. KA values have shown a dependence on copolymer styrene content. This effect is due to a higher accessibility of hydroxyl groups when these groups are spaced with styrene units, as proposed in literature. A good miscibility prediction has been obtained
[1] Coleman MM, Painter PC, Graf JF. Specific interactions and the miscibility of polymer blends. Lancaster, PA: Technomic Publishing Inc; 1990. [2] Coleman MM, Lichkus AM, Painter PC. Macromolecules 1989;22: 586. [3] Coleman MM, Yang X, Painter PC. Macromolecules 1992;25:4414. [4] Irusta L, Iruin JJ, Ferna´ndez-Berridi MJ, Sobkowiak M, Painter PC, Coleman MM. Vib Spectrosc 2000;23:187. [5] Coleman MM, Yang X, Zhang H, Painter PC, Scherer KV. J Polym Sci: Part A: Polym Chem 1993;31:2039. [6] Coleman MM, Pehlert GJ, Painter PC. Macromolecules 1996;29: 6820. [7] Coleman MM, Yun X, Painter PC. Macromolecules 1994;27:127. [8] Hu Y, Painter PC, Coleman MM, Butera RJ. Macromolecules 1998; 31:3394. [9] Motzer HR, Painter PC, Coleman MM. Macromolecules 2001;34: 8388. [10] Painter PC, Veytsman B, Kumar S, Shenoy S, Graf JF, Xu Y, Coleman MM. Macromolecules 1997;30:932. [11] Pehlert GJ, Painter PC, Coleman MM, Veytsman B. Macromolecules 1997;30:3671. [12] Pehlert GJ, Painter PC, Coleman MM. Macromolecules 1998;31: 8423. [13] Hu Y, Gamble V, Painter PC, Coleman MM. Macromolecules 2002; 35:1289. [14] Arshadi R, Kenner GW, Ledwith A. J Polym Sci Polym Chem 1974; 12:2017. [15] Agostini DE, Lando JB, Reid Shelton J. J Polym Sci Part A 1971;9: 2775. [16] Coleman MM, Varnell WD. Comput Ser 1982;59:847. [17] Gonzalez A. Thesis, Doctoral UPV/EHU, San Sebastian 2002. [18] Coleman MM, Lichkus AM, Painter PC. Macromolecules 1989;22: 586. [19] Coleman MM, Narvett LA, Park YH, Painter PC. J Macromol Sci Phys 1998;3:283. [20] Coleman MM, Painter PC. Macromol Chem Phys 1998;199:1307. [21] Irusta L, L’ Abe´e M, Iruin JJ, Ferna´ndez-Berridi MJ. Vib Spectrosc 2001;27:183. [22] Serman CJ, Painter PC, Coleman MM. Polymer 1991;32:1049. [23] Russell S, Epley TD. J Am Chem Soc 1969;91:2883. [24] Painter PC, Park Y, Coleman MM. J Appl Polym Sci 1998;70:1273. [25] Coleman MM, Pehlert GJ, Painter PC. Macromolecules 1996;29: 6820. [26] Coleman MM, Serman CJ, Bhagwagar DE, Painter PC. Polymer 1990;31:1187.