11 April 2018 Earnings Preview
CPF (CPF TB) Charoen Pokphand Foods Current
Previous
Close
2018 TP
Exp Return
THAI CAC
CG 2017
HOLD
HOLD
24.5
28.0
+14.3%
Declared
5
Consolidated earnings BT (mn)
2016
2017
2018E
2019E
Normalized earnings
14,748
5,897
6,444
7,552
Net profit
14,703
15,259
14,206
14,552
Normalized EPS (Bt)
1.90
0.68
0.75
0.88
EPS (Bt)
1.90
1.77
1.65
1.69
% growth
33.0
-6.7
-6.9
2.4
Dividend (Bt)
0.95
0.75
0.70
0.76
BV/share (Bt)
17.27
19.51
20.46
21.39
EV/EBITDA (x)
12.7
20.9
18.3
16.5
Normalized PER (x)
12.9
35.8
32.7
27.9
PER (x)
12.9
13.8
14.9
14.5
PBV (x)
1.4
1.3
1.2
1.1
Dividend yield (%)
3.9
3.1
2.9
3.1
11.0
3.5
3.7
4.1
7,743
8,611
8,611
8,611
1.0
1.0
1.0
1.0
ROE (%) YE No. of shares (million) Par (Bt)
Source: Company data, FSS estimates
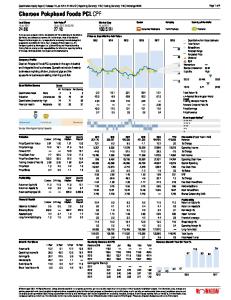
In the near term, CPF’s 1H18 profit outlook remains weak. Specifically, the company might continue to report loss from 4Q17 after the price of pigs in both Thailand and Vietnam decreased to where they are below raising cost. Moreover, 1H is the export industry’s low season. In 2Q18, the company’s outlook remains lackluster. Although pig price has increased to where it’s above raising cost, such gain is attributed to the government’s policy to increase the price to help small farmers. After which, we expect pig price to move in line with actual demand and supply. Meanwhile, the price of pig in Vietnam has turned to fall again, while CPF begins to realize from a new lot of feed that is more expensive. However, we expect a recovery in the company’s operating performance in 2H18 thanks to the export industry’s high season. Furthermore, investors need to keep an eye on meat prices in both Thailand and Vietnam because they should increase in the second half of this year. Given that, we stand by our 2018E net profit (-6.9% Y-Y) and maintain our 2018 TP of Bt28. Although there is still upside, we retain our HOLD rating on CPF because its 1H18 profit outlook remains dull. Expect 1Q18 performance to be dull
Share data Sector
Food & Beverage
Close (10/04/2018) SET Index
24.50 1,760.95
Foreign limit/actual (%)
40.00/26.08
Paid up shares (million)
8,611.24
Free float (%)
48.77
Market cap (Bt m) Avg daily T/O (Bt m) (2018 YTD) hi, lo, avg (Bt) (2018 YTD)
210,975.44 963.00 26.50, 22.50, 24.39
Source: Setsmarts SET Index
Price (Bt)
2,050.00
46.00
1,900.00
42.00
1,750.00
38.00
1,600.00
34.00
1,450.00
30.00
1,300.00
26.00
1,150.00
22.00
1,000.00
18.00 SET
850.00
1H18 operating performance set to remain dull
CPF
700.00
14.00
Jan-13 Feb-13 Apr-13 May-13 Jul-13 Aug-13 Oct-13 Nov-13 Jan-14 Mar-14 Apr-14 Jun-14 Jul-14 Sep-14 Oct-14 Dec-14 Feb-15 Mar-15 May-15 Jul-15 Aug-15 Oct-15 Nov-15 Jan-16 Feb-16 Apr-16 Jun-16 Jul-16 Sep-16 Oct-16 Dec-16 Jan-17 Mar-17 May-17 Jun-17 Aug-17 Sep-17 Nov-17 Dec-17 Feb-18 Mar-18
10.00
Source: SET
Analyst: Sureeporn Teewasuwet Register No.: 040694 Tel.: +662 646 9872 email:
[email protected] www.fnsyrus.com
Finansia Syrus Securities @fnsyrus
CPF’s 1Q18 operating performance looks set to be dull. Specifically, the company might continue to face loss after its 4Q17 loss of Bt888mn. However, we expect gain from sales of investment, as usual, which helped CPF to be able to report net profit of Bt2.5bn. The weak operating performance is likely to be attributed to the followings. First, the average price of domestic pigs was equal to Bt46.7 per kg (-6% Q-Q, -20% Y-Y) in 1Q18, which is lower than raising cost. Second, the average price of pigs in Vietnam was 31,604 dong per kg (+14.9% Q-Q, -5.3% Y-Y), also lower than raising cost. Third, the average price of domestic chicken was Bt32 per kg (-2% Q-Q, -15.8% Y-Y), nearly break even. Fourth, it’s the shrimp industry’s low season. Fifth, CPF began to realize from a new lot of feed whose cost was higher. Given that, we expect both revenues and gross margin to decrease. 2Q18 outlook remains weak Looking ahead, CPF’s 2Q18 profit looks set to remain lackluster. Although the domestic price of pigs has increased to Bt60 per kg, which is above raising cost, it is only attributed to the government’s policy to increase pig price by three times to help small farmers. They were made within the past month and are completed. Moreover, the government has moved to ask for farmers’ cooperation to cut their production by 10%. This should bear fruit in 3Q18. Given that, future pig price will move in line with actual demand and supply. In Vietnam, pig price has turned to decrease to 28,000-29,000 dong per kg, while in Thailand chicken price is nearly flat. Profit set to turn to recover in 2H18 In the big picture, although CPF’s operating results look dull in 1H18, we expect a recovery in 2H18, particularly in 3Q18 when it’s the export industry’s high season. In 2018, we believe exports of shrimp and chicken will remain strong. Looking ahead, investors need to keep an eye on the meat price outlook in both Thailand and Vietnam which should turn to grow again in 2H18. In addition, we expect its international units to recover. However, Bellisio, its U.S. unit, should continue to face loss. Although there might not be large investments as last year, the company is adjusting its strategy and marketing after competition has increased. As a result, we expect 2H18 profit to increase H-H. This year, we stand by our net profit estimate at Bt14.2bn (-6.9% Y-Y). Risks – Slower-than-expected recovery in its shrimp and international units, a decline in meat prices, oversupply in its livestock business, FX volatility Page 1 of 4
CPF (CPF TB) Income Statement (Consolidated)
Cash Flow Statement (Consolidated)
(Bt mn)
2015
2016
2017
2018E
2019E
(Bt mn)
2015
2016
2017
2018E
2019E
Revenue
421,355
464,465
501,507
541,628
584,958
Net profit
11,059
14,703
15,259
14,206
14,552
Cost of sales
363,287
391,822
441,422
476,633
511,839
Deprec. & amortization
11,507
13,249
15,882
16,632
17,382
Gross profit
58,068
72,643
60,086
64,995
73,120
Change in working capital
-3,791
-3,503
-5,819
-19,158
-454
SG&A
46,889
45,473
51,788
53,080
58,496
Other adjustments
-3,007
-6,378
-19,772
-16,366
-15,774
Operating profit
11,179
27,170
8,298
11,916
14,624
Cash flow from operations
3,482
2,401
2,324
2,708
2,925
EBIT
14,660
29,571
10,622
14,624
EBITDA
26,167
42,819
26,504
31,256
Interest charge
9,614
10,601
11,743
Tax on income
3,654
7,212
251
Earnings after tax
1,393
11,758
-1,372
Minority interest
-5,315
-5,983
-2,639
Normalized earnings
3,039
14,748
5,897
6,444
Extraordinary items
8,019
-46
9,362
7,762
11,059
14,703
15,259
14,206
14,552
Other income
Net profit
15,768
18,071
5,550
-4,686
15,706
Capital expenditure
-43,548
-31,360
-29,859
-15,000
-15,000
17,549
Others
-11,256
-5,965
8,240
9,624
5,267
34,931
Cash flow from investing
-54,804
-37,326
-21,619
-5,376
-9,733
11,512
12,351
Free cash flow
-39,036
-19,255
-16,069
-10,062
5,972
2,559
3,479
Net borrowings
42,420
5,590
-7,950
11,339
-3,406
553
1,719
Equity capital raised
-3,791
-4,095
-50
4
12,464
0
0
Dividends paid
-5,271
-5,839
-7,818
-6,037
-6,548
7,552
Others
21,630
56,484
-19,966
3,027
3,164
7,000
Cash flow from financing
58,729
56,238
-23,271
8,329
-6,791
Net change in cash
19,692
36,983
-39,340
-1,733
-818
2015
2016
2017
2018E
2019E
Balance Sheet (Consolidated)
Important Ratios (Consolidated)
(Bt mn)
2015
2016
2017
2018E
2019E
Cash
36,461
34,100
22,972
21,239
20,420
Growth (%)
Accounts receivable
26,156
30,679
36,134
43,627
47,117
Revenue
-1.1
10.2
8.0
8.0
8.0
Inventory
52,112
54,991
55,118
65,292
63,103
EBITDA
-1.7
63.6
-38.1
17.9
11.8
Net profit
Other current assets
45,265
46,599
50,224
52,613
56,513
Total current assets
159,993
166,369
164,447
182,771
187,153
Normalized earnings
75,303
87,658
98,664
107,330
116,105
Profitability (%)
equipment
150,978
177,549
190,789
189,157
186,776
EBITDA margin
Other assets
107,988
150,603
139,596
137,672
139,405
582,179
593,497
616,931
Investments
4.7
33.0
3.8
-6.9
2.4
-55.6
385.3
-60.0
9.3
17.2
13.8
15.6
12.0
12.0
12.5
6.2
9.2
5.3
5.8
6.0
EBIT margin
3.5
6.4
2.1
2.7
3.0
629,439
Normalized profit margin
0.7
3.2
1.2
1.2
1.3
Net profit margin
2.6
3.2
3.0
2.6
2.5
Plant, property &
Total assets
Gross profit margin
494,263
Short-term loans
106,750
111,952
104,023
115,362
111,956
Accounts payable
28,022
31,562
34,837
37,869
40,667
Normalized ROA
0.6
2.5
1.0
1.0
1.2
Current maturities
30,724
23,480
25,251
25,832
25,351
Normalize ROE
2.6
11.0
3.5
3.7
4.1
Other current liabilities
20,795
23,504
26,507
24,373
26,323
Normalized ROCE
4.8
7.5
2.6
3.5
4.1
Total current liabilities
186,291
190,499
190,618
203,437
204,297
Risk (x)
Long-term debt
D/E
2.8
2.9
2.2
2.2
2.1
Net D/E
2.4
2.6
2.0
2.0
2.0
10.9
8.3
13.0
11.5
10.5
120,299
177,295
159,018
157,018
158,930
Other non-current liab.
13,948
20,679
17,218
21,665
23,398
Total non-current liab.
134,247
197,974
176,237
178,684
182,328
Net debt/EBITDA
Total liabilities
Per share data (Bt)
320,538
388,473
366,855
382,120
386,625
Registered capital
7,743
7,743
9,292
9,292
9,292
Reported EPS
1.43
1.90
1.77
1.65
1.69
Paid up capital
7,743
7,743
8,611
8,611
8,611
Normalized EPS
0.39
1.90
0.68
0.75
0.88
Share premium
43,925
43,929
57,299
57,299
57,299
EBITDA
3.38
5.53
3.08
3.63
4.06
821
821
929
929
929
15.03
17.27
19.51
20.46
21.39
Retained earnings
63,876
81,205
86,176
94,344
102,348
0.75
0.95
0.75
0.70
0.76
Minority Interests
57,360
60,009
58,627
58,627
58,627
1.0
1.0
1.0
1.0
1.0
173,725
193,706
211,642
219,810
227,814
P/E
17.2
12.9
13.8
14.9
14.5
Norm P/E
62.4
12.9
35.8
32.7
27.9
1.6
1.4
1.3
1.2
1.1
18.1
12.7
20.9
18.3
16.5
3.1
3.9
3.1
2.9
3.1
Legal reserve
Shareholders' equity
Book value Dividend Par Valuations (x)
P/BV EV/EBITDA Source: Company data, FSS research
Dividend yield (%)
Page 2 of 4
Finansia Syrus Securities Public Company Limited Head Office
Thaisummit Tower
Alma Link
Amarin Tower
Central Pinklao 1
999/9 The offices at Central World 18th, 25th Fl., Rama 1 Rd., Patumwan, Bangkok
1768 Thaisammit Tower Building, 5th, 31th Fl., New Petchburi Road, Bangkapi, Huaykwang, Bangkok
9th, 14th, 15th Fl., Alma Link Building 25 Soi Chidlom, Ploenchit, Lumpini, Patumwan, Bangkok
496-502 Amarin Tower 20th Floor, Pleonchit, Lumpini, Pathumwan, Bangkok
7/129-221 Central Pinklao Office Building, Room 2160/1, 16th Fl., Baromratchonnanee Road, Arunamarin, Bangkoknoi, Bangkok
Bangkapi
Bangna
Sindhorn 1
Kian Gwan (Sindhorn 2)
Sindhorn 3
3105 N Mark Building, 3rd Floor, Room A3R02, Ladprao Road, Klongjan, Bangkapi, Bangkok
589 Tower 1 Office, 19th Floor, Room 589/105 Moo 12, Bangna-Trad Road, Bangna, Bangkok
130-132 Sindhorn Building 1, 2rd Floor, Wireless Road, Lumpini, Pathumwan, Bangkok
140/1 Kian Gwan House II 18th Floor, Wireless Road, Lumpini, Pathumwan, Bangkok
130-132 Sindhorn Building 3, 19th Floor, Wireless Road, Lumpini, Pathumwan, Bangkok
Ladprao
Prachachuen
Rang sit
Abdulrahim
Rattanatibet
555 Rasa Tower 2, 11st Floor, Unit 1106, Phaholyothin Road, Chatuchak, Bangkok
105/1 B Building, 4th Floor, Thessabansongkhrao Road, Ladyao, Jutujak, Bangkok
1/832 Moo 17 Kukod, Lumlookka Pratumtanee
990, Abdulrahim Place, 12nd Fl., Room 1210, Rama IV Road, Silom, Bangrak, Bangkok
576 Rattanatibet Road, Tumbon Banggrasor, Aumphoe Muang, Nonthaburi
Sriracha
Khonkaen 1
Khonkaen 2
Khonkaen 3
Udonthani
135/99 (G fl.) Sukumvit Road, Tumbon Sriracha Aumphoe Sriracha, Chonburi
311/16 2nd Floor, Klangmeung Road, Tumbon Nai Meung, Aumphoe Meung, Khonkaen
26/9 Moo 7, 2nd Floor Sri Chant Mai Road, Tumbon Nai Meung, Aumphoe Meung Khonkaen, Khonkaen
311/1 Khang Meung Road, Tumbon Nai Meung, Aumphoe Meung Khonkaen, Khonkaen
197/29, 213/3 Udon Dusadee Road, Tumbon Mak Khaeng, Aumphoe Muang Udon Thani, Udon Thani
Chiangmai 1
Chiangmai 2
Chiangmai 3
Chiangrai
Measai
308 Chiang Mai Land,
310 Chiang Mai Land,
Maliplace Building 32/4 moo 2
Chang Klan R., Chang Klan
Chang Klan R., Chang Klan
1 fll., Room B1-1, B1-2
Muang Chiangmai
Muang Chiangmai
Tumbon Maehia Chiangmai
353/15 Moo 4, Tumbon Rimkok Aumphoe Muang, Cheangrai
119 Moo 10, Tumbon Maesai, Aumphoe Muang, Cheangrai
Nakornratchasima
Samutsakorn
Phuket
Hatyai 1
Hatyai 2
1242/2 Room A3, 7 fl., The Mall Ratchasima
813/30 Norrasing Road, Tumbon Maha Chai, Aumphoe Meungsamutsakorn, Samutsakorn
22/18 Luangporwatchalong Road, Tumbon Talad Yai, Amphoe Muang Phuket, Phuket
200/221, 200/223 Juldis Hadyai Plaza, 2rd Floor, Building, Niphat Uthit 3 Road, Aumphoe Hadyai, Songkhla
106 Prachathipat Road, Aumphoe Hadyai, Songkhla
Hatyai 3
Trang
Suratthani
Pattane
200/222, 200/224, 200/226 Juldis Hadyai Plaza, 2rd Floor, Building, Niphat Uthit 3 Road, Aumphoe Hadyai, Songkhla
59/28 Huaiyod Road, Tumbon Thaptieng, Aumphoe Meungtrang, Trang
173/83-84 Moo 1 Watpho-Bangyai Road., Tumbon Makamtia, Aumphoe Mueang, Suratthani
300/69-70 Moo 4, Tumbon Rusamirae, Aumphoe Meung, Pattane
Mittraphap rood Tumbon Nai Muang Aumphoe Muang Nakornratchasima
Nakornratchasima
Recommendation Definitions BUY HOLD SELL TRADING BUY OVERWEIGHT NEUTRAL UNDERWEIGHT
The The The The The The The
latest close is below our target price and the estimated upside is 10% or more. latest close is below our target price and the estimated upside is 0-10%. latest close is above our target price. latest close is above our target price but the price is expected to be driven by short-term positive factors estimated return is higher than the market average. estimated return is the same as the market average. estimated return is lower than the market average
Note: The expected return may change as market risks increase or decline. DISCLAIMER: This report has been prepared by Finansia Syrus Securities Public Company Limited (FSS). The information herein has been obtained from sources believed to be reliable and accurate; however FSS makes no representation as to the accuracy and completeness of such information. Information and opinions expressed herein are subject to change without notice. FSS has no intention to solicit investors to buy or sell any security in this report. In addition, FSS does not guarantee returns nor price of the securities described in the report nor accept any liability for any loss or damage of any kind arising out of the use of such information or opinions in this report. Investors should study this report carefully in making investment decisions. All rights are reserved. This report may not be reproduced, distributed or published by any person in any manner for any purpose without permission of FSS. Investment in securities has risks. Investors are advised to consider carefully before making investment decisions. Finansia Syrus Securities Public Company Limited may act as market maker and issuer of DWs. The company may prepare the research reports on those underlying securities. Investors should carefully read the details of the derivative warrants in the prospectus before making investment decisions.
Page 3 of 4
Thai Institute of Directors Association (IOD) – Corporate Governance Report Rating 2017
Sc ore Range
Rating
Desc ription
100-90
Excellent
80-89
Very Good
70-79
Good
60-69
Satisfactory
50-59
Pass
<50
no logo given
n/a
IOD (IOD Disclaimer) The Corporate Governance Report (CGR) of Thai listed Companies is based on a survey and assessment of information which companies listed on the Stock Exchange of Thailand and the Market for Alternative Investment (“listed companies”) disclose to the public. The CGR is a presentation of information from the perspective of outsiders on the standards of corporate governance of listed companies. It is not any assessment of the actual practices of the listed companies, and the CGR does not use any non-public information. The CGR is not therefore an endorsement of the practices of the listed companies. It is not a recommendation for investment in any securities of any listed companies or any recommendation whatsoever. Investors should exercise their own judgment to analyze and consider any information relating to the listed companies presented in this CGR report. No representation or warranty is made by the Institute of Directors or any of its personnel as to the completeness or accuracy of the CGR report or the information used.
---------------------------------------------------------------------------------------------------------------------------------------------------------------------------------------------
Thailand's Private Sector Collective Action Coalition Against Corruption programme (Thai CAC) 1 CG Score 2017 from Thai Institute of Directors Association (IOD) 2 Companies participating in Thailand's Private Sector Collective Action Coalition Against Corruption programme (Thai CAC) under Thai Institute of Directors (as of July 31, 2017) are categorised into: - companies that have declared their intention to join CAC, and - companies certified by CAC.
Page 4 of 4