Consumption Dynamics During the Great Recession David Berger Northwestern University
Joseph Vavra Chicago Booth
4/27/2012
Abstract
Abstract The decline in durable expenditures was a central feature of the Great Recession, yet business cycle models typically abstract from durable consumption or assume that it is costless for households to adjust their durable holdings. We construct a heterogeneous agent business cycle model with …xed costs of durable adjustment and show that this model better matches consumption dynamics over the business cycle than models with costless durable adjustment. Furthermore, …xed costs of durable adjustment induce impulse response functions (IRFs) that are non-linear, history dependent and procyclical. Our estimates imply that during the Great Recession, durable expenditures were half as responsive to additional stimulus as during the 1990s. The procyclical IRF in the model is driven by changes in the distribution of households’desired durable holdings over the cycle. We test our model by estimating this distribution empirically with PSID microdata and …nd that it changes cyclically as quantitatively predicted by our model. Finally, we show that our model’s time-varying IRF is consistent with aggregate time-series evidence, in contrast to models with costless durable adjustment. JEL Classi…cation: E21, E32, D91 Keywords: Durables, Fixed Costs, Consumption, Non-linear Impulse Response
We would like to thank Ian Dew-Becker, Eduardo Engel, Giuseppe Moscarini, Aysegul Sahin, Tony Smith and participants at Yale seminars for valuable comments. Correspondence:
[email protected].
1
Figure 1: 2007 Recession 0 -2
Percentage Change
-4
-6
-8 -10
-12
Non-Durable Expenditures Durable Expenditures GDP
-14
-16 2007q4
1
2008q2
2008q4
2009q2
2009q4
Introduction
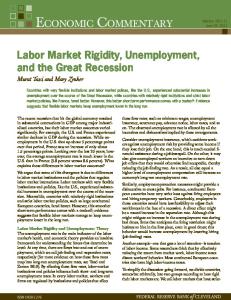
The business cycle patterns of durable expenditures are markedly di¤erent from those of nondurable expenditures.
Figure 1 displays the decline in durable expenditures (including residential
investment), non-durable expenditures1 and GDP2 during the Great Recession which began in 2007.3 The decline in durable expenditures was four times larger than the decline in non-durable expenditures. Overall, the decline in durable expenditures accounted for more nearly half of the decline in GDP in 1 We de…ne durable expenditures as NIPA durable expenditures + residential investment. The BEA treats durable and residential investment di¤erently, including housing services in GDP while excluding durable services. In both our model and data analysis, we de…ne GDP as the sum of non-durable expenditures excluding housing services, consumer durable expenditures, and private domestic investment. See Appendix 1. 2 All series are hp…ltered with smoothing parameter 1600. 3 See Petev, Pistaferri, and Eksten [2012] for additional discussion of the behavior of consumption during the Great Recession.
2
the most recent recession. This large volatility of durable expenditures is a general feature of U.S. business cycles4 : from 1960-2010 the standard deviation of durable expenditures relative to GDP is 3.02 while the standard deviation of non-durable expenditures to GDP is 0.55. Thus, explaining the behavior of durable expenditures is essential for explaining business cycles.
In particular, Leamer
[2007] argues that "housing IS the business cycle". Despite the importance of durables in accounting for output ‡uctuations, durables are rarely included in standard business cycle models leaving open the question whether standard models can match these facts. In this paper, we build a heterogeneous agent business cycle model with …xed costs of durable adjustment and show that this model is more successful at matching consumption dynamics than are simpler models that assume frictionless durable adjustment. In particular, we argue that our model with …xed costs better matches consumption dynamics along several dimensions: (1) It provides a better …t for the average business cycle volatility of durable and non-durable expenditures. (2) It better match the signi…cant history dependent sensitivity of durable expenditures to aggregate shocks that we document using time-series data. (3) It better matches the behavior of household durable purchases observed in microdata. We begin by …rst exploring business cycle models with no costs of durable adjustment.
We
show that these models generate durable expenditures that are much too volatile and non-durable expenditures that are much too smooth. In addition, we simulate the Great Recession in these models and …nd that the simulated percentage decline in durable expenditures is an order of magnitude too large. At the same time, the decline in non-durable expenditures in the model is only two thirds of that observed in the data. Durable expenditures are extremely volatile in these models due to standard stock-‡ow considerations: households’ utility depends on the stock of durables, and since durables do not depreciate fully from period to period, large decreases in durable expenditure can be consistent with only small decreases in the durable stock.5 At the same time, non-durable consumption is very smooth because 4 The following statistics may appear slightly di¤erent from standard business cycle statistics. This again is because, unlike the BEA, we treat consumer durables and housing symmetrically in our GDP calculations. Overall our conclusions are not sensitive to this treatment of the data. 5 This is the same mechanism that generates ampli…cation of investment volatility relative to GDP in the standard RBC model. See e.g. King and Rebelo [1999]. For example, in the data, the real value of the durable stock is nearly 10 trillion dollars. A 1% reduction in non-durable consumption and the durable stock must lead to a decline in durable
3
the large stock of wealth in the U.S. economy relative to average non-durable expenditures allows for lots of consumption smoothing. In addition, in the models, households want to maintain a constant ratio between their non-durable consumption and their durable stock. This implies that most extensions of the model that dampen the volatility of durable expenditures also dampen the volatility of non-durable expenditures. Thus, an improvement in the model …t along one dimension of consumption leads to a worsening along the other. In order to match the behavior of consumption over the business cycle, we must look for a mechanism that ampli…es non-durable volatility while dampening durable volatility. While a standard …x that improves the model’s performance along this dimension is the addition of quadratic adjustment costs, these adjustment costs are inconsistent with the substantial degree of lumpiness observed in durable purchases using microdata.
Furthermore, matching this micro
evidence is crucial for matching the history dependent response of durable expenditures to aggregate shocks over the business cycle. In particular, we provide aggregate time-series evidence that shows the sensitivity of aggregate durable expenditures to shocks is varies over the business cycle:
after
long expansions, durable expenditures are substantially more responsive to aggregate shocks than after recessions. Thus, while quadratic adjustment costs can help the model …t along the volatility dimension, they do not help the model match this time-series evidence and are thus unlikely to be useful for policy analysis over the business cycle. Instead, we introduce more realistic …xed costs of durable adjustment into the model and show that they dramatically improve the model …t along all dimensions. Unsurprisingly, durable adjustment costs dampen the volatility of durable expenditures, although generating the proper degree of dampening could have required unrealistically large adjustment costs. What is perhaps less obvious is that, while the addition of durable adjustment costs dampens durable volatility, it ampli…es the volatility of non-durable expenditures.
This is because we calibrate our model to match the frac-
tion of household wealth held in durables, and when we add …xed costs of durable adjustment, this portion of wealth becomes illiquid. It is no longer optimal for households to frequently adjust their durable holdings in order to smooth non-durable consumption. Holding aggregate wealth constant investment of 100 billion dollars, or roughly a 25% reduction in quarterly durable investment relative to an average rate of around 400 billion dollars.
4
while increasing the fraction of that wealth that is illiquid means that more households are e¤ectively borrowing constrained.
These households are similar to the "wealthy hand-to-mouth" consumers
generated in Kaplan and Violante [2011].6
In their model, households can hold a liquid low-return
asset or a high-return illiquid asset that carries a transaction cost. While they associate this illiquid asset with e.g., housing, they do not model the particulars that generate these higher returns.
In
contrast, since our model explicitly models illiquid durables, we generate additional predictions about the dynamic response of durables to shocks.
Our model implies strong interactions between the
cross-sectional distribution of household durable holdings and the response to aggregate shocks across time. Fixed costs of adjustment introduce non-linearities into household durable purchase decisions, and these non-linearities do not disappear with aggregation.
This implies that aggregate durable
expenditures exhibit non-linear, history dependent impulse responses to aggregate shocks.
After
a long expansion, pent-up durable demand rises, which means that many households are on the verge of adjusting their durable holdings. This makes aggregate durable expenditures more sensitive to aggregate shocks than after a recession, when fewer households are near the margin of durable adjustment. The magnitude of the time-varying impulse response is quantitatively large.
We simulate the
impulse response of durable expenditures at the end of the Great Recession and compare it to the impulse response at the end of 1999. We …nd that the impulse response during the Great Recession is less than half the response to the same shock during the 90s boom.7
This has important policy
implications since the impulse response computed from a linear VAR will substantially understate the true response during booms and substantially overstate the response during recessions.
Given
the importance of this time-varying impulse response, we search for additional evidence of this model mechanism, both using household microdata as well as using aggregate time-series data. R Mechanically, time t aggregate durable expenditures are given by Xt = di;t di;t ht where the "durable gap" di;t
di;t
di;t
di;t is the di¤erence between household i’s current durable stock,
6 Campbell
and Hercowitz [2009] has a similar mechanism. our model mechanism generates procyclical responsivenss to policy shocks is important in light of the separate literature arguing that in the presence of a binding zero lower, the e¤ectiveness of …scal stimulus should be countercyclical . 7 That
5
Figure 2: Distributions and Hazards Model Vs. PSID Model 2.5
1 Boom (1999) Recession (2009) 0.75
1.5 0.5 1 0.25
0.5 0 -0.3
Hazard
Density
2
-0.15
0 Durable Gap
0 0.35
0.15
PSID data 2.5
1 Boom (1999) Recession (2009) 0.75
1.5 0.5 1
Hazard
Density
2
0.25
0.5 0 -0.5
-0.25
0 Durable Gap
di;t , and the stock it would choose if it adjusts, di;t , and ht
0.25
di;t
di;t
0 0.5
is the adjustment hazard as
a function of the durable gap.8 The top panel of Figure 2 shows how this distribution and hazard move over time in our benchmark model. The time-varying impulse response in our model is driven by variation over the business cycle in the cross-sectional distribution of household durable gaps and adjustment hazards, and so we attempt to directly test this implication by estimating the distribution of gaps and hazards using PSID microdata.
The obvious complication with this procedure is that di;t , is unobserved in the
data. However, we can exploit restrictions from the structural model to generate a mapping between variables that we do observe in the data and di;t . This allows us to use PSID data to estimate the distribution of gaps as well as the empirical adjustment hazard as a function of these gaps to directly test our model. The bottom panel of Figure 2 shows that the resulting estimates using PSID data line up remarkably well with our model. 8 For
simplicity, we are ignoring maintenance at the moment.
6
Finally, we also look for additional evidence of time-varying impulse responses using aggregate time-series data.
In the model, durable expenditures become more responsive to shocks during
booms than during recessions.
This implies that the model with …xed costs exhibits conditional
heteroscedasticity: aggregate durable expenditures become more volatile in booms, as the sensitivity of expenditures to shocks rises. In contrast, models with ‡exible durable adjustment do not imply similar time varying sensitivity. As in Bachmann, Caballero, and Engel [2010], we test this implication using time-series data on aggregate durable expenditures. Consistent with the model, we …nd that the sensitivity of durable expenditures to shocks is substantially larger during booms than during recessions. Thus, in addition to providing a better …t for average business cycle statistics than models with frictionless durable adjustment, our model with …xed costs also provides a better …t for other dynamic patterns of consumption as well as for household level microdata. There is a long line of literature studying models with durable consumption. Baxter [1996] investigates the implications of durables for business cycles in a two-sector representative agent framework. Mankiw [1982], Bernanke [1985] and Caballero [1990] study the implications of durables for test of the permanent income hypothesis, again in a representative agent framework. Bertola and Caballero [1990], Caballero [1993] and Eberly [1994] investigate stylized heterogeneous agent durables models with …xed cost of adjustment and argue that …xed costs can help explain aggregate dynamics. Leahy and Zeira [2005] and Browning and Crossley [2009] argue that the timing of durable purchases can insulate non-durable purchases from shocks.9 However, these papers must make strong assumptions to obtain analytical results or to simplify the analysis, and are thus less useful for quantitative analysis. In addition our estimation of time-variation in household durable holdings builds on Eberly [1994] as well as Attanasio [2000] who estimate the distribution of households’ desired vehicle holdings in more stylized (S,s) models. However, we have a more realistic, general equilibrium model, and the restrictions necessary to estimate these earlier papers do not hold in our model.
Furthermore, we
show that, as in our model, the microdata implies an upward sloping adjustment hazard as a function of a households’current durable gap in contrast to the single (S,s) threshold imposed in these earlier 9 While this insulation margin is active in our model, we …nd that it is quantitatively small relative to the illiquidity e¤ect.
7
papers. More recent work has studied durable consumption in quantitative life-cycle models. Dunn [1998] models the relationship between unemployment risk, durables purchases and the life-cycle. Krueger and Fernandez-Villaverde [2010] argues that durables can help explain life-cycle pro…les of wealth holdings, Diaz and Luengo-prado [2010] shows that durables can help explain the wealth distribution in the U.S., and Bajari, Chan, Krueger, and Miller [2010] estimates a micro model of housing demand. In a partial equilibrium model, Luengo-prado [2006] shows that durables can help explain excess smoothness and volatility consumption puzzles. Perhaps most related is a recent working paper, Iacoviello and Pavan [2009]. They build a similar incomplete markets model with …xed costs of housing adjustment and aggregate shocks, however they focus on di¤erent questions. While our model is in…nite horizon, they instead build a life-cycle model, and computational considerations then require an annual rather than quarterly frequency. As such, their model is less suited for examining business cycle dynamics. They instead focus on explaining secular changes in aggregate volatility. The remainder of the paper proceeds as follows:
Section 2 presents data on the behavior of
durable and non-durable consumption during the most recent recession. We then provide time-series evidence that durable expenditures display time-varying sensitivity to aggregate shocks from 19602010. Section 3 presents our representative agent model, calibration and business cycle results. In Section 4 we describe our heterogeneous agent model and show that adding …xed costs improves the …t in the most recent recession. Section 5 discusses the model’s implications for time-varying impulse responses and estimation using PSID data, Section 6 discusses time-varying credit conditions and relative price movements, and Section 7 concludes.
8
2
Consumption Dynamics
Figure 1 shows the percentage change in detrended10 output, consumption of durables and consumption of non-durables, beginning in the fourth quarter of 2007. We de…ne non-durable consumption as BEA "non-durable goods" + "services" - "housing services", and we de…ne durable consumption as "durable goods" + "residential investment". GDP is de…ned as these consumption expenditures plus private non-residential investment.11 Table 1 Decline Relative to Trend in 2007 Recession GDP
Non-Durable
Durable
5.8%
3.7%
15.2%
Table 1 shows the decline in GDP, durable and non-durable spending over the most recent recession. The decline in durable expenditures in the most recent recession accounted for more almost half of the total decline in GDP, despite the fact that the level of durable spending was only 24% of GDP in 2007q4.
These numbers are constructed using an HP Filter 1600 trend.
not feature growth, we believe detrended numbers are most relevant.
Since our model does
Nevertheless, we have also
constructed similar numbers using linear or no detrending, and results are similar.12 While we believe that understanding the behavior of durable expenditures is very important for this recession, the general patterns hold across previous business cycles. Figure 3 shows the behavior of GDP and disaggregated consumption across time.13 1 0 Hp …ltered with smoothing parameter 1600. Other detrending methods produced similar results. Without detrending, non-durable consumption continued to rise for several quarters into the recession. Since our model does not have trend growth, we believe that detrended data is the appropriate model comparison. 1 1 To be consistent with our model, we are excluding government spending and net exports from our calculations, but the results are not dramatically altered by their inclusion. 1 2 The level of the declines is altered substantially using di¤erent detrending, but the relative declines, which are the focus of our paper are similar. 1 3 From this graph it may appear that durable expenditures are less important for modern business cycles than for recessions in the mid 80s. However, while the volatility of durable expenditures has decreased, the size of durable expenditures as a fraction of GDP has grown, so that the total variance of GDP explained by durables has risen over time.
9
Figure 3: Consumption Over the Business Cycle 0.2 Non-Durable Expenditures Durable Expenditures GDP
0.15
0.1
Deviation from Trend
0.05
0
-0.05
-0.1
-0.15
-0.2
-0.25 1960q1
1970q1
1980q1
1990q1
2000q1
2010q1
Table 2 shows that, overall, both non-durable consumption and durable consumption are very procyclical, but durable expenditures are three times more volatile than GDP while non-durable expenditures are moderately less volatile than GDP. The last column of Table 2 shows that similar results obtain when comparing raw growth rates rather than deviations from trend.
Table 2 Business Cycle Statistics Relative
Contemporaneous
Relative
Standard
Standard
Auto-
Correlation
Std. Dev.
Deviation
Deviation
Correlation
with Output
Growth Rate
Output
0.023
1.00
0.90
1.00
1.00
Durable
0.070
3.04
0.90
0.89
3.08
Non-Durable
0.013
0.57
0.88
0.94
0.61
10
Figure 4: Conditional Heterscedasticity 1.6
Heteroscedasticity
1.4
1.2
1
0.8
0.6
0.4
0.015
0.016
0.017
0.018
0.019
0.02
0.021
Average Lagged Id/D
In addition to these standard business cycle statistics, we present evidence that durable expenditures are more responsive to aggregate shocks after long expansions than during recessions.
As
in Bachmann, Caballero, and Engel [2010], we estimate a two-stage time-series model. In the …rst stage, we estimate an AR process for durable expenditures, and in the second stage, we regress the absolute value of the residuals from the …rst stage on the average of lagged durable expenditures. (See Appendix 1 for details).
We …nd clear evidence that aggregate durable expenditures exhibit
conditional heteroscedasticity. Figure 4 shows that residual variance rises dramatically with previous durable expenditures. At the peak of the nineties boom (when durable investment rates were very high), the residual variance was 50% larger than at the trough of the 2007 recession (when durable investment rates were very low).14 In principle, conditional heteroscedasticity could arise for two reasons: (1) The economy is subject to shocks of constant variance but durable expenditures respond more to these shocks during booms 1 4 Bootstrapped
90 percent con…dence interval in gray.
11
than during recessions. (2) The size of shocks during booms is greater than the size of shocks during recessions. While durable expenditures exhibit substantial conditional heteroscedasticity, aggregate non-durable expenditures do not exhibit similar properties. Since the shocks a¤ecting durable and non-durable expenditures should be similar, we interpret conditional heteroscedasticity of durable expenditures as evidence of the …rst explanation: durable expenditures become more responsive to aggregate shocks during business cycle booms. In the following sections, we will argue that conditional heteroscedasticity is implied by our model with …xed costs of durable adjustment while models with ‡exible durable adjustment or convex adjustment costs do not yield heteroscedasticity. This is because in the presence of …xed adjustment costs, the response of aggregate durable expenditures to shocks depends on the fraction of households that choose to adjust at each date.
After a long business cycle expansion, households have more
pent-up demand for durables and so there are more households on the margin of adjustment. This in turn increases the responsiveness of aggregate durable expenditures to shocks. Since housing adjustment is likely to exhibit larger transaction costs than is the adjustment of consumer durables, it should exhibit greater conditional heteroscedasticity if such heteroscedasticity is indeed driven by …xed costs of adjustment.
Consistent with the mechanism in our model, we
estimate heteroscedasticity separately for consumer durables and housing investment and …nd that there is substantially more heteroscedasticity in residential investment than in consumer durables. (Again see Appendix 1 for details). To what extent are business cycle models of consumption consistent with these facts? We begin with a simple representative agent model and examine its implications for aggregate consumption dynamics.
3
A Representative Agent Model with Durables
We integrate durable consumption into an otherwise standard RBC model with exogenous labor supply,15 and evaluate its ability to match aggregate dynamics of consumption. The planner problem 1 5 While it is straightforward to add labor supply, it barely alters the conclusions and it makes comparisons with the incomplete markets model more di¢ cult since computational considerations reduce the feasibility of introducing labor
12
solves:
max
Ct ;Kt+1 ;Dt
E
= Zt Kt H 1
log Zt
=
log Zt
1
Ctv Dt1 1
t
t=0
s:t: Ct + Dt + Kt+1
1 X
+ (1 +
k )Kt
v 1
+ (1
1
!
d )Dt 1
t:
The …rst order conditions and equilibrium characterization are standard, so we leave the details to Appendix 2. Table 3 contains the benchmark parameters, most of which are standard in quarterly business cycle calibrations.
Table 3 Model Parameters Parameter
RBC
No Fixed Cost
With Fixed Cost
0.99
0.987
0.986
0.95
0.95
0.95
0.008
0.088
0.008
0.3
0.3
0.3
k
0.022
0.022
0.022
d
0.022
0.022
0.022
2
2
2
0.73
0.74
0.73
0.33
0.33
0.33
N/A
0.975
0.975
N/A
0.1
0.1
N/A
0
0.025
z
h
f supply in that model.
13
The discount rate is picked to generate a quarterly interest rate of 1%, and we assume an intertemporal elasticity of substitution16
of 2. The depreciation rate of capital
k
= 0:022 is set to match
the long-run average investment to capital ratio. The average depreciation rate of consumer durables is moderately higher than the depreciation rate of capital while the depreciation rate of residential capital is somewhat lower than that on capital, so in our benchmark results we impose an intermediate value and set
d
=
k.
If anything, this is an over estimate of the actual stock weighted depreciation
rate, but durable expenditures are even more volatile in the presence of lower depreciation rates, so we view our choice as a conservative one. The relative weight on non-durable consumption17 , v; is set to match the average ratio of non-durable consumption to investment in durables18 of 4.0. Appendix 2 discusses the sensitivity of our results to these parameter choices as well as to relaxing the Cobb-Douglas speci…cation for the utility function and shows that our results are very robust to a range of reasonable parameter choices. After solving the model, we then compute business cycle statistics. Table 4 shows that the RBC model generates durable expenditures that are almost an order of magnitude too large, relative to the data. Conversely, non-durable expenditures are not volatile enough. Overall, durable expenditures are 38 times more volatile than non-durable expenditures while they are only 5 times as volatile in the data. 1 6 In general, raising the elasticity of substitution makes both non-durable expenditures and durable expenditures less volatile. Since in our benchmark results we …nd that non-durable expenditures are not volatile enough while durable expenditures are too volatile, altering can improve the …t along one dimension but reduces the …t along the other. 1 7 In all results, we assume a Cobb-Douglas when weighting durable and non-durable consumption. We have also experimented with allowing for a CES speci…cation, and it did not change our qualitative conclusions. 1 8 The value of 4 may seem somewhat low relative to standard numbers from NIPA, but recall that our measure of non-durable expenditures excludes housing services while our measure of durable expenditures includes residential investment. Increasing the value of this target did not a¤ect any of our qualitative conclusions.
14
Table 4 Business Cycle Volatility Data
RBC
No Fixed Costs
With Fixed Costs
Standard
Standard
Standard
Standard
Deviation
Deviation
Deviation
Deviation
Relative to Y
Relative to Y
Relative to Y
Relative to Y
Durable
3.04
13.71
14.22
2.81
Non-Durable
0.57
0.36
0.40
0.51
While we think the overall business cycle statistics are informative, we are also interested in the ability of our models to match the behavior of consumption during the Great Recession. We believe that any business cycle model that is to be useful for policy analysis should be successful at matching the behavior of consumption during this period of dramatic upheaval. We simulate the Great Recession by picking a sequence of TFP shocks in the model to match U.S. time-series data19 together with an unanticipated 4 percent decline in the capital stock in 2008 quarter 4.20 We choose these particular shocks because we believe they map typical descriptions of the recession into the mechanisms of our model. The one time decline in the capital stock corresponds to a decline in household wealth while the decline in TFP that is fed into the model (perhaps driven by …nancial dislocations that are not modeled), leads to a decline in household earnings.
We pick
the magnitude of the capital shock to roughly match the declines in capital actually observed in the most recent recession. After the capital shock, all variables transition as usual under the model equilibrium. The upper panel of Figure 5 shows the response of GDP, non-durable and durable expenditures to the recession shock.
Clearly, the durable expenditure response dwarfs the response of GDP and is an order of
magnitude larger than that observed empirically in Figure 1. Since the decline in durable expenditure 1 9 Speci…cally, the shocks are the residuals estimated from the AR process for durable expenditures estimated in Appendix 1. Results are not particularly sensitive to …tting U.S. data using di¤erent shock processes. 2 0 We have also experimented with shocks to the durable stock, but we believe these map less naturally into the recession. The decline in housing value was largely a decline in the price of housing rather than a decline in the real stock of housing. Furthermore, large declines in the housing stock lead to counterfactual housing booms. In Section 6, we add movements in the relative price of durables and non-durables. In this extension, the relative price and thus value of the durable stock falls during the simulated recession even though there is no real shock to the stock of durables.
15
Figure 5: Recession Simulation RBC Model 50
Percentage Change
25 0 -25 Non-Durable Expenditures Durable Expenditures GDP
-50 -75 -100 -125 2007q4
2008q2
2008q4
2009q2
2009q4
0 Non-Durable Expenditures GDP
Percentage Change
-2
-4
-6
-8 2007q4
2008q2
2008q4
2009q2
2009q4
is so large, the lower panel plots non-durable expenditures and GDP separately. The peak-to-trough decline in non-durable expenditures is only 43% that of GDP, in contrast to the decline in the data which was 64% as large as GDP. Why is the decline in durable expenditures so large while the decline in non-durable expenditures is so small? Households get utility from the durable stock and from non-durable expenditures. Given the Cobb-Douglas speci…cation for utility,21 households want to maintain a constant ratio of C to D. Since D is by de…nition durable, a given decline in C must be matched by a much larger decline in durable expenditures. In general non-durable consumption varies little because households can use both K and D to smooth non-durable consumption.
Relative to a business cycle model that does
not distinguish between non-durable and durable consumption, non-durable consumption is a much smaller fraction of total wealth and is thus relatively easy to smooth. While it is possible to match the relative volatilities of non-durable and durable expenditures 2 1 See
Appendix 2 for discussion of the extension to CES.
16
by introducing quadratic adjustment costs into the RBC model, we view this as unsatisfactory for several reasons. First, there is substantial evidence of lumpy durable adjustment at the micro level which will not be replicated by convex adjustment costs.
There is ample evidence for …xed costs
of durable adjustment such as broker’s and titling fees, and we will argue that modeling these costs more explicitly matters for aggregate dynamics in a way that is not captured by quadratic adjustment costs.
In particular, we will show shortly that an RBC model with quadratic adjustment costs
does not generate the conditional heteroscedasticity that we observe in aggregate time-series data, in contrast to a model with …xed costs of durable adjustment.
4 4.1
Incomplete Markets Model Flexible Durable Adjustment
In the presence of borrowing constraints, some households will be liquidity constrained and their consumption patterns may be dramatically di¤erent from those who are unconstrained. Thus, we are interested in the implications of borrowing constraints for consumption dynamics. The benchmark incomplete markets model assumes that heterogeneous agents face uninsurable idiosyncratic shocks to their labor earnings and borrowing constraints, but is otherwise identical to the representative agent model. Households solve
max E
cit ;dit ;ait
X
s:t: cit
= wt h
ait log
i t
i t
0; dit =
log
t
0h B @
+ (1 + rt )ait
cit
v
dit 1
1
+ dit
1 1C A
i 1 v 1
(1
d)
N (0;
z );
1
0 i t 1
+ "it with "it
17
dit
ait
where cit , dit and ait are household i’s non-durable consumption, durable stock, and assets, respectively. i t
represents shocks to idiosyncratic labor earnings while wt and rt are the aggregate wage and interest
rate. A representative …rm rents capital and labor and its …rst order conditions pin down these prices:
wt
=
rt
=
)Zt Kt H 1
(1
1
Zt K t
H1
k
where as before, aggregate productivity evolves as an AR process
log Zt =
Z
log Zt
1
+
t:
As usual, equilibrium requires that the aggregate resource constraint
Ct + Dt + Kt+1 = Zt Kt H 1
+ (1
k ) Kt
+ (1
d ) Dt 1
be satis…ed, where
Kt
=
Dt
=
Ct
=
H
=
Z Z Z Z
ait
1
dit cit h it :
Solving the household problem requires forecasting aggregate prices and thus the aggregate capital stock, which is determined by the continuous distribution of household states, so as usual solving the model requires making computational assumptions.
Following Krusell and Smith [1998], we
conjecture that after conditioning on aggregate productivity, aggregate capital is a linear function of
18
current aggregate capital:22
Kt+1 =
0
(Z) +
1
(Z) Kt :
Given these assumptions, the in…nite horizon problem can be recast recursively as
V (a
1; d 1;
; Z; K)
=
v 1
cv d1 max c;d;a 1
+ E"; V (a; d; 0 ; Z 0 ; K 0 )
s:t: a
> 0
c = wh + (1 + r)a r
= Z K
w
= Z (1
K0
=
0
=
log Z 0
=
log
0
1
1
H1
+d
1
(1
d)
d
a
k
)K L
(Z) +
1
(Z) K
log + " Z
log Z +
We solve the model by conjecturing an aggregate law of motion, approximating the value function by linearly interpolating23 between continuous grid points, solving the contraction, simulating the household problem and updating the aggregate law of motion until convergence is obtained.
In
equilibrium, the aggregate law of motion is highly accurate. See Appendix 2 for additional details on the solution method. Table 3 shows the calibration for the incomplete markets model. Most of the parameter values are the same as in the RBC model.24 We again pick
and
to match a quarterly interest rate of 1%
2 2 The forecasting rule might also depend on the previous durable stock. An earlier version of this paper found that this added little explanatory power and had substantial computational cost. 2 3 We have found that linear interpolation gives speed advantages that make it attractive relative to cubic spline or other interpolation methods. While linear interopolation will introduce kinks into the value function, we do not rely on derivative based methods for solving the household problem, so this does not prove particularly problematic. 2 4 While computational complexity prevents a thorough battery of robustness checks, we have done extensive checks of robustness using the simpler RBC model. We are thus con…dent that the results in the more complicated models are also likely to be robust to a similarly wide range of parameter values.
19
Figure 6: Recession Simulation Incomplete Markets Model (Flexible Durable Adjustment) 25
Percentage Change
0 -25 -50 Non-Durable Expenditures Durable Expenditures GDP
-75 -100 -125 -150 2007q4
2008q2
2008q4
2009q2
2009q4
0
Percentage Change
-1
Non-Durable Expenditures GDP
-2 -3 -4 -5
-6 2007q4
2008q2
2008q4
2009q2
2009q4
and a ratio of non-durable expenditures to durable expenditures of 4. The idiosyncratic productivity process is calibrated to match the persistence and variance of annual labor earnings in PSID data. The implied persistence of idiosyncratic earnings is 0.975 while the standard deviation is 0.1. Table 4 shows that the incomplete markets model generates substantially higher volatility of nondurable consumption and is thus closer to the data than is the representative agent model. This is because borrowing constrained households are unable to smooth their consumption relative to income and so respond much more strongly to the business cycle. However, while non-durable expenditures are ampli…ed in the presence of borrowing constraints, the same logic also ampli…es the volatility of durable expenditures. Thus, the incomplete markets model is even worse at explaining the business cycle behavior of durables than is the RBC model. In addition to the standard business cycle statistics, we again simulate25 the Great Recession through the lens of our model and compare the model series to those in the data.26 2 5 Beginning
Figure 6
from the ergodic distribution, we simulate the same sequence of aggregate shocks as in the RBC model, together with a 4% decline in capital in 2008q4. 2 6 It’s worth noting that there is a potential computational complexity with this procedure. Our solution method
20
shows the response of GDP, and durable and non-durable expenditures.
Unsurprisingly, the …t
along the non-durable dimension is somewhat better while the ability of the model to match durable expenditures is worsened.
4.2
Fixed Costs of Durable Adjustment
Can realistic durable adjustment costs help to reconcile the model with the data? We assume that households face the following adjustment costs on their durable stock:
A(d; d
1)
=
8 > < 0 if d 2 ((1 > :
f (1
d) d 1; d 1) d) d 1
else
This speci…cation implies that households can maintain their durable stock or let part of it depreciate without paying an adjustment cost, but if they want to adjust their durable stock by larger amounts then they must pay a …xed adjustment cost. Thus, we allow households to engage in routine maintenance that does not incur a …xed cost but assume that they must pay a cost when actually buying or selling their current durable stock. We associate these …xed costs with explicit transaction costs27 together with time costs. This adjustment cost speci…cation lies between two extremes that are common in the literature. Under one extreme, households must pay the adjustment cost if d 6= d
1.
This speci…cation implies
that households cannot let their houses depreciate without paying a …xed cost. Alternatively, it is also common to assume that the adjustment cost occurs if d 6= (1
d) d 1:
Under this speci…cation,
households cannot maintain their durable stock without paying an adjustment cost.
While these
alternatives are somewhat simpler,28 we think that our speci…cation is likely to better capture the realities of the costs associated with durable adjustment. Nevertheless, we have experimented with these alternative speci…cations and it did not materially a¤ect our results. requires using Krusell-Smith methods to approximate the distribution of household states. While this approximation is highly accurate throughout the ergodic distribution, it is possible that approximations may be far from accurate following the one-time recession shock. However, we …nd that forecasts are only mildly worsened. See Appendix 2 for further discussion. 2 7 Brokers fees, titleing fees, etc. 2 8 In these extreme cases, when households choose to not buy or sell durables, the consumption decision becomes one dimensional. In our speci…cation, households must still choose how much to let the durable stock depreciate.
21
With this adjustment cost speci…cation, the aggregate resource constraint must now include adjustment costs
Ct + Dt + Kt+1 + At = Zt Kt H 1
where At =
Z
+ (1
k ) Kt
+ (1
d ) Dt 1 ;
A(di ; di 1 ):
The recursive formulation of the problem can now be written as
V (a
1; d 1;
; Z; K)
=
max V adjust (a
; Z; K) ; V noadjust
1; d 1;
with V adjust (a
1; d 1;
; Z; K)
=
max c;d;a
cv d1 1
v 1
+ E"; V (a; d; 0 ; Z 0 ; K 0 )
s:t: c = wh + (1 + r)a a > 0; V noadjust (a
1; d
1 ; ; Z; K)
1
+d
1
(1
d)
d
a
f (1
d) d 1
equilibrium conditions and prod. processes =
cv d1 1
max c;a; d2((1
d )d
1 ;d
1)
v 1
+ E"; V (a; d; 0 ; Z 0 ; K 0 )
s:t: c = wh + (1 + r)a a > 0;
1
+d
1
(1
d)
d
a
equilibrium conditions and prod. processes
We now approximate the value function of adjusting and not adjusting separately and then solve as before. Again, see Appendix 2 for additional details. We again calibrate
and
to match an interest
rate of 1% and a non-durable to durable expenditure ratio of 4. We set the …xed cost of adjustment at 2.5%, so that households lose 2.5% of their pre-adjustment durable stock when adjusting outside of the range of depreciation.29 2 9 This is one half of the value used by Diaz and Luengo-prado [2010], who report that the typical fee charged by real estate brokers in the U.S. economy is around 6%. Since the …xed cost of consumer durable adjustment are smaller, we pick a lower value for our benchmark. In our model, this implies a quarterly adjustment frequency of just under 3%
22
Figure 7: Recession Simulation with Fixed Costs Vs. Data Model with Fixed Costs 5
Percentage Change
0 -5 -10 -15
Non-Durable Expenditures Durable Expenditures GDP
-20 -25 2007q4
2008q2
2008q4
2009q2
2009q4
2009q2
2009q4
Data 0
Percentage Change
-5
-10
-15
-20
-25 2007q4
Non-Durable Expenditures Durable Expenditures GDP
2008q2
2008q4
After solving the model, we again compute business cycle statistics, which are displayed in Table 4. The model with …xed costs generates non-durable expenditures which are more volatile and durable expenditures which are less volatile than the previous models.
It is thus a dramatic improvement
over the models without adjustment costs. Figure 7 shows that, in contrast to the models ‡exible durable adjustment, the model now does a good job of reproducing the recession of 2007. GDP now declines by 6.5%, non-durable expenditures decline by 4% and durable expenditures decline by 24%. The relative decline in durable expenditures is still slightly too large, but the …t is remarkably close given that none of the declines are speci…cally targeted in the calibration. This is in marked contrast to the models with ‡exible durable adjustment that imply declines in durable expenditures that are an order of magnitude too large. Clearly, the presence of adjustment costs dampens the response of durable expenditures to aggreand that adjustment occurs on average every 8 years. While this is higher than the frequency of adjustment of housing it is somewhat lower than the frequency of consumer durable adjustment in the data. Our general conclusions were not sensitive to decreasing adjustment costs to 2% or raising adjustment costs to 10% as long as is recalibrated to maintain a constant ratio of non-durable to durable expenditures.
23
gate shocks. In addition, the model now matches the decline in non-durable expenditures. This is because the presence of adjustment costs on durables means that a fraction of household wealth is e¤ectively illiquid. Since we target the same level of total wealth in all models, a greater fraction of households are temporarily liquidity constrained in the model with …xed costs and thus illiquid wealth. These households are similar to the wealthy hand-to-mouth households emphasized in Kaplan and Violante [2011]. While households may have a large amount of total wealth, households rationally choose to avoid paying …xed costs associated with using illiquid wealth to smooth non-durable consumption. In their model, wealth is illiquid because households lock some wealth into a higher return investment while in our model, wealth is illiquid because households want to consume durables, which are subject to adjustment costs. While the general mechanism is similar, we have additional panel data on income, durable and non-durable expenditures and wealth, which allows us to test directly for this mechanism.30
5
Non-Linear Dynamics
In section 2, we showed that aggregate durable expenditures exhibit conditional heteroscedasticity: durable expenditures are more volatile towards the end of expansions than during recessions.
To
what extent are our models consistent with this time-series evidence? As in Bachmann, Caballero, and Engel [2010], Appendix 1 presents estimates of durable expenditure conditional heteroscedasticity for the model with …xed costs of durable adjustment as well as the models with no cost of durable adjustment and for an RBC model with quadratic adjustment costs. The model with …xed costs of durable adjustment implies conditional heteroscedasticity that is in line with the empirical estimates while the model with ‡exible durable adjustment exhibits no such conditional heteroscedasticity. Why does the model with …xed costs of adjustment imply heteroscedasticity despite the fact that the shocks hitting the model are of constant variance?
Fixed costs of adjustment imply that
the individual households’ response to aggregate shocks is highly non-linear.
Since households are
3 0 Previous versions of this paper explored the implications of this illiquid wealth for household level insurance using Italian Survey of Household Income and Wealth Data. In ongoing work, we explore these implications using PSID data.
24
Figure 8: Boom and Recession: Distribution and Adjustment Hazard 2.5
1 Boom (1999) Recession (2009)
2 0.75
0.5
Hazard
Density
1.5
1
0.25 0.5
0 -0.3
-0.15
0 Durable Gap
0 0.35
0.15
continuously hit with both aggregate and idiosyncratic shocks, in the presence of …xed costs of durable adjustment there is a gap between their current durable holdings and the durable holdings they would choose if they temporarily faced no adjustment costs. When this gap is small, it is not worth paying the …xed cost of adjustment. As this gap becomes large, it becomes optimal to pay the …xed cost. Thus, …xed costs of adjustment induce lumpy durable purchases, and changes across time in the fraction of households choosing to adjust can induce signi…cant time-variation in aggregate durable expenditures. R Mechanically, time t aggregate durable expenditures are given by Xt = di;t di;t ht di;t di;t where the "durable gap" di;t
di;t is the di¤erence between household i’s current durable stock
(after maintenance), di;t , and the stock it would choose if it adjusts, di;t , and ht
di;t
di;t
is the
adjustment hazard as a function of the durable gap.31 If more households choose to adjust in response to an aggregate shock, then aggregate durable expenditures will respond more strongly to the shock. Figure 8 plots the distribution of durable gaps and adjustment hazard in a boom and in a recession, 3 1 Where
the gaps and hazards are de…ned relative to durable holdings after maintenance so that Xt is durable investment excluding maintenance.
25
Figure 9: Boom and Recession: Impulse Response of Aggregate Durable Expenditures 3.5 Boom (1999) Recession (2009) 3
Percentage Change
2.5 2 1.5 1 0.5 0 -0.5
4
8
12
16
20
Quarter
for the model with …xed costs of durable adjustment. The distribution of durable gaps is skewed right because depreciation means that more households want to increase than to decrease durable holdings. During the boom, households’desired durable holdings rise so that the distribution of durable gaps shifts to the right.
As more households are now further from their desired level of durables, they
move into the region with a higher probability of adjustment. Since all households that adjust will respond to aggregate shocks, aggregate durable expenditures become more responsive to these shocks. This is ampli…ed by the increase in the probability of adjustment during a boom.
Households are
more likely to adjust up and less likely to adjust down for a given durable gap (as can be seen by the shifting hazard in Figure 8), and the net e¤ect is an increase in the probability of adjustment. (It is worth noting that aggregate durable expenditures become more responsive to both positive and negative aggregate shocks during a boom. During a boom, more households are in the region with a steep hazard of adjustment, and these households become more responsive to both positive and negative aggregate shocks).
26
Figure 9 shows the impulse response to a one standard deviation increase in TFP in 1999 and compares it to the impulse response calculated in a 2009.32
As suggested by the above discussion,
the impulse response is much larger during a boom than during a recession. The cumulative impulse response in 1999 is roughly twice that in 2009. Appendix 1 provides additional evidence of procyclical impulse response functions and compares model estimates to time-series evidence. Thus our model suggests that policies designed to simulate durable expenditures during recessions may have less e¤ect than suggested by linear VAR evidence that assumes there is no time-variation in the response to shocks. For example, both "Cash for Clunkers" and "First-Time Home Buyers Tax Credit" were enacted to stimulate durable expenditures during the most recent recession. However, if pent up durable demand was relatively low, then this may have dampened the e¤ectiveness of the programs. Conversely, if each program led to an increase in durable demand and pushed more households towards an active region of adjustment, then the total e¤ect of the two programs may have been greater than the sum of the individual programs in isolation.
We …nd support for such
non-linearities by computing the impulse response to TFP shocks of varying sizes.
We …nd that
doubling the size of the TFP shock roughly triples the cumulative impulse response to the shock. Given the import policy implications of these non-linearities, we now look for direct evidence that the cross-sectional distribution of household durable demand moves in the manner predicted by our model. The obvious di¢ culty with constructing an empirical counterpart to Figure 8 is that "durable gaps" are not observed in the microdata. However, our structural model imposes strong restrictions on the relationship between variables which are observed in microdata and durable gaps, which are observed in the model but not in the data.33 We use the model to estimate a ‡exible functional form that relates d
1 ; c; a
to the durable gap, and …nd that within the model these variables are su¢ cient
3 2 The hump-shaped IRFs eventually return to zero. Interestingly the hump-shape is consistent with the impulse response of aggregate durable expenditures to observed changes in TFP in the data. The hump-shape arises due to equilibrium movements in the interest rate across time. On impact, as TFP increases, interest rates rise, which increases …nancial income as well as the return to saving in liquid assets. So initially, most of the increase in savings goes into liquid assets. However, as additional capital is accumulated, the return to saving in liquid assets falls and households begin to accumulate more in durable assets so that the response of durable expenditures grows with time. As the TFP shock dies out, this process reverses itself and the economy returns to steady-state. 3 3 Our empirical strategy in general is similar to that in Eberly [1994], but we have a more complicated empirical model that does not require us to exclude borrowing constrained households. Furthermore, we test the predictive power of our estimated durable gaps for the actual probabilities of adjustment, and …nd an upward sloping adjustment hazard as predicted by our model. In contrast, Eberly [1994] imposes and estimates a single adjustment threshold.
27
to explain more than 99% of the variation in durable gaps. Once we have estimated the relationship in the model, we then apply the same relationship to measures of d
1 ; c; a
in PSID microdata, which
allows us to estimate an empirical cross-section of durable gaps for each of the sample years in the PSID from 1999-2009.
Finally, once we estimate the distribution of durable gaps in the data, we
then also compute the empirical adjustment hazard as a function of the estimated durable gaps. This provides an extremely strong test of whether our estimated durable gaps have predictive power for actual adjustment behavior and whether they shift over the business cycle in a manner consistent with our model.
See Appendix 3 for additional details on the estimation procedure and sample
construction. Figure 2 compares the estimates from the PSID data to the predictions from our model. Given that our model is abstracting from life-cycle considerations and many other idiosyncratic taste shocks that will a¤ect durable adjustment, the …t between the model and the data is remarkably strong. Our estimated durable gaps have strong predictive power for the probability of adjustment. The empirical probability of adjustment rises from approximately 20% for a durable gap of zero to more than 50% for a durable gap of 0.5. (While the adjustment probability of 20% at zero may appear to be a failure, it is worth noting that our measure of adjustment is calculated over a two-year period while our gap measure is instantaneous, so a positive probability despite a gap of zero may re‡ect a positive gap at some other point during the two year period which led to adjustment). In addition to these strong predictive power on average, we also …nd that both the empirical distribution of durable gaps as well as the corresponding adjustment hazards shift between 1999 and 2009 in a way that is remarkably consistent with our model.
Thus, there is strong empirical evidence that both the distribution of
households’ durable gaps and adjustment probabilities move in the manner necessary to generate a procyclical impulse response.34 3 4 While Figure 9 shows that the IRF on impact is only a partial summary of the di¤erences in the cumulative IRFs, we can nevertheless compute the IRF on impact implied by our empirical distribution of gaps and hazards (ignoring GE e¤ects) and we …nd that the implied IRF on impact is approximately 20 percent larger in 1999 than in 2009.
28
6
Model Extensions and Robustness
So far our model has abstracted from two features of durables that may be particularly important in the most recent recession:
tightening credit conditions and movements in the relative price of
durables. In this section we brie‡y investigate extensions of the model along these dimensions and argue that they do not have large impacts on our conclusions. Thus far we have assumed that there is no borrowing in the economy and that durables must be …nanced wholly with current spending.
Empirically, many durables are purchased with down
payments with the durable itself used as collateral for the loan.
In addition, there was a decline
in the relative price of durables during the most recent recession.
Since our utility speci…cation
implies that in the frictionless model, households have constant expenditure shares in durables and non-durables, relative price movements are a potentially powerful force. (However, it is worth noting that while the price of durables declined in the Great Recession, over the entire period from 1960present, the NIPA de‡ator for durables is actually countercyclical, so relative price movements are unlikely to explain overall business cycle volatilities).
Furthermore, there is reason to believe that
these two extensions may have important interactions: as the relative price of durables falls, the value of collateral falls, which tightens borrowing constraints. Endogenizing relative price movements is beyond the scope of this paper as it induces additional computational burden into an already challenging model. However, it is straightforward to introduce exogenous movements in the relative price of durables through an exogenous shock to the rate of transformation between durables and non-durables that is perfectly correlated with aggregate productivity. That is, we assume that the aggregate resource constraint is now given by
Ct + P (Zt ) Dt + Kt+1 + At = Zt Kt H 1
+ (1
k ) Kt
+ (1
d ) Dt 1
where P (Zt ) is increasing with Zt so that the relative price of durables is procyclical.35 In addition to this exogenous price change, we also introduce a collateralized borrowing constraint as in Diaz and Luengo-prado [2010]. Instead of a 3 5 Household
0 we assume that a
budget constraints are modi…ed accordingly.
29
(1
) P (Zt ) D where
is the required
downpayment. This speci…cation implies that there is an interaction between the price of durables and borrowing constraints.
As the price of durables falls, there is a direct price e¤ect that means
households want to hold more durables.
However, the decline in the price of durables also means
that the collateral value of durables falls so that holding durables becomes less attractive36 . These e¤ects work in opposite directions, so we again need the quantitative model. How do these extensions a¤ect consumption dynamics in the model? Before simulating the model, we must …x values for the new coe¢ cients. We set
= 0:33. This value is somewhat above typical
downpayments in the housing market and re‡ects the fact that it is more di¢ cult to get loans against other consumer durables.
We set the standard deviation of relative prices to be 1.5 times that of
TFP so that the relative price of durables falls by 1.5% in the recession simulation. This may initially seem like a small relative price decline relative to many discussions of the most recent recession, but it re‡ects several facts. First, residential investment is only approximately one-third of total durable expenditures, and consumer durable prices fell less in the most recent recession than did the price of housing. Second, NIPA de‡ators for residential investment as well as consumer durable expenditures are less volatile than the Case-Shiller Index and declined less in the recession.
Finally, both non-
durable and durable prices fell in the recession, so the change in the relative price is less than the individual decline. Figure 10 shows the simulated recession for the model with and without adjustment costs. Again, the model with …xed costs is markedly more successful. The model with …xed costs now generates a decline in durable expenditures that is moderately too large, but the decline is well within reasonable ranges, in contrast to the huge decline generated by the model with no adjustment costs. In addition, non-durables are now somewhat too volatile in the model with …xed costs of durable adjustment, but both volatilities can easily be improved with mild modi…cations of the benchmark parameters.
In
addition, the introduction of collateral constraints and relative price movements does not a¤ect our conclusions about the models’ability to match the heteroscedasticity observed in time-series data. Thus, this preliminary evidence suggests that relative price movements and time-varying borrowing constraints may have some mild quantitative implications for our results, but they are unlikely to 3 6 Guerrieri
and Lorenzoni [2011] similarly investigate the e¤ects of an exogenous tightening in credit constraints.
30
Figure 10: Great Recession Simulations with Collateralized Borrowing and Relative Price Movement Model with no Fixed Costs Percentage Change
200 100 0 Non-Durable Expenditures Durable Expenditures GDP
-100 -200 -300 2007q4
2008q2
2008q4
2009q2
2009q4
Model with Fixed Costs Percentage Change
20 Non-Durable Expenditures Durable Expenditures GDP
10 0 -10 -20 -30 2007q4
2008q2
2008q4
2009q2
2009q4
overturn any of our qualitative conclusions.
7
Conclusion
Durable expenditures are an important part of the business cycle, yet typical business cycle models abstract from durables entirely. Such models, by assumption, fail to account for the fact that a very large fraction of the most recent recession was explained by declines in durable expenditures. In this paper, we argue that simple extensions of these models that assume frictionless durable adjustment are no more successful at matching business cycle behavior. Business cycle models with frictionless durable adjustment imply a decline in durable expenditures in the most recent recession an order of magnitude larger than what was actually observed.
Furthermore, these models feature signi…cant
insulation of non-durable consumption so that the implied decline in non-durable expenditures is too low relative to that observed in the recession.
31
It is widely recognized that there are substantial …xed costs of durable adjustment. Nevertheless, business cycle models with …xed costs of durable adjustment have received limited attention due to their computational complexity. In this paper, we argue that while the introduction of …xed costs of adjustment is computationally challenging, it is not intractable, and it provides a signi…cantly better …t for both macro and micro dynamics. An incomplete markets model with …xed costs and aggregate shocks is able to match the decline in durable expenditures in the Great Recession as well as business cycle volatilities more generally.
In addition, since durable holdings are also a form of household
wealth, …xed costs of adjustment make a fraction of wealth illiquid and costly to adjust. Since some households have large durable holdings with small levels of liquid wealth, this ampli…es the response of non-durable consumption to shocks and implies that the model is able to match the relatively large decline in non-durable expenditures during the recession. More importantly, introducing realistic adjustment costs is important for evaluating the e¢ cacy of …scal stimulus. Fixed costs of durable adjustment induce signi…cant non-linear impulse responses of aggregate durable expenditures to shocks. Our estimates imply that during the Great Recession, durable expenditures were half as responsive to additional stimulus as during the late 90s. This timevarying IRF induces conditional heteroscedasticity in the time-series behavior of aggregate durable expenditures: the residuals from an AR regression on durable expenditures are greater during booms than during recessions.
We show that such conditional heteroscedasticity is present in actual U.S.
time-series data. The procyclical IRF in the model is driven by changes in the distribution of households’desired durable holdings over the cycle. During a boom, households have more pent-up durable demand and are more likely to adjust their durable holdings. We test this implications of our model by estimating the empirical distribution of household level desired during holdings using PSID microdata, and we …nd that the empirical distribution moves as predicted by our model. Thus, the microdata is consistent with a large time-varying IRF, as implied by our model.
32
References Attanasio, O. (2000): “Consumer Durables and Inertial Behavior: Estimation and Aggregation of (S,s) Rules for Automobile Purchases,” Review of Economic Studies. Bachmann, R., R. J. Caballero, and E. M. Engel (2010): “Aggregate Implications of Lumpy Investment: New Evidence and a DSGE Model,” Cowles Foundation Discussion Paper. Bajari, P., P. Chan, D. Krueger, and D. Miller (2010): “A Dynamic Model of Housing Demand: Estimation and Policy Implications,” Mimeo. Baxter, M. (1996): “Are Consumer Durables Important for Business Cycles?,” The Review of Economics and Statistics, 78(1). Bernanke, B. (1985): “Adjustment Costs, Durables and Aggregate Consumption,”Journal of Monetary Economics, 15(1). Bertola, G., and R. J. Caballero (1990): “Kinked Adjustment Costs and Aggregate Dynamics,” NBER Macroeconomics Annual, 5. Bertola, G., L. Guiso, and L. Pistaferri (2005): “Uncertainty and Consumer Durables Adjustment,” Review of Economic Studies, 72(4). Blundell, R., L. Pistaferri, and I. Preston (2008): “Consumption Inequality and Partial Insurance,” American Economic Review, 98(5). Browning, M., and T. Crossley (2009): “Shocks, Stocks, and Socks: Smoothing Consumption Over a Temporary Income Loss,” Journal of the European Economic Association, 7(6). Caballero, R. J. (1990): “Expenditure on Durable Goods: A Case for Slow Adjustment,” The Quarterly Journal of Economics, 105(3). (1993): “Durable Goods: An Explanation for Their Slow Adjustment,” The Journal of Political Economy, 101(2).
33
Campbell, J., and Z. Hercowitz (2009): “Liquidity Constraints of the Middle Class,” Federal Reserve Bank of Chicago Working Paper 2009-20. Diaz, A., and M. Luengo-prado (2010): “The Wealth Distribution with Durable Goods,” International Economic Review, 51(1). Dunn, W. (1998): “Unemployment Risk, Precautionary Saving, and Durable Goods Purchase Decisions,” . Eberly, J. C. (1994): “Adjustment of Consumers’ Durables Stocks: Evidence from Automobile Purchases,” Journal of Political Economy, 102(3). Guerrieri, V., and G. Lorenzoni (2011): “Credit Crises, Precautionary Savings, and the Liquidity Trap,” Mimeo. Iacoviello, M., and M. Pavan (2009): “Housing and Debt Over the Life Cycle and Over the Business Cycle,” Mimeo. Kaplan, G., and G. L. Violante (2010): “How Much Consumption Insurance beyond SelfInsurance?,” American Economic Journal: Macroeconomics, 2(4). (2011): “A Model of the Consumption Response to Fiscal Stimulus Payments,” NBER Working Paper 17338. King, R., and S. Rebelo (1999): “Resuscitating Real Business Cycles,” Handbook of Macroeconomics, 1. Krueger, D., and J. Fernandez-Villaverde (2010): “Consumption and Saving over the Life Cycle: How Important are Consumer Durables?,” Macroeconomic Dynamics. Krusell, P., and A. A. Smith (1998): “Income and Wealth Heterogeneity in the Macroeconomy,” The Journal of Political Economy, 106(5). Leahy, J. V., and J. Zeira (2005): “The Timing of Purchases and Aggregate Fluctuations,”Review of Economic Studies, 72. 34
Leamer, E. E. (2007): “Housing IS the Business Cycle,” Proceedings, Federal Reserve Bank of Kansas City. Luengo-prado, M. (2006): “Durables, Nondurables, Down Payments and Consumption Excesses,” Journal of Monetary Economics, 53(1). Mankiw, N. G. (1982): “Hall’s Consumption Hypothesis and Durable Goods,”Journal of Monetary Economics, 10(3). Petev, I., L. Pistaferri, and I. S. Eksten (2012): “Consumption and the Great Recession,” Analyses of the Great Recession. Tauchen, G. (1986): “Finite state markov-chain approximations to univariate and vector autoregressions,” Economics Letters, 20(2).
35
8
Appendix 1: Empirical Results
8.1
Data Adjustments and Construction
We de…ne durable expenditures as real consumer durable expenditures + real residential investment where real consumer durables are NIPA Table 1.1.5 line 4 divided by NIPA Table 1.1.9 line 4 and real residential investment is NIPA table 1.1.5 line 12 divided by NIPA Table 1.1.9 line 12. Non-durable consumption is de…ned as non-durable goods (NIPA Table 1.1.5 line 5 divided by NIPA Table 1.1.9 line 5) + services (Table 1.1.5 line 6 divided by Table 1.1.9 line 6) - housing services (Table 2.3.5 line 14 divided by Table 2.4.4 line 14). Our measure of GDP is then the sum of non-durable consumption, durable expenditures and private non-residential investment.. We have also experimented with using analogous constructions with chained GDP rather than constructing real GDP with the GDP de‡ator. are only available going back to 1995.
However, the necessary chained GDP components
Nevertheless, the results for the most recent recession are
similar. In addition, it should be noted that due to the construction of the price de‡ators, the real series constructed by de‡ating the nominal series individually do not add up to the aggregate real series. This problem is more problematic the further from the base year we move. Since the current NIPA data uses 2005 as the base year, this is likely to introduce only small errors into our results for the most recent recession, but it makes the older series somewhat less reliable.
The business
cycle volatilities we estimate are sensitive to the exact procedure used to construct the individual consumption components (e.g. using non-durable consumption + services - housing services to get our measure of non-durable consumption does not obtain the exact same series as using PCE - housing services - durable expenditures even though these two measures contain the same components). These series are nearly identical in the 2000s, but diverge as we move further back in time. Constructing durable expenditure rates requires constructing quarterly measures of the durable stock.
Following Bachmann, Caballero, and Engel [2010], we construct measures of real quarterly
durable expenditures using nominal data from BEA Domestic Product and Income Tables 1.1.5 and price de‡ators from Table 1.1.9.
We then next construct quarterly depreciation estimates using
annual nominal measures of depreciation from BEA Fixed Asset Table 1.1 together with the price
36
de‡ators from Table 1.1.9. Since the BEA publishes annual measures of the stock of durables and housing in Fixed Asset Table 1.1, we just need to construct quarterly measures in between these annual observations.
To do this, we combine the annual observations with the quarterly expenditure and
depreciation measures together with a standard stock accumulation expression to construct quarterly stock measures. See Bachmann, Caballero, and Engel [2010] for the more detailed procedure.
8.2
Conditional Heteroscedasticity
In this section we show that durable expenditures exhibit conditional heteroscedasticity, rising in booms and falling in recessions. As in Bachmann, Caballero, and Engel [2010], we assume that our series of interest can be described by an AR process:
xt =
p X
j xt j
+
t et ;
j=1
where xt
ID D
is durable expenditures divided by the durable stock,37 et
i.i.d. with zero mean
and unit variance, and
t
xt
1
= =
1 k
+ xt
1
k X
j:
xt
j=1
That is, we allow the variance of the residuals in the AR process for durable expenditures to vary with past durable expenditures. impact at time t is given by
This speci…cation implies that the impulse response of x to e on
+ xt
with past durable expenditures while
1.
If
= 0 then the impulse response of x to e does not vary
> 0 implies that the IRF rises with lagged expenditures.
We estimate the time-series model using quarterly data on
ID D
from 1960-2010. The estimation
follows a 2-stage procedure. In the …rst stage, we estimate the AR process via OLS to obtain residuals 3 7 The
ratio of durable expenditures to the stock is stationary while durable expenditures are not.
37
"t : The second stage then estimates by OLS 2
j"t j =
1
using
1=2
( + xt
We repeat the estimation for all combinations of p; k
1)
+ error:
12 and choose the best …t, p ; k using AIC.
For more details on the time-series model, see Bachmann, Caballero, and Engel [2010]38 .
Table 6
contains the time-series estimates. Both total durable expenditures as well as residential investment exhibit strongly signi…cant39
> 0.
marginally signi…cant. While
> 0 implies that there is a statistically signi…cant increase in the IRF
The estimated
> 0 for consumer durables, but it is only
with lagged expenditures, it does not imply that the increase is economically signi…cant. In the 4th and 5th rows of Table 6, we report statistics that show that there is quantitatively large variation in the IRF across time. The maximum IRF is 2.82 times larger than the minimum IRF while the 95th percentile is 1.82 times higher than the 5th percentile. Thus, the estimated heteroscedasticity is both statistically and economically signi…cant. Table 6 Conditional Heteroscedasticity Data Series:
Total Dur. Exp.
Resid.
Cons. Dur.
Non Dur.
:
0.05
0.03
0.04
-0.002
t- :
2.63
2.04
1.52
-0.67
Bootstrap p-value ( > 0) :
0.007
0.03
0.04
0.70
2.82
2.52
1.67
1.20
1.82
1.65
1.59
1.15
192
192
192
192
(
max = min )
(
95 = 5 )
no. obs. :
:
:
3 8 In addition to the model we presented, their paper presents an alternative time-series model. We obtained similar results for this model, so for brevity we did not report these results. 3 9 The bootstrap p-value row constructs bootstrapped p-values for > 0; accounting for the fact that errors in the …rst stage estimation increase the standard errors in the second stage.
38
Table 7 Conditional Heteroscedasticity Models Series:
RBC
RBC Adj Costs
No Fixed Costs
W/ Fixed Costs
:
-0.02
-0.003
0.02
0.08
t- :
-0.34
-0.14
0.42
2.13
1.25
1.24
1.17
1.83
1.15
1.14
1.11
1.49
(
max = min )
(
95 = 5 )
:
:
It is important to note that while we have interpreted conditional heteroscedasticity as a timevarying impulse response to aggregate shocks with a constant variance, an alternative interpretation is that aggregate shocks themselves are larger during booms than during recessions. We test for this by performing the same regressions on Baxter-King bandpass …ltered non-durable consumption.40 Table 6 shows that, there is no evidence of conditional heteroscedasticity for non-durable expenditures. Presumably the aggregate shocks hitting C should be similar to the aggregate shocks hitting D, so we interpret our results as evidence that it is not the shocks that drive heteroscedasticity, and is rather the mechanism that translates those shocks into durable expenditures that drives our estimates. Bachmann, Caballero, and Engel [2010] provide additional evidence that aggregate GDP also does not exhibit conditional heteroscedasticity. To construct Figure 4, we allowed for a more ‡exible non-parametric second stage.
We also
bootstrapped the procedure to construct corresponding con…dence intervals. To do this, we redraw residuals from the …rst stage to create one-thousand bootstrap samples when estimating the nonparametric second-stage. We tried a variety of bandwidths for the second-stage kernel estimator, and it did not change the qualitative conclusions. In addition to these empirical estimates, we also compute heteroscedasticity estimates for our simulated models.
Since we know that the true shocks in the model follow an AR(1) process, we
report benchmark results restricted k = 1; p = 1, but results are not sensitive to this restriction. Table 7 shows that the frictionless model does not generate procyclical IRFs. 4 0 Unlike expenditure rates, non-durable consumption is non-stationary and so must be …ltered. …lters did not substantively change the results.
39
If anything, the Using alternative
Figure 11: Procyclical Responsiveness 1.8 Model with Fixed Cost Model with No Fixed Cost Data
Impulse Response on Impact (Relative to Average IRF)
1.6
1.4
1.2
1
0.8
0.6
0.4
1965
1970
1975
model without …xed costs implies
1980
1985
1990
1995
2000
2005
2010
< 0: In contrast, the model with …xed costs exhibits conditional
heteroscedasticity that is in line with the empirical estimates. The estimated
> 0, and the time-
variation in the impulse response on impact is similar to that in the data. Tables 6 and 7 summarize statistical evidence for a time-varying impulse in the data as well as in the model with …xed costs of durable adjustment, but it is also useful to plot our resulting time-series estimates. Figure 11 shows the estimate of
(which again is an estimate of the IRF on impact) at
each date for the time-series model and compares it estimates from the heterogeneous agent models with and without …xed costs of durable adjustment. To construct the estimates for the heterogeneous agent models, we …rst estimate the time-series model above and then use the residuals from this model as the shock process that we feed into our structural models, beginning from the ergodic distribution. We then reestimate the time-series model on our simulated data and compute the resulting IRFs. The impulse response for the model with …xed costs closely matches the empirical estimates, rising during booms and falling during recessions. In contrast, there is little time-variation for the model
40
with no …xed costs. While …xed costs induce procyclical impulse response functions, they need not be the only mechanism that can generate these dynamics. Another possible explanation for a procyclical IRF is the presence of collateral constraints.
If collateral constraints tighten during recessions, then durable
expenditures may respond less to shocks during recessions than during booms. We have tested for this using the models with collateral constraints in Section 6. However, we …nd that this mechanism is quantitatively weak. solely one-sided.
This is partially because the response to time-varying credit conditions is
A tightening of credit conditions has a direct e¤ect on households that want to
increase durables but has no direct e¤ect on households that want to sell durables.
This substan-
tially dampens the scope for time-varying IRFs. Furthermore, we …nd no empirical support for such asymmetric heteroscedasticity.
9 9.1
Appendix 2: Model Solutions RBC Model
The RBC model (for the Cobb-Douglas case) has the following …rst order conditions:
Ct
: vCtv
1
Dt1
Kt+1
:
t
= E
Dt
:
t
= (1
v
Ctv Dt1
t+1
v
=
Yt+1 + (1 Kt+1
v)Dt v Ctv Ctv d1t
41
v
t k)
+ E
t+1 (1
d)
The steady-state equations (…xing Z = 1) are then given by
Y
= K = vC v
1
D1
v
C v D1
Y + (1 K
= =
C
1
(1
v)D
= ZK
v
v
k)
C v C v D1
kK
v
+
(1
d)
dD
Solving for the steady-state gives: C D
We set
k
=
v(1
(1 1
1
K
=
Y
= K
D
=
(1) 1
1
1
(1
k)
(2) (3)
Y v(1
d ))
v
kK
(1 1 v
d ))
+
(4) d
= :022 to match the long-run ratio of investment to capital, and we set
the long-run labor share. We then pick
= :3 to match
so that the capital stock in 2 implies an interest rate (in a
decentralized economy) of 1%. We then pick
so that 1 implies
C dD
= 4. Given the steady-state
solution, we then compute the dynamic solution to the model by taking a second order perturbation around the steady-state solution.41 To investigate the sensitivity of our conclusions to our parameter values and calibration targets, we have also resolved the model using a variety of di¤erent speci…cations. 12 values evenly spaced between .011 and .16, 7 values for values for the
C dD
We varied
d;
choosing
evenly spaced between 0.5 and 3, three
(4, 5 and 6), and we also allowed for a CES utility speci…cation with elasticities
ranging from 0.7 to 1.7.42
Figure 12 shows the resulting standard deviations of durable and non-
4 1 Additional
details available on request. includes the range typically estimated in the literature. (See Krueger and Fernandez-Villaverde [2010]). Expanding this range further did not matter for the general conclusions. For high enough elasticity, we can match the volatility of non-durable expenditures relative to output, but for these parameter values, durable expenditures are more 4 2 This
42
Figure 12: Robustness of RBC results Non-Durable Volatility Relative to GDP
Durable Volatility Relative to GDP
350
60
300 50
250 40
200 30 150
20 100
10 50
0 0.2
0.25
0.3
0.35
0 1
0.4
5
10
15
20
25
30
durable expenditures relative to GDP. None of the parameter speci…cations (including allowing for CES between durable and non-durable consumption) is able to match the empirical volatility of nondurable expenditures, and only a tiny substet of parameters delivers durable expenditures that are not substantially more volatile than the data. than 40 times too volatile.
43
9.2
Incomplete Markets Model
We describe the solution for the model with …xed costs. The solution for the model without …xed costs is similar. Reproducing the recursive formulation from the text, households solve
V (a
1; d 1;
; Z; K)
=
max V adjust (a
; Z; K) ; V noadjust
1; d 1;
with V adjust (a
1; d 1;
; Z; K)
=
max c;d;a
cv d1 1
v 1
+ E"; V (a; d; 0 ; Z 0 ; K 0 )
s:t: c = wh + (1 + r)a
1
+d
1
(1
d)
d
a
f (1
d) d 1
equilibrium conditions and prod. process V noadjust (a
1; d
1 ; ; Z; K)
=
cv d1 1
max c;a; d2((1
d )d
1 ;d
1)
v 1
+ E"; V (a; d; 0 ; Z 0 ; K 0 )
s:t: c = wh + (1 + r)a
1
+d
1
(1
d)
d
a
equilibrium conditions and prod. process
We begin by substituting the budget constraint into the utility function to eliminate non-durable consumption as a choice-variable. We discretize
and Z using the algorithm of Tauchen [1986] and
approximate V adjust (:; :; ; Z; :) and V noadjust (:; :; ; Z; :) as multilinear43 functions in the two continuous idiosyncratic states and one continuous aggregate state.
Initializing the grid for aggregate
capital requires knowledge of the steady-state level of capital, so before solving the model with aggregate shocks, we solve for the steady-state of the model. The solution method is similar and simpler than the solution with aggregate shocks, so we only describe the latter: Given an initial guess for the value functions and transition function, we solve for the optimal two-dimensional policy functions using a Nelder-Meade algorithm initialized from 3 di¤erent starting values to reduce the problems of …nding local maxima in the policy function. The values of adjusting 4 3 We have experimented with cubic spline interpolation and have found that the speed advantages of linear interpolation appear to be worth potential decreases in accuracy (especially since …xed costs imply that the value functions may not be well approximated by cubic splines).
44
and not adjusting are compared, to generate the overall policy function and to update the overall value function. We iterate until the separate value functions change by less44 than 0.001. Once the value functions have converged, we then solve for the optimal policy function an additional time on a …ner grid, to use for simulation. We then simulate a panel of households and compute the evolution of the aggregate capital stock to update the aggregate transition rule K 0 =
0
(Z) +
1
(Z) K. We then repeat the above procedure
until the coe¢ cients in the value function change by less than 1%.
Once the transition rule has
converged, aggregate forecasts are highly accurate, with R2 > 0:999.
We have experimented with
including the aggregate durable stock in the transition rule and found that it did little to improve forecasts, at considerable additional computational cost. For the benchmark results, we use 25 grid points each for interpolating a
1
and d
1,
3 grid points
for interpolating K, and we discretize aggregate and idiosyncratic productivity using 5 and 7 points, respectively.
(We recompute the model using 9 points for aggregate productivity when computing
impulse response functions). We construct a …ner grid with 90 points for a the …nal policy function used for simulation.
1
and d
1
to compute
Thus, our …ne policy function must be solved for
approximately 2 million grid points and their associated expectations.
Our simulation uses 25,000
households for 5,000 periods with an initial burnin of 1,000 periods. In order to simulate the recession shock, we …rst compute a discretization of the residuals estimated from an AR process for durable expenditures. (See Appendix 1). We then feed these residuals into the model as our aggregate productivity series and then hit the model with a simulated 4% reduction in capital in the period corresponding to 2008q4. While our Krusell-Smith approximation is highly accurate on average, it may be a poor approximation following this one-time shock. We address this by comparing forecast errors following the shock to forecast errors in general. Indeed we …nd that forecast errors are substantially worse immediately following the one-time shock, but they nevertheless remain highly accurate.
Computing across various simulations, the maximum forecast error following the
one-time shock is 0.1% of the capital shock, which translates into less than a 0.1% error in the forecast interest rate. This is substantially larger than the maximum .01% forecast errors arising without the 4 4 Finer
converge values didn’t appear to a¤ect the results.
45
shock, but is still extremely small. Exogenously raising and lower the interest rate by 0.1% only has tiny e¤ects on simulated outcomes, so we view these errors as economically inconsequential.
10
Appendix 3: Estimating Durable Gaps
This appendix discusses the estimation of the empirical adjustment gaps and hazards using PSID microdata. The procedure begins by …rst estimating the relationship between variables in the structural model that have empirical counterparts and unobserved quantities of desired durable holdings. the benchmark results, we estimate a linear regression of c; d
1 ; a; d
c 1
;d
a 1 +a
In
on dadjust and dnoadjust
(where dadjust is the quantity of durables a household would choose today if its optimal policy is to pay the …xed cost and dnoadjust is the optimal policy if it chooses to not pay the …xed cost).
We
…nd that this speci…cation has R2 of over 0.99 so that these observables in the model are su¢ cient to explain desired durable holdings.45 To estimate this procedure empirically, we must construct measures of these variables using PSID data. Beginning in 1999, the PSID contains detailed information on non-durable consumption, the value of housing and vehicles as well as various wealth holdings. Although more detailed non-durable consumption data is available beginning in 2003, for comparability we use only variables that are available beginning in 1999.
The value for non-durable expenditures is the sum of all components
of food consumption, utilities, transportation expenses, schooling expenses and health services. Our measure of d
1
is the sum of last periods housing value and vehicle values. Assets are the sum of
business value, stocks, iras, cash, bonds, minus the value of outstanding debt. measures of c; d
1; a
After constructing
per household member (with household head < age 65), we then de‡ate these
nominal values using NIPA price indices and remove a household level …xed e¤ect. This then gives us an empirical counterpart to c; d
1 ; a; d
c 1
;d
a 1 +a
to which we apply the same
structural relationship estimated from our model to generate empirical measures of dadjust;estimate and dnoadjust;estimate : The empirical gap in Figure 2, is de…ned as log dadjust;estimate =dnoadjust;estimate : 4 5 Allowing for a more ‡exible functional form did not substantially enhance the predictive power. Similar results are also obtained by directly estimating the durable gap.
46
Figure 13: Business Cycle Shifts Compared to Average Con…dence Interval PSID: Time-Varying Density Vs. 95% Confidence Interval for Average Density 2 Confidence Interval Boom (1999) Recession (2009)
Density
1.5
1
0.5
0
-0.4
-0.3
-0.2
-0.1
0
0.1
0.2
0.3
0.4
Durable Gap
PSID: Time-Varying Hazards Vs. 95% Confidence Interval for Average Hazard 0.7 0.6
Hazard
0.5 0.4 0.3 Confidence Interval Boom (1999) Recession (2009)
0.2 0.1 0
-0.4
-0.3
-0.2
-0.1
0
0.1
0.2
0.3
0.4
Durable Gap
Given estimates of the durable gap, we can then calculate the empirical adjustment hazard as a function of the estimated durable gap. To compute the adjustment hazard, we must pick a threshold durable change that quali…es as an adjustment.46
The benchmark results use a threshold of a 50%
change in the value of the durable stock to qualify as adjustment. This threshold generates an overall two-year adjustment probabability of roughly 30%. Using di¤erent thresholds did not substantively a¤ect our conclusions. In addition to the results shown in Figure 2, we have also estimated bootstrapped con…dence intervals for the average density and hazard to assess the statistical signi…cance of the business cycle shifts that we estimate.
Figure 13 shows estimated con…dence intervals,47 which show that the
time-variation we estimate is statistically signi…cant.
4 6 There is an indicator in the PSID for home sales, but it is not useful for 1999 because in that year, the question is phrased to cover a longer time span than it is in later years. Furthermore, this ignores changes in the value of vehicles. 4 7 With a bootstrap sample of 1000.
47