DOSIMETRY OF
85
Kr and 133Xe
USING DUAL-PHOSPHOR FOUR-ELEMENT THERMOLUMINESCENT DOSIMETERS
Michael H. Momeni M&A: Momeni and Associates 37 Cheshire Court Chatham, Illinois 62629 E-Mail:
[email protected] ABSTRACT: The response of thermoluminescent dosimeters (Panasonic* UD802-AS2) to radiation emitted from
137
Cs and to radiation emitted from airborne 85Kr and
133
Xe was measured.
The response of each of the four elements was a linear function of exposure to radiation emitted from each of the radionuclides. The dosimeters were exposed to each of the noble gases at the center of a spherical chamber with a radius of 82.8 cm. The dose rate and depth dose rate from 85Kr and 133Xe were calculated. The ratios of the average dosimeter responses to the calculated surface doses from
85
Kr at the center of the exposure chamber were 0.35, 0.14, 0.002, and 0.0008,
respectively for the dosimeter elements one through four. The ratios for the average responses to the calculated surface dose from
133
Xe were 0.067, 0.0077, 0.023, and 0.006, respectively for the
dosimeter elements one through four. The responses of the dosimeters to beta and gamma radiation were separated using the ratio of the responses of (Li2B407: Cu) and (CaSo4: Tm) elements. The effects of 85Kr and 133Xe diffusion into the badge were not detectable.
1
Panasonic Industrial Company, One Panasonic Way, Secaucus, NJ
07094
DOSIMETRY OF 85Kr AND 133Xe USING DUAL-PHOSPHOR FOUR-ELEMENT THERMOLUMINESCENT DOSIMETERS
INTRODUCTION
Krypton-85 and
133
Xe are inert radioactive gases with radioactive half-lives of 10.76 years
and 5.27 days, respectively. They are produced by fission of uranium, and may be released from nuclear power generating stations. Releases of these gases from a reactor station can result in external exposures to workers and the public. Inhalation and subsequent internal irradiation of the lungs are of minor concern.
To assess compliance with regulatory limits of radiation exposure listed in the Code of Federal Regulations (CFR), 10 CFR part 20 section101 (US Government 1990), thermoluminescent dosimeters (TLD) are often utilized. Skin dose from an external beta radiation exposure is often calculated for a depth of 7 mg cm-2, the depth to an average skin basal cellular layer.
A
determination of this skin dose requires correction for simultaneous response of the dosimeters to beta and gamma radiation. Theoretical determination of beta radiation dose from immersion in a radioactive cloud was reported by Berger (1974) and Kocher (1980). Plato et al. (1980) reported a This research partially was supported by Southern California Edison under contract No. 8T073901. The author acknowledges technical reviews of R. Warnock and L. Bray and K. Swoope. This work became possible with diligent support of David Deane and Kathryn McCarty while we were at San Diego State University.
similar experiment exposing four-element two-phosphor thermoluminescent dosimeters to
133
Xe.
The objectives of this study were:
1. Determine the response characteristics of Panasonic dual-phosphor thermoluminescent dosimeters to 85Kr and 133Xe; 2. Determine the contribution to TLD response from diffusion of krypton and xenon into the badges; 3. Determine minimum detectable skin dose.
MATERIALS AND METHODS
TLD System Characteristics
The Panasonic thermoluminescent dosimetry system is composed of a four-element detector (UD802-AS2) and luminescent reader (Table 1). The badge consists of the four elements enclosed in a plastic holder, each covered by a filter of a different thickness and composition. The TLD elements and holder are housed in a 200 mg cm-2 thick plastic hanger with window openings over elements one and two. The TLD elements one and two are constructed from lithium borate and the other two elements are constructed from calcium sulfate.
Table 1. Characteristics of Panasonic Model UD802-AS2 thermoluminescent dosimeter. Element
Absorption (mg cm-2) ______________________________________________________________________________ 1
Phosphor
Li2B4O7:Cu
Filtration
Teflon window 3 mg cm-2
14 2
Polyimide substrate 11 mg cm 2
Li2B4o7:Cu
3
CaSO4:Tm
Plastic 75 mg cm2 Plastic 150 mg cm2
75 350
Hanger Plastic 200 mg cm2 4
CaSO4:Tm
Lead and plastic 800 mg cm2 1000 Hanger Plastic 200 mg cm2
______________________________________________________________________________
The response of lithium borate as a function of gamma energy is not identical to that of calcium sulfate. Thus, the differential energy responses of these two types of thermoluminescent dosimeters can be used to estimate the effective gamma energy of a radiation field (Momeni 1975). In addition, filtration incorporated into the construction of each element of the dosimeter allows a determination of the beta radiation contribution. In this system, the response of the dosimeter was measured using
pulsed photo-thermal stimulation. The system was calibrated using
137
Cs gamma radiation and
Victoreen** ion chambers (Model 362).
Noble Gas Exposure Chamber
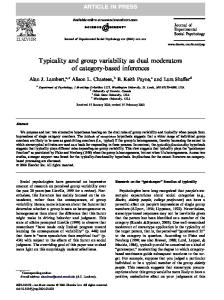
The dosimeters were exposed in a spherical chamber with a radius of 82.8 cm and a volume of 2.42 m3. A schematic diagram of the exposure system constructed for these experiments is given in Figure 1. The system consists of a spherical exposure chamber, a noble gas transfer system, a noble gas collector, a noble gas desorption heater, a noble gas concentration monitor, a pre-cooler, a heat radiator, and temperature and pressure monitors. 85
Kr and
133
Xe in a nitrogen carrier gas, in 2-liter tanks pressurized to approximately 4.8 mega-
pascals, were purchased from Isotope Products laboratories (Burbank, CA).
An analysis of the gas using a Ge (Li) detector did not indicate the presence of other radioactive impurities. A 34.5-liter transfer system under vacuum was charged to a pre-determined pressure from the supply tanks, and the pressure was then increased to 66 kPa using atmospheric air. This metered activity was then transferred to the exposure chamber using a flow-through method.
**
Victoreen, 44104.
Inc.,
10101
Woodland
Ave.,
Cleveland,
OH
Figure 1. A schematic diagram of the noble gas exposure chamber: Temperature (T), pressure (P), and noble gas concentration (M) monitors; fan (F), circulating pump unit (PU), noble gas transfer system (T) pre-cooler (PC, collector (C) air heater (H) and temperature radiator (R).
Concentration of the noble gas within the exposure chamber was measured using a continuous monitor developed for this research. The monitor was calibrated using known concentrations of 85
Kr and 133Xe.
The air within the exposure chamber was continuously mixed during each experiment using a circulating pump and a small oscillating fan. After complete mixing of the noble gas within the exposure chamber, the response by the monitor was a measure of the average noble gas concentration. The monitor consisted of two pancake GM detectors housed in a 2.5 cm cylindrical steel chamber. The detectors faced each other and were separated by a distance of about 5 cm. The monitor response was recorded using both digital and analog (chart) recorders. The background count rate for the monitor was about 60 counts per minute. The principal objective for use of the continuous monitor was to check the concentrations of the noble gases within the exposure chamber during each experiment. In addition, the recorded concentrations allowed determination of the entire exposure duration and time-integrated concentrations. Krypton and Xenon Exposures
The dosimeters were exposed at the center of the exposure chamber to five different concentrations of either 85Kr or
133
Xe (Table 2). The concentrations of the noble gases within the
exposure chamber were determined from the volume of the chamber and the activities of the noble gases transferred into the chamber.
These concentrations were also compared with the
concentrations indicated by the noble gas continuous monitor.
In order to compare the sensitivity due to radiation externally emitted from that, which diffuses into the detector and holder, a group of the dosimeters were also sealed in plastic bags (1.27 mg cm-2) and were exposed to the noble gases.
RESULTS
Thermoluminescent dosimeters were calibrated using gamma radiation from
137
Cs. After
calibration the net response (R) and standard errors of the mean (SE) for badges exposed to 16.6 µC kg-1 of
137
Cs gamma radiation were: 20.2(0.8), 20.1(1.1), 16.4(0.5) and 16.8(0.8) µC kg-1 for
elements one through four, respectively. The ratio of responses R1/R3 and R2/R4 are dependent on the energy of the beta and gamma radiation (Momeni 1975). The response of each element of the dosimeters as a function of exposure was measured and found linear from 0.0 to 7.7 X 10⁻⁴ C kg-1 (0.0 to 3.0 R).
Figure 2 shows the typical response of the noble gas monitor as a function of time after introduction of 133Xe into the exposure chamber. The figure shows a period of relatively constant concentration that was followed by washout of the gas through the noble gas collector. The pattern of monitor response for 85Kr was similar to that of 133Xe.
Table 2. The concentrations and time-integrated concentrations of 85Kr or
133
Xe in the exposure
chamber during a sequence of exposures. ______________________________________________________________________________ 85
Experiment
133
Kr
(MBq m-3)
Xe
(MBq m-3 s)
(MBq m-3)
(MBq m-3 s)
______________________________________________________________________________ 1
8.55
6.30 x 10⁴
83.60
7.90 x 10⁵
2
1.65
2.22 x 10⁴
72.90
9.18 x 10⁵
3
1.81
2.34 x 10⁴
28.10
3.54 x 10⁵
4
17.60
1.63 x 10⁴
152.10
2.12 x 10⁶
5
5.11
6.60 x 10⁴
100.30
1.25 x 10⁶
______________________________________________________________________________
The response of the continuous noble gas monitor was linear over the range 0.0 - 37.0 MBq m-3 measured after the complete mixing of 85Kr within the chamber. Similarly, the response was linear for 0.0 to 148 MBq m-3 of 133Xe.
The average net responses of the thermoluminescent dosimeters, as a function of krypton and xenon time-integrated concentration are shown in Figures 3 and 4. The TLD responses to radiation from 85
Kr and 133Xe are linear functions of the time-integrated concentrations for all four elements of the
dosimeters.
The responses of the elements depend on the amount of filtration and the intrinsic sensitivities of two types of phosphors (lithium borate and calcium phosphate) to beta and gamma radiation. Responses of elements three and four are mostly due to gamma radiation because of the larger filtration of these two elements (Table 1). The greater observed sensitivity of elements one and two is due to their lower filtration and response to both beta and gamma irradiation.
The ratios of responses to 85Kr from badges sealed in the bag to those not sealed in the bag were 0.84 and 0.90, for elements 1 and 2, respectively. The reduced response is caused by reduced diffusion of the noble gas into the detector and absorption of beta radiation by the bag. Attenuation by the plastic bag was calculated to be about 5%. Therefore, the contribution from diffusion was about 10%. However, the standard deviation of the measured responses and the error in determination of the
Figure 2. Monitor response as a function of time after introduction of 133Xe for two different xenon concentrations (experiments number 2 and 4)
Figure 3. Response of each TLD element as a function of 85Kr time-integrated concentration. The standard deviations for elements 3 and 4 are less than 4% of the means.
attenuation of the radiation by the bag was about 5% each. The 10% value for diffusion may not be statistically significant.
Similarly, the ratios of responses to 133Xe from badges sealed in the bag to those not sealed in the bag were 0.75 and 0.76 for elements 1 and 2, respectively. The attenuation of the radiation by the plastic bag was about 15%. The standard deviation of the measured responses and the error in determination of the attenuation of the radiation by the bag each were again about 5%. In agreement with Plato et al. (1980), our analysis indicates that the residual 10% value for xenon diffusion into dosimeter may not be statistically significant.
Figure 4. Response of each TLD element as a function of 133Xe time-integrated concentration. The standard deviation for element 4 is less than 8% of the mean. On Page 14
DOSIMETRY
Radiation dose to the dosimeters is from gamma and beta radiation.
Techniques for
determination of the geometry factor for beta emitters have been previously reported (Loevinger 1956; Berger 1975; Cross 1969). The dose rate (DR) may be calculated from:
DR =
KC
ρa
∑ Gi F i ( I i E i ) S i
Where K is a conversion factor between the units of time, energy, concentration (C) inside of the exposure chamber, and dose. The air density within the exposure chamber is ρa. The index, i, relates to the type of radiation. Gi is the exposure geometry factor and is dependent on the size of the exposure chamber and the range of radiation in air. The factor, Fi, is the depth-dose factor; Ii and Ei are the absolute intensity and the energy of the emitted radiation, respectively. S is the relative mass stopping power of tissue to air.
The above equation may be simplified to:
DR = DRγ + DR β
DR =
KC
ρa
( F γ E γ Gγ S γ + F β E β G β S β )
Where Fγ and Fβ are the effective depth-dose factors for gamma and beta radiation. Eγ and Eβ are average energies per disintegration for beta and gamma radiation, respectively. The geometry factors Gγ and Gβ are the effective geometry factors for the two types of radiation.
The dose rate from gamma radiation emitted from either 85Kr or 133Xe gases, uniformly distributed in a very large volume of air (infinite space), may be calculated from assumption of radiation equilibrium. Under this assumption, the rate of energy absorption per unit volume is equivalent to the rate of emission of gamma radiation in the volume and therefore, Gγ = 1.
Under our
experimental condition, we assumed a 4π-exposure geometry. We based the radiation energies and absolute intensities on the data reported by Lederer and Shirley (1979), Dillman and Von der Lage (1975), and Kocher (1981).
Since our exposure geometry was finite in dimension, we calculated the exposure geometry factor (Gγ) from the photon flux density (Φ) arriving at the center of the exposure chamber. The flux Φiγ is given by:
Φi,γ = S v,i
e-r.µ s,i 4π r 2
Where Sv is the noble gas source strength per unit volume of the exposure chamber, and
s
is the
absorption coefficient for photons in air.
Integration of the above equation over the radius of the chamber (Ro) for n gamma energy groups results in:
φ
R n ∑i=1 ∫ 0 d Φ L = ∑ S v,i ∫ 0 0 e-rµ s,i dr
n
Φ R0 = ∑i=1
S v,i
µ s,i
n
(1- e- µ s,i R0 )
Φ∞ = ∑i=1
S v,i
µ s,i
We assumed (µ s/ρa) = 0.15 cm2 g-1 for 85Kr and (µ s/ρa) = 2.35 cm2 g-1 for 133Xe. We calculated the values for Gγ from the ratios Φ(Ro)/ Φ∞. The ratio for 133Xe was estimated to be about 0.22. The contribution of gamma radiation dose from 85Kr to surface dose is negligible (less than 1%).
Beta Dose Rate
The dose rate from beta radiation from either 85Kr or
133
Xe uniformly distributed in a very
large volume of air may be calculated from radiation equilibrium assumption (Gβ = 1). Further, we assumed a 4π-exposure geometry.
The two beta groups for
85
Kr are E1 = 0.672 MeV and E2 = 0.150 MeV, with intensities,
respectively, 0.995 and 0.0043. The average energies for the two groups of beta particles are 0.246 MeV and 0.041 MeV, respectively. The average beta energy per disintegration for both groups is about 0.245 MeV. The average of the beta and electron energies for
133
Xe is 0.14 MeV per
disintegration.
Under our exposure conditions Gβ <1. The range of most energetic beta in air (0.67 MeV from 85Kr) is about 189 cm, larger than the radius of the exposure chamber (82.8 cm). We calculated the reduced exposure geometry factor from immersion in a chamber smaller than the range of the beta radiation from Loevinger's equation (1956). The exposure geometry factor (Gβ) for 85Kr was 0.89.
For 133Xe gas, the range of the 0.346 MeV beta (the most energetic beta) is about 80 cm in air, which is less than the radius of the exposure chamber. Therefore, for 133Xe we assumed that the exposure geometry was within an infinite space (Gβ = 1.0).
Sß, the mass stopping power ratio of tissue to air, was estimated from data reported by Berger (1974). Sß for both 85Kr and 133Xe is about 1.15.
The dose rate conversion factor to a tissue element from beta and gamma radiation per unit concentration of 85Kr and
133
Xe for immersion in an infinite 4π-exposure space is 0.14 and 0.0992
mGy h-1 per MBq m-3.
In an open air space, the contribution from bremsstrahlung is partially due to interaction of beta radiation with argon atoms.
Determination of the bremsstrahlung contribution under our
experimental conditions was not readily feasible.
However, the relative contribution of
bremsstrahlung is practically negligible.
Depth Dose
The dose rate at any depth from a surface may be determined from:
DR = F γ (d) DRγ + F β (d) DR β
Where the Fγ (d) and Fβ (d) are the gamma and beta depth-dose factors (Table 3). At a depth greater than the range of beta radiation, the dose rate is from gamma radiation alone. The values for Fγ may be determined from the mass absorption coefficient of each photon and the radiation buildup factor. Table 4 lists dose rates for beta particles as a function of depth in tissue for 85Kr and 133Xe.
Table 3.
Depth Dose-rate [Gy h-1(MBq m-3)-1] x105 and dose-rate factor as a function
of depth (µm) for 85Kr and 133Xe (2π-exposure geometry). ______________________________________________________________________________ 85
Depth (d)
133
Kr
DRβ(d)
Xe
Fβ(d)
DRβ
Fβ(d)
______________________________________________________________________________ 0.0
6.97
1.0
4.94
1.0
10.0
6.62
0.95
3.75
0.76
20.0
6.27
0.90
3.01
0.61
50.0
5.58
0.80
1.92
0.39
70.0
5.23
0.75
1.60
0.32
100.0
4.74
0.68
1.09
0.22
140.0
4.18
0.60
0.64
0.13
300.0
2.72
0.39
0.10
0.02
500.0
1.60
0.23
--
--
1000.0
0.42
0.06
--
--
Dose Since dose rate is only a function of the noble gas concentration in our exposure chamber, the total dose may be determined from time-integrated concentrations (IC), which are listed in Table 2. Table 4 lists the surface doses to the thermoluminescent badges exposed to 85Kr and 133Xe gases.
Table 4.
Integrated concentration (IC) calculated surface dose (Ds) and TLD elements average net responses (R).
______________________________________________________________________________ Experiment Ds R1 R2 R3 R4 (mGy) (mGy) (mGy) (mGy) (mGy) ______________________________________________________________________________ 85 Kr 1
1.23
0.37
0.25
6.0x10⁻³
4.0x10⁻³
2
0.43
0.14
0.04
1.0x10⁻³
0.0
3
0.46
0.15
0.06
1.0x10⁻³
1.0x10⁻³
4
3.17
1.43
0.49
1.5x10⁻²
1.2x10⁻³
5
1.28
0.45
0.14
0.0
1.0x10⁻³
133
Xe
1
10.88
0.78
0.09
0.27
0.12x10⁻²
2
12.65
0.79
0.08
0.27
0.11x10⁻²
3
4.88
0.31
0.04
0.11
4.9x10⁻²
4
29.21
1.94
0.25
0.67
0.29
5
17.22
1.23
0.12
0.38
0.17
COMPARISON OF THE PREDICTED DOSE WITH MEASURED RESPONSES
The values of integrated concentrations for 5 concentrations of 85Kr and
133
Xe are given in
Table 5. The responses (R) of elements one (R1) and two (R2) are to both beta and gamma radiation. The response of element three is to gamma radiation alone (R3 ). The contribution from the beta radiation may be calculated from:
R1 = R1β + R1γ
R1γ = R3 ( R1γ / R3γ )
R1β = R1 - R3 ( R1γ / R3γ )
Where R1β is the response of element one to beta radiation alone.
Table 5.
Ratio of the TLD responses (R) to the calculated tissue surface dose
________________________________________________________________________
Experiment
R1
R2
R3
R4
___________________________________________________________________________________________________________ 85
Kr
1
0.30
0.20
4.9 x 10⁻³
3.3 x 10⁻³
2
0.32
0.09
2.3 x 10⁻³
0.0 x 10-0
3
0.33
0.13
2.3 x 10⁻³
2.3 x 10⁻³
4
0.45
0.15
4.7 x 10⁻⁴
3.8 x 10⁻⁴
5
0.35
0.11
0.0 x 10-0
7.8 x 10⁻⁴
Average
0.35
0.14
2.0 x 10⁻³
0.8 x 10⁻³
1
0.072
0.0083
0.025
1.10 x 10⁻⁴
2
0.062
0.0063
0.021
8.70 x 10⁻⁵
3
0.064
0.0082
0.023
1.00 x 10⁻²
4
0.066
0.0086
0.023
9.93 x 10⁻³
5
.071
0.0070
0.022
9.90 x 10⁻³
Average
0.067
0.0077
0.023
6.00 x 10⁻³
133
Xe
The ratio (R1γ/R3γ) allows us to correct for the energy dependence of the two elements. The average ratio (R1γ/R3γ) for an exposure to 0.662 MeV gamma radiation was 1.2. The same ratio for an exposure to 80 keV x-rays was reported by Plato et al. (1980) as 0.12.
The ratio of TLD responses to the calculated tissue surface doses is listed in table 5.
DETECTION LIMITS
The limits of detection for the dosimeters were calculated using Student's t-distribution. The detection limits for exposure to
137
Cs gamma radiation were 0.21 µC kg-1 (0.83 mR), 0.34 µC kg-1
(1.3 mR), 0.24 µC kg-1 (0.93 mR), and 0.19 µC kg-1 (0.72 mR), respectively, for elements one through four. Because element one was covered by a 14 mg cm-2 absorber, the dose to the sensitive volume of the dosimeter was 35% and 13% of the surface dose for 85Kr and 133Xe, respectively. The minimum detectable response of element one to gamma radiation for
137
Cs was 7.1 µGy (0.71
mrad).
An application of TLD for personnel dosimetry reduces the exposure geometry for beta radiation to 50% due to shielding of the dosimeter by the body of the individual. The contribution of gamma radiation after passing through the body may not be a negligible value, and it may be dependent on the position of the TLD on the body. If we also assume that for gamma the geometry would reduce to a value for the 2π-exposure condition, then the period of exposure to 85Kr and 133Xe would be 17 minutes and 2.1 hours, respectively, before element one of the badge could detect a concentration of one DAC of these noble gases.
SUMMARY AND CONCLUSION
The average ratio of response of element one to the surface dose for 85Kr is 0.35 (Table 5). The contribution of beta radiation to the dose at any depth d may be calculated from:
Dβ (d) = Fβ (d) Dβ (0)
Where Dβ (0) is the surface dose from beta radiation and interpolation of values provided in Table 3. The ratio of surface dose to tissue from beta radiation to the total tissue surface dose is about unity, due to a negligible contribution of gamma radiation to the dose. The dose at a depth (d) from beta radiation may be calculated from:
Dβ = 2.86 Fβ (d) (R1 - 1.2R3)
Similarly for 133Xe, the average ratio of response of element one to the surface dose is 0.067 (0.003), Table 5, or R1 = 0.067 Ds. Thus, the response of TLD element one is about 15 times less than the surface dose. Plato et al. (1980) observed that the response of the element one was about 20 times less than the surface dose.
The dose at a depth (d) from beta radiation may be calculated from:
Dβ = 14.93 Fβ (d) (R1 - 0.12R3)
The window over the element one and two may limit the radiation solid angle to less than 2πexposure geometry; thus, the observed lower responses of these elements may partially be affected by the reduced exposure geometry.
Multi-phosphor thermoluminescent dosimeters (LiF and CaSO4) were previously applied to a determination of effective energy in a gamma field (Momeni 1975, 1986). The dosimeters were exposed in air and/or within a plastic phantom. The differential energy response of the two types of phosphors was utilized to correct for the energy-dependent responses of the dosimeters. In this paper multi-phosphor thermoluminescent dosimeters were used to determine the relative contribution of beta dose and gamma dose from
85
Kr and
133
Xe by using a combination of
differential energy dependent responses and filtration methods.
To assess compliance with
regulatory limits of radiation exposure, a separation of gamma dose from beta dose for an exposure in a beta-gamma radiation field would be required. In an energy variable gamma field, a correct determination of the dose would also require a correction for energy-dependent responses of the dosimeters. A multi-phosphor thermoluminescent dosimeter, such as those used for this study or other similar systems would improve the quality of the data for estimation of radiation doses in both routine and emergency exposure conditions.
REFERENCES Berger, M. J. Beta-ray dose in tissue-equivalent material immersed in a radioactive cloud. Health Phys. 26:1-12; 1974.
Cross-, W. G. Distribution of absorbed beta energy in solid media. Can. J. Phys., 47:75-83; 1969. Dillman, L. T.; and F. C. Von der Lage Radionuclide decay schemes and nuclear parameters for use in radiation-dose estimation. MIRD Pamphlet No. 10, Society of Nuclear Medicine, Inc., New York, NY 10016; 1975. Kocher, D. C. Dose-rate conversion factors for external exposure to photon and electron radiation from radionuclides occurring in routine releases from nuclear fuel cycle facilities. Health Phys. 38:543-621; 1980. Kocher, D. C. Radioactive decay data tables. Report DOE/TIC-11026, National Technical Information Services, U. S. Department of Energy, Springfield, VA 22161; 1981. Lederer, C. M. and V. S. Shirley Table of isotopes. ISBN 0-471-04179-3, John Wiley and Sons, Inc., New York; 1979 Loevinger, R., Japha, E. M. and Brownell, G. L. Discrete radioisotope sources. In Radiation Dosimetry (edited by G. L. Hine and G. L. Brownell), p.p. 693-800, Academic Press, New York; 1956. Momeni, M. H., Jow N., Countis, T., Worden, L. and Bradley, E. Estimation of effective gamma energy by differential responses of TLD-100 and TLD-200 dosimeters. Health Phys. 28:809-812; 1975. Momeni, M. H. Dose distribution from degraded 60Co gamma field. Health Phys. 50:493-507; 1986. Plato, P. A., C. G. Hudson, D. Katzman and R. Sha; Calibration of environmental and personal dosimeters by submersion in and distant exposure to 133Xe. Health Phys. 38:523-528; 1980. U. S. Government, Title 10, Code of Federal Regulations, Energy, Parts 0 to 199. Washington, DC; U. S. Government Printing Office; 1990.