Goal-Equivalent Trial-to-Trial Control of a Generalized, Redundant Reaching Task 1
Jonathan B. Dingwell, 1 Rachel F. Smallwood, 2 Joseph P. Cusumano 1 Department of Kinesiology, University of Texas, Austin, TX 2 Department of Engineering Science & Mechanics, Penn State University, State College, PA E-mail:
[email protected] Web: http://www.edb.utexas.edu/faculty/dingwell/ Introduction: A critical question in neuroscience is how humans make accurate, repeatable movements in spite of biological noise and redundancy [1,2]. If we exploit task redundancies as a general strategy, we should do so even if the redundancy is de-coupled from the physical implementation of the task itself. Theory: For many tasks, one can define the task goal independent of the performance or performer and thus define a precise map from performance variables to goal variables [2]. Task redundancies can create a manifold in the space of performance variables, referred to as a “Goal Equivalent Manifold” or GEM [2,3]. Only deviations in performance perpendicular to the GEM cause errors with respect to the task goal [1-3]. To test the generalizability of such tasks, we defined an infinite family of goal functions [2,3]:
G Di , Ti Dim Ti n C 0
Dim Ti n C ,
(1)
where Di was reaching distance and Ti was reaching time for trial i, and m, n and C were constants. The task was to drive G(Di,Ti) to zero. We tested two goal functions from this class that were very different, but could both be achieved by neurophyiologically and biomechanically similar movements (Fig. 1). The first GEM was defined by n = −m and C = cm: i.e., try to maintain ~constant speed (D/T = c) from trial to trial. The second GEM was defined by n = +m and C = cm: i.e., try to maintain ~constant D T c from trial to trial. These two tasks were physically orthogonal in the [T, D] task space (Fig. 1) and also “conceptually” orthogonal since D/T has a direct physical interpretation (i.e., speed), while D·T has none. Methods: Ten healthy subjects made straight line reaching movements. Subjects were never explicitly shown either GEM relationship, but only instructed to minimize their errors. After each reach, they were given visual error feedback based on their performance. For each task, subjects performed 1800 total movements over 2 consecutive days. Each subject performed both tasks at least 5 days apart. Five subjects did the D·T task first, while the other five subjects did the D/T task first. Initial error magnitudes from each day were tested for learning, consolidation, and generalization (Figs. 23). From the last 400 trials of each day, time series of Di and Ti were extracted and deviations tangent to (T) and perpendicular to (P) each GEM (Fig. 1) were computed [2,3]. We calculated the normalized standard deviations of P and T [1-3]. To quantify how each reaching movement influenced the subsequent movement, we modeled each time series as X i 1 X i i , where X {D, T, δP, δT} and ξ was a noise term. Smaller values of indicate more rapid corrections of cycle-to-cycle deviations [3]. Results: Subjects exhibited significant learning and consolidation of learning for both tasks (Fig. 2). Interestingly, while learning the D/T task first facilitated learning of the D·T task, learning the D·T task first interfered with learning the D/T task second (Fig. 3). For both tasks, subjects exhibited greater variability along the GEM (T) than perpendicular to it (P), but this effect was much stronger for the D·T task (Fig. 4). Analyses of trial-to-trial dynamics [3] showed that subjects actively corrected P deviations more rapidly (i.e., lower ) than T deviations and did so to the same degree for both tasks (Fig. 5). Conclusions: Subjects exploited the D·T GEM redundancy to the same degree as the D/T GEM, despite exhibiting greater variance ratios for the D/T task. Variance measures alone failed to capture the trial-totrial dynamics of task performance [3]. Humans actively exploited task redundancies, even for these abstractly defined tasks where they did not have to. They did not use readily available alternative strategies that could have achieved the same performance. Acknowledgements: NIH Grant #1-R03-HD058942-01 (to JBD) and NSF Grant # 0625764 (to JPC).
e^P
0.6
δT
D*T GEM
δP
D/T GEM
e^P
^eT
1.2
^eT
0.2 0.0
0
1
Reach Time (s)
2
0
1
Reach Time (s)
2
a = 231.8 τ = 1.77
a = 384.6 τ = 4.48
200 100 10 2.5
log(a)
D/T GEM
20 30 40 Trial Number p=0.047
2.0
50
10
D*T GEM log(a)
0
1.5 1.0
20 30 40 Trial Number 2.5 2.0
p=0.004 Day 1 Day 2
Fig. 2 -- Learning & Consolidation: Top: Percent (%) error versus trial number for both test days from one typical subject for the D·T task. Bottom: Log of initial % Error values (‘a’) for Day 1 vs. Day 2 for both tasks. Initial errors were significantly reduced at the beginning of Day 2, relative to Day 1 for both the D/T task (p = 0.047) and the D·T task (p = 0.004).
0.8
0.6
0.4
Day 1 Day 2
0.2
δP
δT
δP
δT
Fig. 4 -- Variance: Standard deviations of the trial-to-trial fluctuations perpendicular (δP) to vs. tangent (δT) to (A) the D/T GEM and (B) the D·T GEM from the final “Testing” phase of each experiment. Subjects exhibited significantly greater δT than δP variability (p = 1.410-13) for both tasks. A significant Task Direction interaction (p = 8.810-5) means this difference was significantly greater for the D/T task. D/T GEM D*T GEM 0.9 0.8 0.7 0.6 0.5 0.4
2.5 log (% Error)
1.0
1.0
1.5 1.0
Day 1 Day 2
50
Standard Deviation
0.4
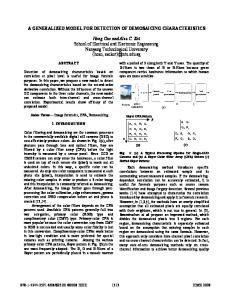
Fig. 1 – GEM Reaching Tasks: Schematic representations of the two GEMs (D/T and D·T; solid lines) used. Dashed lines represent ±5% errors with respect to each GEM. Individual points represent data from one typical 400-reach trial for a typical subject. The left (D/T) plot also shows how perpendicular (δP) and tangent (δT) deviations were defined. Day 1 Day 2 300 D*T -- % Error
D*T GEM
1.4
λ
Reach Distance (m)
D/T GEM 0.8
0.3 2.0
0.2
1.5
0.1 D/T Task D*T Task
1.0 First
Second
Fig. 3 -- Generalization: Log of initial % Error values (i.e., ‘a’ in Eq. 5) for the beginning of the Early Learning phase of each task. Solid red line represents the difference in initial % Error for the D/T task between those who completed it “First” (left) and those who completed it “Second” (right). Dashed blue line represents the difference in initial % Error for the D·T task between those who completed it First and those who completed it Second. Error bars denote ±95% confidence intervals for each mean. Initial % Errors were significantly different between the two tasks (p = 9.3210-6). There was also a significant Task Order interaction effect (p = 0.007).
Day 1 Day 2
δP
δT
δP
δT
Fig. 5 – Inter-Trial Corrections: Statistical persistence (λ) of δP vs. δT fluctuations from the final “Testing” phase of each experiment. Subjects exhibited significantly less statistical persistence (smaller ) for δP fluctuations than for δT fluctuations in both tasks (p = 1.810-13). However, unlike the variability results (Fig. 4), the GEM Direction interaction effect here was not significant (p = 0.173). References: 1. Todorov E., Nature Neurosci., 7: 907-915, 2004. 2. Cusumano JP & Cesari P, Biol. Cybern., 94: 367-379, 2006. 3. Dingwell JB, John J, & Cusumano JP. PLoS Comput Biol, 6(7):e1000856, 2010.