Manhattan Community District 8
See MN 8's profile online
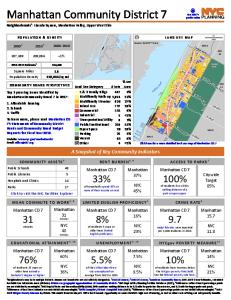
Neighborhoods1: Carnegie Hill, Lenox Hill, Roosevelt Island, Upper East Side, Yorkville
[
+1%
W
86 S t
81
MN 7
220,697
Square Miles Population Density
2.0 109,960/sq mi
Cen tra l Pa rk
Website: www.cb8m.com Email:
[email protected]
t
iv
E7
9S
E8 t
6S
t
Tra nsv erse E6
Cen tra l Pa rk
S
E5
MN 5
9S
6S
t
QN 1
t
r
To learn more, please read Manhattan CD 8's Statements of Community District Needs and Community Board Budget Requests for Fiscal Year 2018.
MN 11
2A v
1. Affordable housing 2. Parks 3. Schools
St
Park
6
Top 3 pressing issues identified by Manhattan Community Board 8 in 2017:
5
6S
5A v
% Lot Land Use Category # Lots Area 1 & 2 Family Bldgs 1,040 5% Multifamily Walk-up 1,219 9% Multifamily Elevator 974 37% Mixed Use 1,589 22% Commercial 275 4% Industrial 23 <1% Transportation/Utility 37 2% Public/Institutional 312 14% Open Space 4% 10 Parking 1% 35 Vacant 2% 67 Other 17 <1%
COMMUNITY BOARD PERSPECTIVES
Tra n
St T ran sve rse Central
W
2011-2015 Estimate4
St 79
E9
er
219,920
St
RD
217,063
86
MN 6
E4
2S
FD
2000-2010
Miles
e ers sv
20103
Br o ad wa y
W
20002
0.5
LA N D U S E M A P
East R
PO P U L ATI O N & D E N S I T Y
Qn P
QN 2
t
lz
Click here for a more detailed land use map of Manhattan CD 8
A Snapshot of Key Community Indicators CO M M U N I T Y A S S E T S 5
R E N T B U R D E N 4, 6
Public Schools
30
Public Libraries
5
Hospitals and Clinics Parks
37 23
Click to visit the NYC Facilities Explorer
M E A N C O M M U T E T O W O R K 4, 8
Manhattan CD 8
31 minutes
Manhattan 31 minutes
NYC 40
minutes
E D U C AT I O N A L AT TA I N M E N T 4 , 1 0
Manhattan CD 8
80%
of residents 25 years or older have earned a bachelor's degree or higher 1
Manhattan 60% NYC 36%
Manhattan CD 8
34%
of households spend 35% or more of their income on rent
Manhattan 37%
Manhattan CD 8
NYC 45%
of residents live within walking distance of a park or open space
LI M I T E D EN GL I S H P RO FI CI EN C Y 4
Manhattan CD 8
6.1%
of residents 5 years or older have limited English proficiency
Manhattan 15.8% NYC 23.1%
U N E M P L OY M E N T 4 , 1 0
Manhattan CD 8
4.1%
of the civilian labor force was unemployed on average from 2011 to 2015
A C C E S S TO PA R KS 7
Manhattan 7.5% NYC 9.5%
Citywide Target 85%
95%
C R I M E R AT E 9
Manhattan CD 8
8.8
Manhattan 15.7 NYC 11.8
major felonies were reported per 1,000 residents in 2016
P O V E R T Y 4, 1 0
Manhattan CD 8
7%
of residents had incomes below the poverty level
Manhattan 18% NYC 21%
Neighborhoods may be in multiple districts. Names and boundaries are not officially designated. 22000 US Census; 32010 US Census; 4American Community Survey 2011-2015 5-Year Estimates, calculated for Public Use Microdata Areas (PUMAs). PUMAs are geographic approximations of community districts. 5NYC Dept of City Planning Facilites Database (2017); 6 Differences of less than 3 percentage points are not statistically meaningful. 7NYC Dept of Parks and Recreation (DPR) (2016). DPR considers walking distance to be 1/4 mile for parks less than 6 acres, and 1/2 mile for larger parks and pools. 8 Differences of less than 2 minutes are not statistically meaningful. 9NYPD CompStat, Historic Complaint Data (2017); 10 Differences of less than 2 percentage points are not statistically meaningful.