Mobile Consumption and Disposal in Chennai Metropolitan Region, India (Naveedh Ahmed, M.Sc., Brandenburg University of Technology, Germany)
Chennai, the capital city for the Indian state Tamil Nadu, located on the Coromandel Coast of Bay of Bengal is one of the most important metropolitan cities in India with a population of about 8.8 million. The city is one of the fast growing cities in the world, with an expectation to become a megacity within 2025. The Metropolitan area comprises of mixed population comprising of low income, middle income and high income groups belonging to different educational backgrounds and professions. The survey based study was carried out in Chennai Metropolitan area to estimate the current per person consumption of mobiles, which will be used to further assess the possible quantity of e-waste. Also to understand the current trends on people’s way of WEEE disposal and awareness.
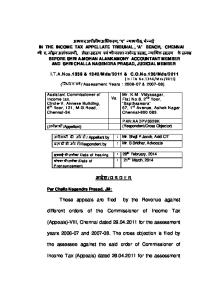
The overall
respondents for survey are from 420 persons comprising 62.7% of male respondents and 37.3% of female respondents. From the survey it was observed that the overall mobile phone consumption is found to be 4 per household. The mean number of basic model phone in use per household in the region is found to be lower than smart phone model, which expresses people’s choice on moving towards updated technology growth in the region. The mean product per person from the survey is calculated and related to the population as shown in table. Mean number of mobiles "in use" per household 5 3.81
4 3 2
1.15
2.86
2.75
2.3 1.2
1.1
1
3.75
3.24
0.88
0.77
0.71
0 Below 1 lakh 1-3 lakh INR 3-5 lakh INR 5 - 10 lakh INR INR
10-13 lakh INR
Above 13 lakh INR
Basic Phones
Smart Phones
Linear (Basic Phones )
Linear (Smart Phones )
Figure 1: Mean mobile number across different Income groups Table 1: Mobile Quantities Estimation in Chennai Metropolitan Area
Mobiles
Mean Product per Person
Basic Mobile phone
0.25
Smartphones
0.77
Population
Estimated Quantities 2,200,000
8,800,000 6,776,000
It is also found that 70.7% of the respondents have “not in use” mobile phone. In that 70.7% group, 31.4% have stocked their mobile as a back-up since its working, while 20.6% have stocked as they are not interested to repair their broken mobile because of cost and 18.7% have stocked their broken mobile for repair. The mean number of mobile phones not in use per household is found to be 1.42 and numbers ranged between 1 to 7, with 7 not in use mobile phone per household forming highest. Status of mobiles "not in use" Figure 2: Different status of mobiles “not in use” 29.3%
31.4% 18.7% 20.6%
70.7%
From Figure 2, 20.6% group and 18.7% group, reflects respondents attitude who are interested to extend their product use
Don't have "not in use mobile"
through repair. But, 18.7% group infers
Working condition & kept as back up
the cost factor of repair has made them to
Broken condition & kept for repair
go for the new product option rather than
Not interested to repair because of Cost
their intention to extend the product use.
This percentage can be increasing in future as the market is growing through affordable priced products. Therefore, creating ways for availability of cheap repair parts either by the product makers or through harvesting the parts from the end-of-life products should be made effectively viable. Figure 3: Different disposal methods for mobiles
Disposal methods for mobile phones
The figure 3, describes that 43.1% opts for a second sale method
43.1% 20.0%
either selling or giving free to third party. A share of 20% ends in
Garbage 9.5% 9.3%
dumpsites via garbage, in which a portion could be collected by
Old scrap shop
18.1% Second sale/Donate (repair shop or friends or relations)
scavengers. The quantities of mobiles “in use”, status of “not in use” mobiles and disposal methods collectively reflects the potential for reuse or extending longevity of product use through repair.