Health
Tr a c k i n g
Tr e n d s Reducing Infant Mortality In Chile: Success In Two Phases Solid commitment to maternal and child health initiatives has yielded infant mortality rates matching those of higher-income countries. by Jorge Jiménez and María Inés Romero ABSTRACT: Latin America, and especially Chile, has done well in reducing infant mortality, with rates of around twenty-five per thousand live births. There are two clear phases of declining mortality: one largely influenced by poverty reduction, primary health care, and environmental and demographic factors; and a second one more sensitive to focused health care interventions. In 2000 Chile reached 8.9 infant deaths per 1,000, using interventions that represent an increase in the provision of services related to perinatal risks, acute respiratory diseases, congenital heart conditions, and certain vaccine-preventable infections. Chile, with per capita income near U.S.$5,000 in 2000, has infant mortality that compares with that of wealthier countries. [Health Affairs 26, no. 2 (2007): 458–465; 10.1377/ hlthaff.26.2.458]
R
e d u c i n g i n fa n t m o r ta l i t y has been a permanent ethical and policy concern for governments and international agencies. The infant mortality rate (IMR) has been widely used as an index of equity and human development. It reflects deaths of children who were born alive but died before reaching their first birthday, and it distinguishes between neonatal mortality (if death occurs before twenty-eight days) and postneonatal mortality (if death occurs between twenty-nine days and eleven months). Following the classical Child Survival Initiative, launched in the 1970s, which achieved good results, a new effort to reduce the unacceptable number of infant deaths occurring every year in the world is being promoted by experts and organizations.1 Latin America has reached a respectable level of child survival in recent years; however,
it has received little recognition for this achievement, mainly because published evidence concerning the strategies implemented in the region is lacking. Infant mortality in the Americas declined by approximately onethird, from 36.9 per 1,000 live births in 1980– 1985 to 24.8 in 1995–2000.2 Still, 400,000 children under age one die in Latin America every year.3 The distribution of these figures is still unequal: Some countries (such as Cuba, Chile, and Costa Rica) have rates near or under ten per thousand, while others (such as Bolivia and Haiti) remain over fifty. The common factor in the successful cases has been powerful governmental intervention by means of structured and sustained public health policies, with a focus on maternal and child health and the basic household environment, together with basic education and other relevant social policies.4 Children living today in big South
Jorge Jiménez (
[email protected]) and María Inés Romero are professors of public health in the Department of Public Health, School of Medicine, Pontificia Universidad Católica de Chile, in Santiago.
458 DOI 10.1377/hlthaff.26.2.458 ©2007 Project HOPE–The People-to-People Health Foundation, Inc.
M a r c h /A p r i l 2 0 0 7
Tr e n d s
American cities such as Lima, Caracas, São Paulo—even though these cities have very poor slums—have better survival options than their rural counterparts because of access to some kind of health care.
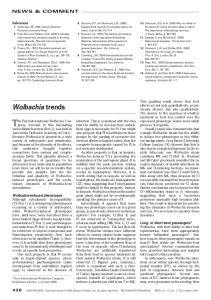
Trends In Infant Mortality In 1962, after analyzing data from different countries through time, Hugo Behm devised a curve to express the evolution of infant mortality and its relation to socioeconomic development over time.5 The two phases of infant mortality, early and late, cross and overlap. In the very early period of the infant mortality curve, neonatal mortality is higher than postneonatal mortality; then, postneonatal mortality is higher until more advanced stages of development, when the neonatal component becomes more important again. The evolution of this curve reflects the relationship of infant mortality with environmental factors and medical interventions. Generally speaking, in a first phase, environmentally related factors are more influential because of infections, mediated by lack of access to safe water and sanitation, as is typical of poverty. In a second
phase, with a higher proportion of infant mortality due to neonatal causes, medical care becomes more relevant because the prevalent conditions benefit more from technology and the improved organization of care systems. When real data from Chile, between 1917 and 2001, are plotted, the curves that appear fit remarkably well (Exhibit 1).6 In this paper we discuss the evolution of infant mortality in Chile during the past fifty years. Our hypothesis is that the country, although still only at a middle level of development, has reached levels of attainment comparable with those of higher-income countries.
Chile: A Success Story In 1952 Chile established its National Health Service (NHS), based on the merger of several institutions and organizations via a complex but successful reform process.7 The main scope of action of this public health system was maternal and child health, and programs were progressively developed in a vigorous collaboration among public health experts from government and academe. The country had an infant mortality rate of 136.2 per 1,000
EXHIBIT 1 Infant Mortality Rate In Chile, Neonatal (Early) And Postneonatal (Late), 1917–2001 Rate per 1,000 live births 140 120 100 80 Postneonatal 60 Neonatal
40 20 0 1920
1930
1940
1950
1960
1970
1980
1990
2000
SOURCE: National Institute of Statistics (INE), Chile, Yearly Vital Statistics, 1917–2001. NOTES: Neonatal mortality is that occurring before an infant reaches twenty-eight days old. Postneonatal mortality is that occurring between twenty-eight days and twelve months.
H E A L T H A F F A I R S ~ Vo l u m e 2 6 , N u m b e r 2
459
Health
Tr a c k i n g
live births in 1950, with 29.0 caused by infections (including diarrhea and dehydration), 44.4 from respiratory diseases, and 38.7 from causes related to perinatal conditions (Exhibit 2). In 1968, 57 percent of infant deaths had malnutrition as the associated or underlying condition.8 These rates have been calculated using biodemographic data registered and maintained in Chile for decades. The quality and reliability of these statistics are related to three parameters that have improved over time: the coverage of professional care of deliveries, now at 98 percent; the percentage of medical certification of infant deaths, also now at 98 percent; and the share of ill-defined causes of death, now at 8 percent.9 Interventions in maternal and child health in Chile were initiated together with health care development based on technical criteria related to a systemic approach.10 These criteria were as follows: (1) an integrated vision of health and the life cycle with the environment, with a preference for health care in ambulatory and community settings; (2) an integrated concept of health care and health organiza-
tions, in which every action is part of a holistic strategy; (3) a multidisciplinary health care team with several professions combining higher to lower skills and complementing functions; (4) research and training in action, through integration of public health services with university departments; (5) continuing evaluation of programs and instruments; and (6) permanent improvement of the quality and reliability of epidemiological data, including medical certification of causes of death and audit of infant deaths. The strength of these data has been evaluated several times. The main problem perceived was underreporting of births, which was estimated to be 5 percent and used as a correction factor for the equation to calculate infant mortality rates.11 A powerful strategy to prevent and cure malnutrition was progressively implemented. Powdered milk donation to every child under six years and to pregnant and lactating women enrolled in NHS ambulatory clinics has been in place since the creation of the universal public health network during the 1950s. The Chilean food program has been evaluated by sev-
EXHIBIT 2 Infant Mortality Rate In Chile, By Selected Causes, Absolute And Per 1,000 Live Births, Selected Years 1950–2000 1950
1960
1970
1980
1990
2000
208,092 136.2
287,063 119.5
251,231 82.2
247,013 33.0
307,522 16.0
261,993 8.9
50.4
34.6
31.7
16.7
8.5
5.6
85.8
84.9
50.5
16.3
7.5
3.3
Certain conditions originating in the perinatal period 38.7 Pneumonia and bronchopneumonia 44.4
47.8 31.0
17.5 19.5
12.9 4.2
5.5 2.4
3.4 0.7
29.0
16.0
15.2
2.0
0.24
0.0
1.5
2.0
3.4
4.0
3.7
3.0
5.9
4.9
1.6
0.3
0.1
0.1
Number of live births Infant mortality rate Neonatal mortality rate (before twenty-eight days) Postneonatal mortality rate (after twenty-eight days, before twelve months)
Diarrhea and gastroenteritis of presumed infectious origin Congenital malformations, deformations, and chromosomal abnormalities Selected infectious diseases: vaccination-preventable, congenital syphilis, and meningococcal infections
SOURCE: Authors’ analysis of data provided by the National Statistics Institute and the Ministry of Health, Chile.
460
M a r c h /A p r i l 2 0 0 7
Tr e n d s
eral researchers and policymakers as an effective tool to attract families to adopt healthy behavior.12 However, it interfered somewhat with the practice of breastfeeding, which declined for more than two decades, from 70 percent of infants being breastfed at age six months in 1950 to 19 percent in 1974.13 At that point, active breastfeeding campaigns were established, and the trend reversed, so that 87 percent of infants were breastfed at six months in 1998.14 The impact of food programs on the prevalence of malnutrition in children under age six years enrolled in preventive care has been positive: Malnutrition rates dropped from nearly 40 percent in the mid-1950s to less than 3 percent by 2000 (Exhibit 3). Highly motivated child health care teams in the country worked for decades with a dual affiliation to the NHS and to the School of Medicine of the University of Chile. Many of them contributed to the scientific and technical research about and implementation of feasible solutions for prevalent problems.15 Malnutrition was challenged with food programs and breastfeeding promotion; diarrhea, with oral rehydration; perinatal mortality with professional care of deliveries and family planning programs; measles and polio, with early vaccination strategies; and so on.16 At the beginning of the 1980s, Chile had 97 percent coverage of professional care at birth and 98 percent coverage of basic immunizations for children.17 Important contributing factors were leadership and international cooperation. The Rockefeller Foundation financed fellowships in public health and the establishment of a
School of Public Health at the University of Chile in 1943. The school was organized by the outstanding physician Abraham Horwitz, who afterward headed the Pan American Health Organization (PAHO) in Washington, D.C., for sixteen years.18 In its first thirty years (1943–1973), the School of Public Health graduated nearly 2,000 students from Chile and neighboring countries. Most of them went to work in the public health system, as planners, epidemiologists, and area or district heads in primary health care. The appearance of a welltrained elite, very active in creating and implementing innovations, was definitely a critical factor in this whole venture.
Infant Mortality: The Second Phase n Economic cycles and child health. By 1990, forty years after the creation of the NHS, infant mortality had fallen to 16 per 1,000 live births—a reduction of 88 percent. The main contributors were perinatal conditions (5.5 per 1,000, or 35 percent), congenital malformations (3.7, or 23 percent), and respiratory infections (2.4, or 16 percent). Deaths in the neonatal (early) period had surpassed those in the postneonatal (late) period a few years before that, and two-thirds of infant deaths were occurring before the first month. Improvements in earlier years had occurred in Chile during a period marked by several recessions, hyperinflation, and unemployment.19 In fact, the evolution of improved infant and child health proved to be independent of economic cycles.20 Although Chile has a long history of demo-
EXHIBIT 3 Percentage Of Malnourished Children Under Age Six Years, Chile, Selected Years 1960–2000 Year
Total malnutrition (%)
Mild (%)
Moderate (%)
Severe (%)
1960 1970 1980 1990 2000
37.0 19.3 11.5 8.0 2.9
31.1 15.8 10.0 7.7 2.6
4.1 2.5 1.4 0.2 0.2
1.8 1.0 0.2 0.1 0.1
SOURCE: F. Mönckeberg, “Prevention of Malnutrition in Chile, Experience Lived by an Actor and Spectator,” Chilean Journal of Nutrition 30, no. 1 Supp. (2003): 160–176.
H E A L T H A F F A I R S ~ Vo l u m e 2 6 , N u m b e r 2
461
Health
Tr a c k i n g
cratic governments since independence in 1810, it was not immune from the typical revolutionary and regressive political and economic changes that beset Latin American countries during the twentieth century. The development model adopted in Chile in the 1940s had two components: internal industrial protection and welfare policies. This economic model proved inefficient in the 1950s and 1960s, when productivity was low and inflation high. Successive economic crises provoked the accession to power of two governments with reformists and revolutionary programs: Eduardo Frei, a Christian Democrat (1964–1970), and Salvador Allende, a proCuban Socialist (1970–1973). A coup on 11 September 1973 was the final Right-wing reaction to progressive policies of the two previous governments. The military government adopted strong political repression and a neoliberal market economy as its paradigm.21 As in earlier economic downturns, the profound recessions of the 1970s and 1980s did not affect infant mortality directly. One reason for this was the permanence of primary care policies in the public health care system. In a classic study, Adjustment with a Human Face, the United Nations Children’s Fund (UNICEF) called for softening of structural adjustment programs with strong policies for protecting children. In the case of Chile, it was proved that the primary health care and nutrition programs played a highly protective role during the difficult periods of economic crisis, 1974– 75 and 1982–84.22 n Restored democracy and four child health initiatives. Nevertheless, by 1990 the country was still only partly developed; 40 percent of its population lived below the poverty line. Chile then faced a new challenge to its child health policy. When democracy was restored in 1990, the new government had to reinforce Chile’s social medicine and public health traditions and express its commitment to improving equity in health. Initial policy decisions included the reestablishment of freeof-charge primary care visits and several improvements in the quality of and access to that care. Achievements in this area were recently
462
acknowledged by the World Health Organization (WHO).23 To improve performance in child health, though, more had to be done. Infant mortality improvements had slowed down, if not downright stagnated, during 1985–89. As was later recognized, this stagnation was a common phenomenon around the world.24 To resume the improvement in child survival, Chile had two options. On the one hand, social science had developed new methods for identifying people at high health risk (both individuals and communities), which could lead to better targeting of mothers and children at risk. However, this option, although theoretically more efficient than earlier strategies, implied the use of complex algorithms and policy designs, which could be costly. On the other hand, experts could expand or establish programs at this point, when infant mortality was around twenty per thousand live births. The public health authority decided to emphasize the second option, reinforcing some programs and expanding or creating new ones. The main programs dealt with perinatal care, acute respiratory infections, surgical correction of congenital heart defects, and further expansion of the immunization program. This increase to the supply side, or service provision side, proved to be successful in less time than expected (Exhibit 4). The expansion of the perinatal program included the implementation of neonatal intensive care units (NICUs), use of an artificial lung surfactant to treat respiratory distress syndrome (RDS) since 1998, and special training in these for nurses and pediatricians. Between 1998 and 2002, 2,943 premature newborns weighing less than 1,500 grams received the lung surfactant, with a survival rate of 63.5 percent. The annual additional cost of this program for the whole country is estimated at U.S.$250,000, for the artificial surfactant only. This figure does not include all costs related to the NICU; therefore, the total cost estimate should be much higher.25 Rolando González and colleagues have analyzed the data; they propose that drops in neonatal mortality during this period occurred mainly as a result of
M a r c h /A p r i l 2 0 0 7
Tr e n d s
EXHIBIT 4 Infant And Neonatal Mortality In Chile, By Selected Causes, 1990 And 2000 Rate per 100,000 live births 1990
2000
Percent reduction, 1990–2000
Infant mortality due to pneumonia and bronchopneumonia Infant mortality due to congenital cardiac disease
239.0 124.2
66.4 81.7
72.2 34.2
Neonatal mortality due to respiratory disease syndrome Infant mortality
64.4 16,800
33.2 9,400
48.4 44.0
Neonatal mortality Infant mortality due to congenital malformations
8,900 385.8
5,900 311.0
33.7 19.4
SOURCE: Authors’ analysis of data provided by the National Statistics Institute and the Ministry of Health, Chile.
technical factors such as NICU implementation and the use of artificial surfactant.26 A program to treat acute respiratory infections was established in 1990 and was expanded progressively to all regions of the country. Its main components were the use of physiotherapy, inhaled steroids and bronchodilators, brief or one-day hospitalization at the primary health care level, and rational use of antibiotics. It included the addition of physiotherapists to primary health care teams. The program, with universal and free access to all children in Chile, has estimated coverage of 100 percent of demand for specialized care, at an annual cost of U.S.$8.5 million. The surgical correction of congenital heart defects entailed the expansion of one old facility and the creation of a new one. This program is also free for all and has achieved universal access. The annual cost is U.S.$2.8 million for an average of 615 open-heart operations and nearly 200 cases resolved with endoarterial interventions each year. The expansion of the immunization program included the incorporation of the Haemophilus influenzae B (HiB) vaccine in 1996, the second dose for measles vaccine in campaigns since 1992, and the addition of mumps and rubella vaccines in 1990. HiB infections and deaths decreased dramatically, and endogenous measles cases disappeared. The annual total cost of the program is U.S.$14.2 million.
H E A L T H A F F A I R S ~ Vo l u m e 2 6 , N u m b e r 2
The innovative part of the program can be considered to constitute one-third of the total, or U.S.$4.7 million per year.
Results Of The Second-Phase Strategy Infant mortality fell from 16.0 per 1,000 live births in 1990 to 8.9 in 2000. The biggest reductions were in acute respiratory infections (from 2.4 to 0.66 per 1,000); perinatal conditions (from 5.5 to 3.4); and congenital malformations (from 3.7 to 3.0). As an indication of impact of the surgical program, mortality resulting from congenital cardiac conditions decreased from 1.24 to 0.82 per 1,000—a 34 percent reduction. The total infant mortality rate of 8.9 per 1,000 had a totally changed composition, with almost two-thirds (5.6) due to neonatal mortality and one-third (3.4) to postneonatal mortality (see Exhibit 2). Exhibit 4 provides absolute numbers and rates per 100,000 live births for the three conditions that were directly affected by the interventions. Chile’s total public health budget for 2000 was equivalent to U.S.$2.28 billion. The additional spending on these four new or redesigned programs was U.S.$16.75 million—a minute fraction of the total. If we calculate that 285 additional children are surviving every year, each death averted would have an additional cost of U.S.$58,771. To avoid new inequities or widening of ex-
463
Health
Tr a c k i n g
isting ones, these four specific programs were established universally and free of charge in public facilities for all children. Two of them, treatment for acute respiratory infections and new vaccines, are executed at the primary care level; the other two, neonatal care and surgical correction of congenital heart defects, at the public hospital level. The four programs were recently incorporated into the prioritized diseases with guarantees of access, financial protection, effectiveness, and quality that were included in the Health Reform of 2005. Guarantees of access apply to both public and private insurance schemes.27
Concluding Comments In Chile, a second phase of child survival activity followed the successes achieved by its initial efforts. Environmentally related causes of infant mortality, such as infectious diseases and malnutrition, have given way to the prevalence of perinatal and congenital causes, together with the persistence of acute respirator y infections and other preventable contagious diseases. Chile did very well in its economic development and poverty reduction strategies between 1990 and 2000, these factors might have played a role in reducing infant mortality. However, as discussed earlier, the second phase of infant mortality reduction is related more to health interventions than to socioeconomic issues. We hypothesize that this phenomenon might occur in middle-income countries and could provide the opportunity for improvement at reasonable costs. One possible reason for Chile’s improvement is clearly the increase in urbanization, with its consequences of availability and shorter distances to social services in health and education.28 Further studies are needed to test the hypothesis that this phenomenon occurs in the urban areas of poor- and middle-income countries. We believe that Latin America is a promising region in which to study and implement the expansion of interventions such as those undertaken by Chile. The strategy to tackle the second phase is technological in nature and relies on focused
464
health care interventions, which can be planned and established even in middleincome cities of poor countries. In fact, recent studies provide evidence for the high impact of technology innovations for improvements in child survival.29 Strategies implemented in Chile’s experience have different levels of proven effectiveness and need to be studied in greater depth.
C
h i l e ’s e x p e r i e n c e indicates that there is a way for continuing improvement in child survival efforts after an initial successes give way to rising mortality rates once again. Each city and each country with comparable conditions should study and implement its own strategy.
Jorge Jiménez was minister of health in Chile from 1990 to 1992. María Inés Romero was division chief for health programs at Chile’s Ministry of Health during that same period.
M a r c h /A p r i l 2 0 0 7
Tr e n d s
NOTES 1.
2. 3. 4.
5. 6.
7.
8.
9.
10.
11. 12.
13.
14.
15.
16.
17.
R.E. Black, S.S. Morris, and J. Bryce, “Where and Why Are Ten Million Children Dying Every Year?” Lancet 361, no. 9376 (2003): 2226–2234. Pan American Health Organization, Health in the Americas, 2002 ed. (Washington: PAHO, 2002). Ibid., 8. R.L. Riverón, “Estrategias para reducir la mortalidad infantil, Cuba 1959–1999,” Revista Cubana de Pediatría 72, no. 3 (2000): 147–164. H. Behm, Mortalidad infantil y nivel de vida (Santiago: Ediciones de la Universidad de Chile, 1962). The time series of infant mortality in Chile between 1917 and 2001, from the National Institute of Statistics (INE), are available online at http:// content.healthaffairs.org/cgi/content/full/26/2/ 458/DC1. The polynomial models for the two series are available from the authors; send e-mail to
[email protected]. J. Jiménez and T. Bossert, “Chile’s Health Sector Reform: Lessons from Four Reform Periods,” in Health Sector Reform in Developing Countries: Making Health Development Sustainable, ed. P. Berman (Cambridge, Mass.: Harvard University Press, 1995). R.R. Puffer and C.V. Serrano, Patterns of Infant Mortality in Childhood, Scientific Pub. no. 262 (Washington: PAHO, 1973). Data from the Ministry of Health, Chile, http:// deis.minsal.cl/index.asp (in Spanish) (accessed 21 September 2006). J. Jiménez, “Atención pediátrica y sistemas de salud en Chile,” Revista Chilena de Pediatría 71, no. 5 (2000): 377–379. Behm, Mortalidad infantil y nivel de vida. G. Weisstaub, M. Araya, and R. Uauy, “Community Nutrition and Its Impact on Developing Countries (the Chilean Experience),” in Nutrition in Pediatrics: Basic Science and Clinical Applications, ed. A. Walker, J. Watkins, and C. Duggan (Hamilton, Ont.: BC Decker, 2003), 161–173. F. Mönckeberg, “Prevention of Malnutrition in Chile,” in Preventive Nutrition, ed. A. Bendich and R.J. Deckelbaum (Riverview Drive, N.J.: Humana Press, 1997). F. Mönckeberg, “Prevention of Malnutrition in Chile: Experience Lived by an Actor and Spectator,” Chilean Journal of Nutrition 30, no. 1 Supp. (2003): 160–176. J. Meneghello, “Tendencias evolutivas de la pediatría (1940–2000),” Pediatría al día 17, no. 1 (2001). J. Meneghello et al., “Infantile Diarrhoea and Dehydration: Ambulatory Treatment in a Hydration Centre,” Advances in Pediatrics 11 (1960): 183–208. D. Raczynski and C. Oyarzo, “Evolución reciente
H E A L T H A F F A I R S ~ Vo l u m e 2 6 , N u m b e r 2
18.
19.
20. 21.
22.
23.
24.
25.
26. 27.
28.
29.
de la tasa de mortalidad infantil,” Revista Médica de Chile 110 (1982): 784–792. J. Jiménez, “Abraham Horwitz (1910–2000) Padre de la Salud Pública Panamericana,” Revista Médica de Chile 131 (2003): 929–936. H. Beyer and R. Vergara, “Productivity and Economic Growth: The Case of Chile,” in Economic Growth: Sources, Trends and Cycles, ed. N. Loayza and R. Soto (Santiago: Central Bank of Chile, 2002). Raczynski and Oyarzo, “Evolución reciente.” S. Collier and W.F. Sater, A History of Chile: 1808– 1994 (Cambridge: Cambridge University Press, 1996). G.A. Cornia, H. Jolly, and F. Stewart, eds., Adjustment with a Human Face (Oxford, England: Clarendon Press, 1987). J.W. Lee, “Global Health Improvement, and WHO: Shaping the Future,” Lancet 362, no. 9401 (2003): 2083–2088. O.B. Ahmad., A.D Lopez, and M. Inoue, “The Decline in Child Mortality: A Reappraisal,” Bulletin of the World Health Organization 78, no. 10 (2000): 1175–1191. R. González et al., “Reduction in Neonatal Mortality in Chile between 1990 and 2000,” Pediatrics 117, no. 5 (2006): 949–954. Estimations of costs were made from data gathered from Ministry of Health budgets, trying to allocate numbers to certain procedures and calculate the cost of each new death averted. The calculation is a rough approximation of the real values. The purpose of this exercise is to show how small the cost of the interventions may be in comparison to the total budget of the public health sector in Chile. González et al., “Reduction in Neonatal Mortality.” Ministerio de Salud, “Reforma de la Salud,” http://www.minsal.cl (accessed 18 December 2006). R. Jayasuriya and Q. Wodon, “Explaining Country Efficiency in Improving Health and Education Indicators: The Role of Urbanization,” Background Paper to the World Development Report 2003: Dynamic Development in a Sustainable World (Washington: World Bank, June 2002). D. Jamison, M.E. Sandbu, and J. Wang, “Why Has Infant Mortality Decreased at Such Different Rates in Different Countries?” Working Paper no. 21, Disease Control Priorities Project (Bethesda, Md.: National Institutes of Health, 6 February 2004).
465