47 Scientia Agropecuaria 1(2010) 47 - 61
Scientia Agropecuaria
Facultad de Ciencias Agropecuarias Universidad Nacional de Trujillo
Modelamiento de la interfaz de crecimiento/no crecimiento del Alicyclobacillus acidoterrestris CRA 7152 en jugo de naranja como función del pH, temperatura, Brix y concentración de nisina Modeling the growth/no growth interface of Alicyclobacillus acidoterrestris CRA 7152 in orange juice as a function of pH, temperature, Brix and nisin concentration Wilmer Luera Peña1,*; Pilar Rodriguez de Massaguer2 1
Universidade Federal do Espírito Santo, Centro de Ciências Agrárias. Departamento de Engenharia Rural, CP 16, CEP 29500000, Alegre, ES – Brazil 2 Universidade Estadual de Campinas, Departamento de Ciências de Alimentos, CP 6121, CEP 13083-862, Campinas, SP – Brazil
Recibido 20 febrero 2010; aceptado 11 marzo 2010 Resumen Se estudió la probabilidad de crecimiento del Alicyclobacillus acidoterrestris CRA 7152 en jugo de naranja en diferentes condiciones de producto. La respuesta del microorganismo fue monitoreado hasta 47 días de almacenamiento bajo diferentes condiciones de pH (3 a 5.8), sólidos solubles (11 a 19 °Brix), temperatura (20 a 54 ° C) y concentración de nisina (0 a 70 UI / ml). Los datos de crecimiento/no crecimiento fueron modelados por el modelo de regresión logística. La concordancia del modelo obtenido fue de 96.3% indicando buen ajuste de los datos observados. Los resultados mostraron un rápido crecimiento en condiciones de 0 UI de nisina /ml de jugo, pH 4.4 y 15ºBrix, a 35ºC. Para 70 UI de nisina / ml, pH 4.4 y 37 °C, hasta 47 días de almacenamiento no hubo crecimiento. Jugos simples (11 °Brix) con pH entre 3.5 a 3.7 puede mantenerse microbiológicamente estable hasta 36 °C, desde que adicionado 70 IU de nisina/ml, extendiendo su vida útil. Con 0.05 de probabilidad de crecimiento y usando el modelo logístico, se puede obtenerse altos valores de pH crítico cuando 50 UI de nisina/ml, a 25 ºC, están presentes en el jugo, sin embargo, los incrementos en temperatura y descenso en la concentración de sólidos solubles hace que los valores de pH crítico disminuyan. Se concluye que la incorporación de nisina es una alternativa para controlar el crecimiento de A. acidoterrestris en jugo de naranja, así como el modelo de regresión logístico demostró ser una herramienta importante para determinar la respuesta microbiana en los valores críticos de las variables, además de predecir las probabilidades de crecimiento para las diferentes condiciones estudiadas. Palabras clave: Modelamiento predictivo, Alicyclobacillus acidoterrestris, jugo de naranja, nisina
Abstract The growth probability of Alicyclobacillus acidoterrestris CRA 7152 in orange juice was studied in different product conditions. The microorganism response was monitored until 47 days of storage in different conditions of pH (3 to 5.8), soluble solids (11 to 19°Brix), temperature (20 to 54°C) and nisin concentration (0 to 70 IU/ml). Growth/no growth data were modeled by the polynomial logistics regression model. The concordance of the obtained model was 96.3% indicating good fitting of observed data. The results showed fast growth in the conditions 0 IU nisin/ml juice, pH 4.4 and 15ºBrix, at 35ºC. For 70 IU nisin/ml there was no growth, pH 4.4, at 37ºC, up to 47 days of storage. Simple juices (11°Brix) with pHs between 3.5 to 3.7 can keep stable and withstand abuse temperatures up to 36°C, since added in 70IU nisin/ml, extending its shelf life. With 0.05 growth probability and using the logistics model, high pH critical values can be obtained when 50 IU nisin/ml, at 25ºC, are present in the juice, however increases in temperature and decreases in soluble solids concentration make the pH critical values decrease. It is then concluded that nisin incorporation is an alternative for controlling A. acidoterrestris growth in orange juice, as well as the logistics regression model proved to be an important tool for determining the microbial response under critical values of the variables, besides predicting growth probabilities for the different studied conditions. Keywords: predictive modeling, Alicyclobacillus acidoterrestris, orange juice, nisin. __________________
* Autor para correspondencia. E-mail:
[email protected] (W. Luera)
W. Luera y P. Rodriguez de Massaguer / Scientia Agropecuaria 1(2010) 47 - 61
1. Introduction Alicyclobacillus acidoterrestris is a nonpathogenic sporeforming bacterium which was isolated from forest soils and fruit juices with signs of apparent deterioration (Cerny et al., 1984; Pettipher et al., 1997; Walls and Chuyate, 1998; Splisttoesser et al., 1998). Pinhatti et al. (1997) reported detection of Alicyclobacillus in concentrated orange juice originated from several countries. The authors suggested that the occurrence of Alicyclobacillus is incidental, requiring a certain appropriate combination of growth factors, such as low pH and high temperatures for long periods of time. Therefore, concentrations larger than 102 UFC/ml of this microorganism in some juices are not necessarily associated with the contamination of the product. In any case, spores of A. acidoterrestris are considered important targets in the quality control of acid fruit juices, as they are capable to germinate and grow on wide pH ranges: from 2.5 to 6 (Cerny et al., 1984; Yamazaki et al., 1996), from 2.5 to 5.5 (Walls and Chuyate, 1998) and optimum between 3.5 to 5 (Pinhatti et al., 1997). Juice deterioration is manifested by the presence of phenolic compounds causing off-flavor described as medicinal (Walls and Chuyate, 1998; Orr et al., 2000; Jensen and Whitfield, 2003). Besides, the contaminated product may or not present sedimentation at the packaging bottom (Walls and Chuyate, 1998). Thus, procedures and substances that inhibit and/or control spore germination with subsequent growth of bacteria become necessary. Nisin could be an alternative, for presenting high stability in acid conditions, being more soluble at low pHs (Hurs, 1981; Davies et al., 1998). Nisin is non-toxic and maintains stability as antimicrobial at high temperatures, with main effects against sporeforming gram-positive bacteria (Jay, 1994). Komitopoulou et al. (1999) studied the use of nisin (Minimum Inhibiting Concentration - MIC) for
48
controlling spore germination of A. acidoterrestris in orange, apple and grapefruit juices at temperatures of 25 and 44ºC. On the other hand, Yamazaki et al. (2000) determined MIC of nisin in Yeast-PeptoneGlucose-Agar medium (YPGAm) at 46ºC and pHs 3.4 and 4.2. In both studies the factor ranges were not evaluated, however Yamazaki et al. (2000) showed that the sensibility of A. acidoterrestris to nisin varied according to the strain and medium pH. To maintain a stable product, without microbial contamination, a rigorous control is required, with the identification of the main microorganisms and their responses to factors that determine their survival and growth in food products. Thus, mathematical models can be used to describe such information and to interpret the microbial behavior under different physicochemical conditions (Alavi et al., 1999). Predictive models can be used as tools in food industry when they describe the interactions of a number of combined factors (McClure et al., 1994). Probabilistic models based on logistics regression are useful to analyze the description of the growth/no-growth interface, with the possibility of exploring the effects of medium conditions on microbial survival, growth and death responses (Ratkowsky and Ross, 1995; Presser et al., 1998). Logistics regression can be a powerful tool for microbial modeling, which having enough information about the product characteristics and storage conditions can estimate the growth probability of pathogenic or spoiling microorganisms (Lopez-Malo and Palou, 2000). The use of this technique has been reported, not just to describe the effect of individual factors on the growth/no-growth interface (Lopez-Malo et al., 2000), but also to model product shelf life (Peña et al., 2004). The literature shows that germination and growth of A. acidoterrestris were studied only in simple ready-to-drink juices. However, Splittstoesser et al. (1994) demonstrated that the growth of this bacterium can be inhibited
W. Luera y P. Rodriguez de Massaguer / Scientia Agropecuaria 1(2010) 47 - 61
when the content of soluble solids exceeds 18.5°Brix. For this reason, it is necessary to study concentrated juices up to these soluble solids values with minimum nisin doses that can inhibit this microorganism growth. The objectives of this research were: (a) to establish a mathematical model based on logistics regression to describe the growth probability of Alicyclobacillus acidoterrestris in concentrated orange juice, as response to the effects of pH, soluble solids concentration (ºBrix), temperature and nisin concentration, and (b) to predict critical values for these factors that inhibit its growth. 2. Material and methods 2.1. Bacterial strain and culture media Alicyclobacillus acidoterrestris CRA 7152 strain and nisin were provided by Danisco Cultor. Sporulation agar: Alicyclobacillus acidocaldarius medium (AAM) (Murakami et al., 1998): 0.05% MnCl24H2O; 1.5% agar; 1.0 g Yeast extract (Oxoid, Basingstoke, UK); 0.2 g (NH4)2SO4; 0.5g MgSO47H2O; 0.25g CaCl22H2O; 0.60g KH2PO4; 1.0g glucose (Oxoid) and 1000ml water. pH was adjusted to 4.0. Quantification medium K: Peptone5 g (Oxoid); Glucose 1g (Oxoid); Yeast extract 2.5g (Oxoid); Tween-80 1g (Synth); Agar 15g (Difco laboratories, Detroit, MI); Distilled water 1000ml. Medium was sterilized at 121oC for 15 minutes and pH adjusted to 3.7 with malic acid (Vetec) at 25% sterilized by filtration (Walls and Chuyate, 1998). 2.2. Preparation of the spore suspension Initially the growth of viable Alicyclobacillus acidoterrestris cells was produced in 4 slant tubes containing Potato Dextrose Agar, pH 5.6 (PDA-Oxoid), incubated at 44°C for 3 days. After that, the result of growth was collected from tubes by scraping the bottle with sterile glass rods using 5 ml sterile distilled water per tube. The suspension produced was transferred to a sterile screw caped tube (25x200 mm), and activated at
49
80oC for 10 minutes, followed by fast cooling in ice bath until room temperature. A portion (0.1 ml) of activated suspension was inoculated on each of 100 glass bottles (290 ml) containing 60 ml of solidified and slanted medium (AAM) (Yamasaki et al., 2000). Those 100 inoculated bottles inoculated were incubated during 9 days at 45°C. After 90% sporulation of the field confirmed by microscopic observation of spore stain, spore collection was carried out (Murakami et al., 1998). Collected spores were washed and resuspended in sterile distilled water after 3 centrifugations (12310 g / 15 min at 4ºC), followed by alternate washing. Lysozyme at 0.3 mg/ml suspension was added after the first washing, after pH adjustment to 11 for disruption of vegetative cells (Stumbo, 1973). Spore suspension was stored at 4ºC in sterile distilled water until its use. Spores count was performed in K medium after thermal activation for 10 minutes at 80ºC, followed by pour plating. The inverted plates were incubated at 43ºC for 5 days. Concentration of spores suspension was 8x10⁸ spores/ml. 2.3. Determination of the maximum nisin concentration Initially, a test for the determination of the maximum nisin concentration (IU/ml) to be used in the experiment was performed in optimum bacterium growth conditions. The concentrations 100, 80, 70, 50, 25, 12.5, 6.25 and 0 IU nisin/ml juice were tested with pH 4, 11.5°Brix and incubation temperature at 43°C for 6 days (Komitopoulou et al., 1999). Plating was carried out daily in K medium (pH 3.7) and incubated at 43°C for 3-5 days. The inoculum concentration was approximately 7x10⁵ spores/ml juice, activated at 80°C for 10min. 2.4. Experimental design Once the maximum nisin concentration to be used in the experiment was determined, a central composite design was established: 24 (assays 1 to 16) with 3 central points (assays
50
W. Luera y P. Rodriguez de Massaguer / Scientia Agropecuaria 1(2010) 47 - 61
25 to 27) and 8 axial points (assays 17 to 24) (Table 1) (Neto et al., 2002). The factor ranges were: pH (3 to 5.8), temperature (20 to 54oC), oBrix (11 to 19) and nisin concentration (0 to 70 IU/ml); being the variable response the growth or no growth of the microorganism. Temperature, ºBrix and pH were established considering the growth conditions of the A. acidoterrestris. The pH of the orange juice was adjusted with NaOH 5N and malic acid 25% (p/v) and measured with a potentiometer (DMPH-2-Digimed). Table 1 Central experimental composite design for A. acidoterrestris CRA 7152 growth in orange juice. Assays 1 2 3 4 5 6 7 8 9 10 11 12 13 14 15 16 17 18 19 20 21 22 23 24 25 26 27
T(a) 28.5 45.5 28.5 45.5 28.5 45.5 28.5 45.5 28.5 45.5 28.5 45.5 28.5 45.5 28.5 45.5 20 54 37 37 37 37 37 37 37 37 37
Variables pH Ni(b) 3.7 17.5 3.7 17.5 5.1 17.5 5.1 17.5 3.7 52.5 3.7 52.5 5.1 52.5 5.1 52.5 3.7 17.5 3.7 17.5 5.1 17.5 5.1 17.5 3.7 52.5 3.7 52.5 5.1 52.5 5.1 52.5 4.4 35 4.4 35 3 35 5.8 35 4.4 0 4.4 70 4.4 35 4.4 35 4.4 35 4.4 35 4.4 35
Brix(c) 13 13 13 13 13 13 13 13 17 17 17 17 17 17 17 17 15 15 15 15 15 15 11 19 15 15 15
a
T (temperature ºC); bNi (Nisin IU/ml); cBrix (solids soluble concentration)
The different concentrations of juice soluble solids were adjusted with different dilutions of sterile distilled water added in the concentrated orange juice, and measured with
an ATAGO HSRO500 refractometer. All concentrated juice samples were thermally treated at 105oC for 10 min to eliminate the possible presence of competitors (Massaguer et al., 2002). Nisin™ was provided by Danisco Cultor and used after preparing a stock solution containing 104 IU/ml in 0.02 N HCl and sterilized at 1210C for 15 minutes (Scott and Taylor, 1981). The inoculated initial load of A. acidoterrestris CRA 7152 was 2.0x10² spores/ml orange juice, activated at 80oC for 10min, simulating the load commonly reported for concentrated orange juice (Pinhatti et al., 1997). Each assay was duplicated and incubated for 47 days. 2.6. Evaluation of growth and no growth All assays were monitored through daily plating in K medium (pH 3.7) and the plates incubated at 43oC for 3 - 5 days. The assays were classified as positive for growth when the count of cells in the plates was larger than the number of activated spores inoculated at time zero; otherwise they were classified as negative. This criterion was also used by Lopez-Malo and Palou (2000). The growth/no growth responses were analyzed through probabilistic modeling. 2.5. Probabilistic regression
model
of
logistics
The growth/no growth responses obtained in the different assays (Table 1) were adjusted using the logistics regression model, which described the growth probability of bacteria subjected to the combination of the several studied factors. The logistics regression model describes the probability of a certain event Y to happen, conditioned by a vector X. Following, the specific logistics regression model is presented in eq. 1 (Hosmer and Lemjeshow, 2000).
P( x)
ixi 1 exp ixi exp
(1)
W. Luera y P. Rodriguez de Massaguer / Scientia Agropecuaria 1(2010) 47 - 61
Where P(x) it is the probability of growth or no growth. The logit transformation of P(x) is defined as: p( x) Logit ( P) g ( x) Ln ixi (2) 1 p( x) In this research, oBrix, pH, nisin concentration and incubation temperature were the independent variables, and the probability of A. acidoterrestris grows in the concentrated juice was the dependent variable. This response was designated as "1" for growth and "0" for no growth under the studied conditions. Accordingly, the following logit(P) model was chosen: g (x) 0 1 pH 2 Ni 3T 5 Brix 6 pH .Ni 7 pH .T 8 pH .Brix 9 Ni.T 10 Ni.Brix 11T .Brix
(3)
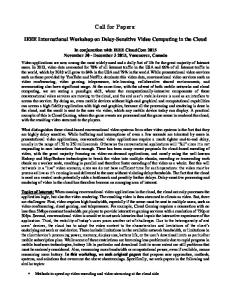
Where β0.......β11 are the model coefficients estimated for the fitting of the experimental data with 0.05 probability, Ni = nisin concentration IU/ml, T = temperature ºC, and ºBrix = soluble solids concentration, using the SPSS 8.0 logistics regression procedure. After fitting the logistics regression model, predictions of growth/no growth interface were done, with 0.05% probability, by replacing the logit value (p(x)) in the model of eq. 1 and calculating the value of an independent variable keeping the other independent variables fixed. Also growth probabilities were calculated using the logistics equation for the studied conditions. 3. Results and Discussion 3.1. Maximum nisin concentration in orange juice for A. acidoterrestris CRA 7152 growth inhibition Figure 1 shows that there was growth in the control (0), 6.25, 12.5, and 25 IU of nisin/ml denoted by the increase in the population initially inoculated. In concentrations of 100, 80 and 70 IU/ml, the effect of nisin was
51
demonstrated by the reduction in the microbial population in one cycle log at least. The concentration 50 IU nisin/ml induced bacteria to a latent state, as they did not grow; however there was no significant reduction in the initial population and after 5 days there was a light tendency to growth. The concentration 100 IU nisin/ml was the most inhibiting for bacteria (up to 2 logarithmic cycles). These results agreed with the ones reported by Yamazaki et al. (2000) for laboratory medium and Komitopoulou et al. (1999) for simple orange juice. With 70 IU nisin/ml there was a clear inhibition of bacterial growth even without reduction of the inoculated population. It is therefore concluded that a range of 0-70 IU nisin/ml can cause some degree of inhibition interacting with other factors, without being required to exceed the dose of the bacteriocin.
Figure 1. Inhibiting effect of nisin on A. acidoterrestris CRA 7152 in orange juice 11.50Brix and pH 4.0 at 430C.
3.2. Growth of Alicyclobacillus acidoterrestris CRA7152 in orange juice Table 2 shows that there was growth in the absence of nisin, assay 21, (370C, pH 4.4; 0 IU nisin/ml and 15 oBrix) in only 1 day of incubation, with the final population reaching the level 107 UFC/ml juice in 7 days. This demonstrate that in conditions of abuse temperature (≥37oC) or in tropical climates there will be fast product deterioration by the development of this species in only 24 hours,
W. Luera y P. Rodriguez de Massaguer / Scientia Agropecuaria 1(2010) 47 - 61
reinforcing the need of appropriate chilling. Walls and Chuyate (1998) observed fast growth in temperatures from 35 to 46oC associated to pHs from 4.5 to 5. On the other hand, Pinhatti et al. (1997) reported optimum pHs for Alicyclobacillus growth between 3.5 to 5. Table 2 Growth and no growth responses of A. acidoterrestris CRA 7152 under the experimental conditions of Table 1. Response Response Assays Response Assays Assays R1 R2 R1 R2 R1 R2 1 0 0 10 1 1 19 0 0 2 1 1 11 1 1 20 1 1 3 12 1 1 21 1 1 1 1 4 1 1 13 0 0 22 0 0 5 0 0 14 23 1 1 0 0 6 1 1 15 0 0 24 0 0 7 0 0 16 1 1 25 1 1 8 1 1 17 0 0 26 1 1 9 0 0 18 0 0 27 1 1 R1, R2 (repetitions)
With incubation at 45.5oC, region of optimum temperature (Cerny et al., 2000), and any condition of the tested values of pH, oBrix and nisin, there was increase in the microbial population, except for assay 14 (pH 3.7, nisin 52.5 IU/ml and 17oBrix). In all these assays, it is believed that the high temperature was the most important factor to obtain positive responses ("1") of growth affecting the retention of bacteriocin activity. DelvesBroughton (1990) studied the retention of nisin activity in cheese during storage at 20, 25 and 30ºC, showing that losses were more substantial at higher temperatures and pHs. In the assay 14, the influence of high nisin concentration associated with high soluble solids concentration (low water activity) were decisive for the no increase in the microbial population, being therefore designated as "0". Komitopoulou et al. (1999) showed that 50 IU nisin/ml in simple orange juice caused little growth with approximately double the load initially inoculated, in 6 days of incubation at 44oC. However, in this work, inhibition was obtained with 52.5IU/ml juice, pH 3.7 and
52
17oBrix, for up to 47 days of incubation at 45.5oC. Such result is relevant for cases of orange juice transported in conditions of abuse temperatures of up to 45.5oC. A strong temperature effect was found for samples incubated at 28.5oC, since there was growth in only assays 3 (pH 5.1, 17.5 IU nisin /ml and 13o Brix) and 11 (pH 5.1; 17.5 IU nisin/ml and 17oBrix), with very small final populations, only doubling the load initially inoculated. In these assays, the pH value 5.1 reduced the nisin inhibiting activity favoring bacterial growth. Delves-Broughton (1990) reported that the loss of nisin activity is more pronounced at high pH values. Shifting the focus, several authors (Pettipher et al., 1997; Walls and Chuyate, 2000; Eguchi et al., 2001) reported minimum growth temperatures between 20 and 25oC. However, different combinations of pH, relatively low nisin concentration, and oBrix proved to be inhibiting at 28.5oC, for 47 days incubation. The assays representing the axial points (assays 17 to 24) showed growth only in the assays 20 (370C, pH 5.8, 35 IU nisin/ml, 15oBrix); 21 (370C, pH 4.4, 0 IU nisin/ml, 15oBrix) and 23 (37oC, pH 4.4, 35 IU nisin/ml, 11oBrix). For the assay 21, the pH effect, optimum temperature and nisin absence promoted growth. In relation to the axial points 17 (200C, pH 4.4, 35IU nisin/ml, 15oBrix); 18 (540C, pH 4.4, 35 IU nisin/ml, 15oBrix); 19 (370C, pH 3, 35 IU nisin/ ml, 15oBrix); 22 (37oC, pH 4.4, 70 IU nisin /ml, 15oBrix) and 24 (37oC, pH 4.4, 35 IU nisin/ml, 19oBrix), each factor in its extreme value was decisive in not allowing the increase in bacterial population, which was designated as "0". Yet, there was positive growth "1" for samples that represented the central points (assays 25 to 27 with more favorable growth conditions) during incubation. 3.3. Probabilistic modeling Using the results growth/no growth in the orange concentrate after 47 days of
W. Luera y P. Rodriguez de Massaguer / Scientia Agropecuaria 1(2010) 47 - 61
incubation, a logistics regression model was adjusted to describe the growth probability (p(growth)) of bacteria as response to the influence of the factors pH, nisin concentration, temperature and oBrix. The fitting of the data in table 2 to equation 3 by logistics regression, eliminating the nonsignificant coefficients (p0.05), is shown in table 3. An analysis of individual factors showed that only the variable oBrix, individually, did not affect the results; however its interaction with temperature did. The regression analysis confirmed that the other factors (T, pH, and nisin concentration) were highly significant. Table 3 Significant variables for the probabilistic model Coefficient
Standard deviation
p-value
-14.4125
4.8079
0.0027
Temperature
0.4202
0.1394
0.0026
pH
2.4888
0.8697
0.0042
Nisin
-0.1006
0.0351
0.0041
Brix*Temperature
-0.0144
0.067
0.0309
Estimated variable Constant
The classification of the correct adjusted percentage for the model showed that 96.30% of the data were appropriately classified by the model, with only 2 cases of misclassification, which were predicted as growth, however experimentally they were observed as no growth. The prediction of data with growth ('1') was 100% correct. The good fitting of the model was tested by the chisquare test and the likelihood ratio (Table 4). Table 4 Percentage of correct data fitted by the model Observed response
Predicted response No growth Growth % (0) (1) Correct
No growth (0)
22
2
Growth (1)
0
30
Global
91.67 100 96.3
53
Probabilistic microbial models based on logistics regression were reported for several microorganisms, Listeria monocytogenes (Hwang, 2009), Shigella flexneri (Ratkowsky and Ross, 1995), Saccharomyces cerevisiae (Lopez-Malo et al., 2000), Aspergillus carbonarius (Marin et al., 2009) showing the flexibility in the logistic model construction. It is possible to introduce in the kinetic models of square root type (Ratkwsky and Ross, 1995; Lanciotti et al., 2001) or polynomial models (Lopez-malo and Palou, 2000; Peña et al., 2004). However, in each case of growth/no growth it is required to fix an appropriate incubation time to evaluate these microbial responses. The probabilistic model established resulted in equation 4. Using the model of equation 4, the A. acidoterrestris growth probabilities were predicted (values between 0 and 1) for different combinations of pH, temperature, o Brix and nisin concentration (Tables 5 to 7). These data are of great interest for the juice industries. For orange juices with pH 3 (Table 5), the growth probabilities were very small (smaller than 0.005), as it was expected for 70 IU nisin in juice with 17oBrix, up to the incubation temperature of 48ºC. As the concentration of soluble solids and nisin decreased, this probability increased, but the same did not happen with temperature, which conversely gave lower growth probabilities with its decrease. Thus, with simple juice, pH 3, 40 IU/ml and 60 IU/ml of nisin, it is possible to withstand an abuse temperature up to 31oC and 38ºC, respectively, at 0.05 growth probability. As the nisin concentration was lowered, it was necessary to reduce the temperature to maintain low levels of growth probability. With simple juice (11oBrix) and pHs between 3.5 and 3.7 the model indicates that no-growth probabilities (≥0.95) can be obtained only with nisin concentration of 70 IU/ml and abuse temperatures of incubation up to 36oC (Tables 6 and 7).
54
W. Luera y P. Rodriguez de Massaguer / Scientia Agropecuaria 1(2010) 47 - 61
P(cresc)
exp 14.4125 0.4202 * T 2.4888 pH 0.1006 * Ni sin a 0.0144 Brix * T 1 exp( 14.4125 0.4202 * T 2.4888 pH 0.1006 * Ni sin a 0.0144Brix * T )
(4)
Table 5 Growth probabilities at p=0.05 of A. acidoterrestris CRA 7152 in orange juice at pH 3.0 and different values of T, oBrix and nisin concentration. 11oBrix
Nisin concentration (IU/mL)
T oC
0
10
20
30
40
50
60
70
20
0.1532
0.0620
0.0236
0.0088
0.0032
0.0012
0.0004
0.0002
24
0.3401
0.1586
0.0645
0.0246
0.0091
0.0034
0.0012
0.0005
28
0.5949
0.3494
0.1641
0.0670
0.0256
0.0095
0.0035
0.0013
32
0.8071
0.6048
0.3588
0.1699
0.0696
0.0266
0.0099
0.0036
36
0.9226
0.8135
0.6146
0.3684
0.1758
0.0723
0.0277
0.0103
40
0.9714
0.9255
0.8196
0.6243
0.3780
0.1818
0.0752
0.0289
44
0.9898
0.9725
0.9283
0.8256
0.6339
0.3877
0.1880
0.0781
48
0.9964
0.9902
0.9736
0.9310
0.8315
0.6434
0.3975
0.1944
o
15 Brix
Nisin concentration (IU/mL)
T oC
0
10
20
30
40
50
60
70
20
0.0541
0.0205
0.0076
0.0028
0.0010
0.0004
0.0001
0.0000
24
0.1145
0.0452
0.0170
0.0063
0.0023
0.0008
0.0003
0.0001
28
0.2264
0.0967
0.0377
0.0141
0.0052
0.0019
0.0007
0.0003
32
0.3985
0.1950
0.0814
0.0314
0.0117
0.0043
0.0016
0.0006
36
0.5999
0.3541
0.1670
0.0683
0.0261
0.0097
0.0036
0.0013
40
0.7724
0.5538
0.3121
0.1423
0.0572
0.0217
0.0080
0.0030
44
0.8848
0.7374
0.5067
0.2730
0.1208
0.0478
0.0180
0.0067
48
0.9456
0.8641
0.6992
0.4595
0.2371
0.1021
0.0399
0.0150
o
17 Brix
Nisin concentration (IU/mL)
ToC
0
10
20
30
40
50
60
70
20
0.0311
0.0116
0.0043
0.0016
0.0006
0.0002
0.0001
0.0000
24
0.0609
0.0231
0.0086
0.0032
0.0012
0.0004
0.0002
0.0001
28
0.1156
0.0456
0.0172
0.0064
0.0023
0.0009
0.0003
0.0001
32
0.2086
0.0879
0.0340
0.0127
0.0047
0.0017
0.0006
0.0002
36
0.3471
0.1628
0.0664
0.0253
0.0094
0.0035
0.0013
0.0005
40
0.5175
0.2817
0.1254
0.0498
0.0188
0.0070
0.0026
0.0009
44
0.6838
0.4416
0.2243
0.0957
0.0372
0.0139
0.0051
0.0019
48
0.8135
0.6147
0.3684
0.1758
0.0724
0.0277
0.0103
0.0038
55
W. Luera y P. Rodriguez de Massaguer / Scientia Agropecuaria 1(2010) 47 - 61
Table 6 Growth probabilities at p=0.05 of A. acidoterrestris CRA 7152 in orange juice at pH 3.5 and different values of T, oBrix and nisin concentration. 11oBrix
Nisin concentration (IU/mL)
o
T C
0
10
20
30
40
50
60
70
20
0.3856
0.1867
0.0774
0.0298
0.0111
0.0041
0.0015
0.0005
24
0.6414
0.3954
0.1930
0.0804
0.0310
0.0116
0.0043
0.0016
28
0.8360
0.6508
0.4053
0.1995
0.0835
0.0323
0.0120
0.0044
32
0.9356
0.8416
0.6601
0.4153
0.2062
0.0867
0.0336
0.0125
36
0.9764
0.9380
0.8470
0.6693
0.4253
0.2130
0.0901
0.0349
40
0.9916
0.9773
0.9404
0.8522
0.6784
0.4354
0.2200
0.0935
44
0.9970
0.9919
0.9782
0.9426
0.8574
0.6873
0.4456
0.2271
48
0.9990
0.9972
0.9923
0.9791
0.9448
0.8623
0.6961
0.4558
o
15 Brix
Nisin concentration (IU/mL)
o
T C
0
10
20
30
40
50
60
70
20
0.1655
0.0676
0.0258
0.0096
0.0035
0.0013
0.0005
0.0002
24
0.3098
0.1410
0.0566
0.0215
0.0080
0.0029
0.0011
0.0004
28
0.5040
0.2709
0.1196
0.0473
0.0178
0.0066
0.0024
0.0009
32
0.6969
0.4568
0.2352
0.1011
0.0395
0.0148
0.0055
0.0020
36
0.8388
0.6555
0.4104
0.2029
0.0851
0.0329
0.0123
0.0045
40
0.9217
0.8116
0.6117
0.3655
0.1740
0.0715
0.0274
0.0102
44
0.9638
0.9070
0.7809
0.5659
0.3228
0.1484
0.0599
0.0228
48
0.9837
0.9566
0.8897
0.7469
0.5190
0.2829
0.1261
0.0501
o
17 Brix
Nisin concentration (IU/mL)
o
T C
0
10
20
30
40
50
60
70
20
0.1003
0.0392
0.0147
0.0054
0.0020
0.0007
0.0003
0.0001
24
0.1836
0.0760
0.0292
0.0109
0.0040
0.0015
0.0005
0.0002
28
0.3121
0.1423
0.0572
0.0217
0.0080
0.0030
0.0011
0.0004
32
0.4778
0.2507
0.1090
0.0428
0.0161
0.0059
0.0022
0.0008
36
0.6486
0.4029
0.1979
0.0828
0.0319
0.0119
0.0044
0.0016
40
0.7882
0.5765
0.3323
0.1540
0.0624
0.0238
0.0088
0.0032
44
0.8825
0.7330
0.5010
0.2685
0.1184
0.0468
0.0176
0.0065
48
0.9381
0.8470
0.6694
0.4254
0.2131
0.0901
0.0349
0.0131
To maintain these no growth probabilities with decrease in nisin concentration requires decrease of the incubation temperature. Simple juice with pH 3.7 and 60 IU/ml can be stored to a maximum temperature of 32 oC. This demonstrates that with contamination of Alicyclobacillus in the juice at levels of 102 spores/ml, the spoilage will only be prevented
with addition of several nisin concentrations and a rigorous control of the transport temperature or refrigerated storage. However, the found model predicts these probabilities for a shelf life of 47 days of storage under the different factor conditions, in practice this should be avoided mainly under conditions of abuse temperature. Prolonged exposure to
56
W. Luera y P. Rodriguez de Massaguer / Scientia Agropecuaria 1(2010) 47 - 61
these temperatures will increase the probability of bacterial growth and consequently the deterioration of the product. The correct balance of these preservation
factors (pH, Brix, and temperature) will allow the reduction in the growth probability of A. acidoterrestris guaranteeing the final product a microbiologically stable shelf life.
Table 7 Growth probabilities at p=0.05 of A. acidoterrestris CRA 7152 in orange juice at pH 3.7 and different values of T, oBrix and nisin concentration. 11oBrix
Nisin concentration (IU/mL)
T oC
0
10
20
30
40
50
60
70
20
0.5080
0.2741
0.1213
0.0481
0.0181
0.0067
0.0025
0.0009
24
0.7464
0.5183
0.2824
0.1258
0.0500
0.0189
0.0070
0.0026
28
0.8934
0.7541
0.5286
0.2908
0.1304
0.0520
0.0197
0.0073
32
0.9598
0.8973
0.7616
0.5388
0.2994
0.1351
0.0540
0.0205
36
0.9855
0.9614
0.9010
0.7690
0.5491
0.3081
0.1400
0.0562
40
0.9949
0.9861
0.9629
0.9047
0.7763
0.5592
0.3169
0.1451
44
0.9982
0.9951
0.9867
0.9643
0.9082
0.7833
0.5694
0.3259
48
0.9994
0.9983
0.9953
0.9872
0.9657
0.9115
0.7903
0.5794
15oBrix
Nisin concentration (IU/mL)
o
T C
0
10
20
30
40
50
60
70
20
0.2460
0.1066
0.0418
0.0157
0.0058
0.0021
0.0008
0.0003
24
0.4248
0.2126
0.0899
0.0349
0.0130
0.0048
0.0018
0.0006
28
0.6257
0.3793
0.1827
0.0756
0.0290
0.0108
0.0040
0.0015
32
0.7909
0.5804
0.3359
0.1561
0.0634
0.0241
0.0090
0.0033
36
0.8954
0.7579
0.5338
0.2951
0.1328
0.0530
0.0201
0.0074
40
0.9509
0.8763
0.7215
0.4865
0.2573
0.1125
0.0443
0.0167
44
0.9777
0.9413
0.8543
0.6820
0.4395
0.2228
0.0949
0.0369
48
0.9900
0.9732
0.9299
0.8292
0.6396
0.3936
0.1918
0.0799
17oBrix
Nisin concentration (IU/mL)
T ºC
0
10
20
30
40
50
60
70
20
0.1550
0.0629
0.0239
0.0089
0.0033
0.0012
0.0004
0.0002
24
0.2701
0.1192
0.0471
0.0178
0.0066
0.0024
0.0009
0.0003
28
0.4273
0.2144
0.0907
0.0352
0.0132
0.0049
0.0018
0.0007
32
0.6008
0.3550
0.1675
0.0686
0.0262
0.0097
0.0036
0.0013
36
0.7522
0.5261
0.2887
0.1293
0.0515
0.0195
0.0072
0.0026
40
0.8596
0.6913
0.4502
0.2304
0.0987
0.0385
0.0144
0.0053
44
0.9251
0.8187
0.6228
0.3765
0.1809
0.0747
0.0287
0.0107
48
0.9614
0.9011
0.7691
0.5492
0.3082
0.1401
0.0562
0.0213
W. Luera y P. Rodriguez de Massaguer / Scientia Agropecuaria 1(2010) 47 - 61
Figures 2 and 3 represent the surfaces of some tested conditions, clearly showing the effect of the studied variables on the growth probability of A. acidoterrestris in orange juice. In figure 3(a) the model suggests growth with low probabilities. a maximum of 0.5, for juices with 11°Brix and incubation temperature of 20°C. This level of probability
57
can be lowered to 0.05 when 20-30 IU/ml nisin is added into the juice. This is important because although the literature reports minimum growth temperatures between 20 and 25ºC, depending on the strain, the model would be predicting on the safe side.
(a)
(b)
Figure 2. Growth probability of A. acidoterrestris CRA 7152 in orange juice as a function of temperature of incubation and Brix: pH 3.7: (a) 0 nisin. (b) 50 IU nisin.
(a)
(b)
Figure 3. Growth probability of A. acidoterrestris CRA 7152 in orange juice as a function of oBrix and nisin concentration: pH 3.7. (a) 20oC. (b) 30oC.
58
W. Luera y P. Rodriguez de Massaguer / Scientia Agropecuaria 1(2010) 47 - 61
The Tables 8 to 10 show the critical values (from which inhibition or growth of the microorganism to a given probability can take place) predicted by the model of equation 4 for the different studied factors. Table 9 shows that with 20 IU nisin/ml at 20ºC, the critical pH would be 3.3 for juices with 11ºBrix. Increasing the concentration of soluble solids to 15 and 17 ºBrix and maintaining the same temperature, the minimum pH would change to 3.8 and 4.0 respectively; in other words, there would be greater tolerance for this factor to inhibit the bacterial growth.
As the nisin concentration increases, the minimum value of pH also increases. Consequently, it is possible to have minimum pH values up to 4.5, with 50 IU nisin/ml. incubated at 20, 25 and 30ºC for juices with 11, 15 and 17 ºBrix respectively. This information is important when using raw material at different stages of maturation and for preparing mixtures of juices from different varieties. At room temperature between 25 and 35ºC with 50 IU nisin/ml. the critical pH values were 2.9 to 4.0; 3.8 to 4.6; and 4.2 to 4.9 for juices with 11, 15 and 17ºBrix respectively.
Table 8 Critical pH predicted with p=0.05 of A. acidoterrestris CRAA 7152 in orange juice
Table 9 Critical temperature predicted with p=0.05 of A. acidoterrestris CRA 7152 in orange juice
11oBrix
11oBrix
Nisin (IU/mL)
Nisin (IU/mL)
T (ºC)
0
10
20
30
40
50
60
70
pH
0
10
20
-
2.9
3.3
3.7
4.1
4.5
4.9
5.3
3
-
-
25
-
-
-
3.2
3.6
4.0
4.4
4.8
3.5
-
-
-
21.9 25.7 29.6 33.4 37.2
30
-
-
-
-
3.1
3.5
3.9
4.3
3.7
-
-
-
20.0 23.8 27.7 31.5 35.3
35
-
-
-
-
-
2.9
3.4
3.8
4
-
-
-
-
40
-
-
-
-
-
-
-
3.2
4.4
-
-
-
-
-
45
-
-
-
-
-
-
-
-
5.1
-
-
-
-
-
o
15 Brix
20
15 Brix
60
70
21.0 24.8 28.6 32.5 21.0 24.8 28.7 -
18.2 22.0
Nisin (IU/mL) 0
-
3
-
-
23.1 28.0 33.0 37.9 42.8 47.7 20.7 25.6 30.5 35.5 40.4 45.3
0
10
20
30
40
50
60
70
20
3.0
3.4
3.8
4.2
4.6
5.0
5.4
10
20
30
25
-
3.0
3.4
3.8
4.2
4.6
5.0
5.4
30
-
-
3.0
3.4
3.8
4.2
4.6
5.0
3.7
-
-
35
-
-
-
2.9
3.4
3.8
4.2
4.6
4
-
-
-
40
-
-
-
-
2.9
3.3
3.8
4.2
4.4
-
-
-
-
45
-
-
-
-
-
2.9
3.3
3.7
5.1
-
-
-
-
o
17 Brix
Nisin (IU/mL)
40
50
60
70
24.3 29.2 34.1 39.1 44.0 48.9 53.8
3.5
17 Brix
50
pH
T (ºC)
o
40
22.8 26.6 30.5 34.3 38.2 42.0
o
Nisin (IU/mL)
30
21.9 26.9 31.8 36.7 41.7 22.0 26.9 31.9 36.8 -
-
23.3 28.2
Nisin (IU/mL)
T (ºC)
0
10
20
30
40
50
60
70
pH
20
3.2
3.6
4.0
4.4
4.8
5.2
5.6
-
3
25
-
3.3
3.7
4.1
4.5
4.9
5.3
-
3.5
-
30
-
-
3.3
3.7
4.1
4.5
4.9
5.3
3.7
-
-
35
-
-
-
3.4
3.8
4.2
4.6
5.0
4
-
-
-
25.5 31.3 37.0 42.8 48.5
-
-
-
19.9 25.6 31.3 37.1 42.8
-
-
-
40
-
-
-
3.0
3.4
3.8
4.2
4.6
4.4
45
-
-
-
-
3.1
3.5
3.9
4.3
5.1
0
10
20
30
40
50
22.5 28.3 34.0 39.7 45.5 51.2
60
70
-
-
21.2 26.9 32.6 38.4 44.1 49.9 24.1 29.8 35.5 41.3 47.0
-
-
-
21.4 27.1 32.9
W. Luera y P. Rodriguez de Massaguer / Scientia Agropecuaria 1(2010) 47 - 61
For juices with pH ranging from 3.5 to 4 and 50 IU nisin/ml, maximum temperatures from 37 - 44ºC, 31.8 – 37.9ºC and 24.8-29.6ºC can be tolerated, for juices with 17, 15 and 11ºBrix respectively. For juice with 11ºBrix, pH 3.7 and 50 IU nisin/ml, the temperature of 27.7ºC becomes critical to controlling growth, but when 70 IU nisin/ml is used, tolerance for temperatures higher than 35.3ºC increases. Table 10 shows the critical values of nisin concentration (minimum concentrations to inhibit bacterial growth) with 0.05 growth probability for A. acidoterrestris. These minimum values can be obtained depending on the incubation temperature and the pH. Table 10 Critical nisin concentration for A. acidoterrestris CRA 7152 growth at p=0.05 in orange juice. 11oBrix
Temperature (oC)
pH
20
25
30
35
40
45
3
12.2
25.2
38.2
51.2
64.2
-
3.5
24.6
37.6
50.6
63.6
-
-
3.7
29.5
42.5
55.5
68.5
-
-
4
36.9
49.9
63.0
-
-
-
4.4
46.8
59.8
-
-
-
-
o
o
15 Brix
Temperature ( C)
pH
20
25
30
35
40
45
3
0.8
10.9
21.0
31.2
41.3
51.5
3.5
13.1
23.3
33.4
43.6
53.7
63.9
3.7
18.1
28.2
38.4
48.5
58.7
68.8
4
25.5
35.6
45.8
55.9
66.1
-
4.4
35.4
45.5
55.7
65.8
-
-
o
o
17 Brix
Temperature ( C)
pH
20
25
30
35
40
45
3
-
-
3.9
11.2
18.4
25.7
3.5
1.7
9.0
16.2
23.5
30.8
38.1
3.7
6.6
13.9
21.2
28.5
35.8
43.0
4
14.0
21.3
28.6
35.9
43.2
50.5
4.4
23.9
31.2
38.5
45.8
53.1
60.4
Therefore, in juices with 17oBrix and pH 3.0, 3.9 IU nisin/ml is necessary to avoid bacterial growth at 30ºC, yet at 45ºC, 25.7 IU/ml have
59
to be added in the product. Juice with 11ºBrix and pH 3.7 requires 29.5 IU nisin/ml when incubated at 20ºC and 68.5 IU/ml at 35ºC; however at 25 and 30ºC, 42.5 and 55.5 IUnisin/ml respectively is needed; although the Minimum Inhibiting Concentration calculated by Komotopoulou et al. (1999) was established at 100 IU/ml. This work showed that smaller amounts can be used in combination with the other factors to inhibit bacteria with 0.95 probability. Predictive models can provide great assistance in decision-making in the different important sectors of food industry. In practice, the relation that models the growth/no growth interface provides exact descriptions of conditions that can be applied to the control of a process or to specify a formulation to assure the absence of pathogenic or spoiling microorganism growth. According to McMeekin et al. (2000), this technique offers a mechanism for establishing limits on the studied variables that the juice processor should take into account. By knowing this region, it is also possible to study the physiological mechanism of any side of the interface, since it is expected that several events taking place in the interface can have inverted responses. There are no published data of predictive modeling in orange juice to inhibit the growth of A. acidoterrestris as a function of intrinsic and extrinsic factors, being this pioneering work and its results of great importance for the Brazilian juice industry. 4. Conclusions The use of nisin is an alternative method to control Alicyclobacillus acidoterrestris growth in orange juice; 100 IU nisin/ml were enough to inhibit and reduce the population of A. acicoterrestris CRA 7152 in 2 logarithmic cycles. However when used in combination with other factors such as Brix, temperature and pH, lower concentrations can be used; the probabilistic model of logistics regression proved to be an important tool to determine
W. Luera and P. Rodríguez de Massaguer / Scientia Agropecuaria 1(2010) 47 - 61
the microbial response to the critical values of the factors, as well as predicting growth probabilities for the different combinations of the studied variables; critical values of pH and temperature can be established to reduce nisin level in juice allowing the inhibition of bacterial growth. Acknowledgments To Fapesp – São Paulo State Research Foundation (Fundação de Amparo à Pesquisa do Estado de São Paulo) for the financial support. SucoRico S.A. for supplying concentrated orange juice. Danisco Cultor Brazil for supplying nisin. References Alavi, S.H.; Peri, V.M.; Knabel, S.J.; Mohtar, R.H.; Whiting, R.C. 1999. Development and validation of a dynamic growth model for Listeria monocytogenes in fluid whole milk. Journal of food protection 62: 170-176. Cerny, G.; Duong, H.A.; Wennlich, W.; Miller, S. 2000. Alicyclobacillus acidoterrestris: influence of oxygen content on growth in fruit juices. Food Australia 52(7): 289-291. Cerny, G.; Hennlich, W.; Poralla, K. 1984. Spoilage of fruit juice by bacilli: Isolation and characterization of the spoiling microorganism. Z. Lebens. Unters. Forsch. 179: 224-227. Davies, E.A.; Beviss, H.E.; Potter, R.; Harris, J.; Williams, G.C.; Delves-Broughton. J. 1998. Research note: the effect of ph on the stability of nisin solution during autoclaving. Letters Applied microbiology 27: 186-187. Delves-Broughton, J. 1990. Nisin and its uses as a food preservative. Food Technol. 44(11): 100-117. Eguchi. S.Y.; Manfio. G.P.; Pinhatti. E.A.; Variane. S.F. 2001. Acidothermophilic sporeforming bactéria (ATSB) in orange juices: Detection Methods. Ecology. and Involvement in the Deterioration of Fruit Juices-Report of the research project-part III. Fruit Processing 3: 95101. Hwang, C. 2009. The probablility of growth of Listeria monocytogenes in cooked salmon and tryptic soy broth as affected by salt. smoke compound. and storage temperature. Food Microbiology 26(3): 253-258. Hosmer, D.W.; Leweshow, S.; 2000. Applied logistic regression. Second edition. John Wiley & Sons. INC. New York. pp.375. Hurst, A. 1981. Nisin. Adv Applied Microbiology 27: 85123. Jay, J.M. 1994. Microbiologia moderna de los alimentos. Ed. Acribia. Zaragoza España. pp.325-326. Jensen, N.; Whitfield. F.B.; 2003. Role of Alicyclobacillos acidoterrestris in the development of a disinfectant taint shelf-stable fruit juice. Letters in Applied microbiology 36: 9-14.
60
Komitopoulou, E.; Boziaris, I.S.; Davies, E.A.; DelvesBroughton, J.; Adams, M.R. 1999. Alicyclobacillus acidoterrestris in fruit juices and its control by nisin. J. Food Sci. and Technol 34: 81–85. Lanciotti, R.; Sinigaglia, M.; Gardini, F.; Vannini, L.; Guerzoni. M.E. 2001. Growth/no growth interface of Bacillus cereus. Staphylococcus aureus and Salmonella enteritidis in model systems based on water activity. pH. temperature and ethanol concentration. Food microbiology 18: 659-668. Lopez–Malo, A.; Guerrero, S.; Alzamora, S.M. 2000. Probabilistic modeling of Saccharomyces cerevisiae inhibition under the effects of water activity. ph and potassium sorbate concentration. Journal of food protection 63(1): 91-95. Lopez-Malo, A.; Palou, E.; 2000. Modeling the growth/nogrowth interface of Zigosaccharomyces bailli in mango puree. Journal of food science 65(3): 516-520. Marin, S.; Hodzic, I.; Ramos, A.; Sanchis, V. 2009. Predictive the growth/no-growth boundary and ochatoxin A production by Aspergillus carbonarius in pistachio nuts. Food Microbiology 25(5): 683-689. Massaguer, P.R.; Pacheco. P.C.; Atarassi, M.M.; Peña, W.L.; Gonçalves. A.C.; Paula. N.A.; Geraldini. L.H.; Liossi. L.L.; Gagliazzi. M.R.; Guerra. V.A. 2002. Sensibility and Specifity of Methods for Alicyclobacillus Detection and Quantification: A collaborative study. Fruit Processing 11: 478-482. McClure, P.J.; Cole, M.B.; Davies, K.W.; 1994. An example of stages in the development of a predictive mathematical model for microbial growth: the effects of NaCl. pH and temperature on the growth of Aeromonas hydrophila. International J. Food Midrobiology 23: 359375. McMeekin, T.A.; Presser, K.; Ratkowsky, D.; Ross. T.; Salter. M.; Tienungoon. S. 2000. Quantifying the hurdle concept by modeling the bacterial growth/no growth interface. International Journal Food Microbiology 55: 93-98. Murakami, M.; Tedzuka, H.; Yamazaki, K. 1998. Thermal resistence of Alicyclobacillus acidoterrestris spores in different buffers and pH. Food Microbiology 15: 577-582. Neto, B.B.; Scarminio, I.S.; Bruns, R.E. 2002. Como fazer experimentos segunda edição. Editora Unicamp. Pp.401. Orr, R.V.; Shewfelt, R.L.; Huang, J.C.; Tefera, S.; Beuchat. L.R. 2000. Detection of guaiacol produced by Alicyclobacillus acidoterrestris in apple juice by sensory and chromatographic analyses and comparison with spore and vegetative cell populations. Journal of food protection 63(11): 1517-1522. Peña, W.L.; Faria, J.A.; Massaguer, P.R. 2004. Development of a predictive model on the growth of the spoilage mould. Paecilomyces variotii. in pineapple juice. Fruit processing 6: 420-426. Pettipher, G.L.; Osmundson, M.E.; Murphy, J.M. 1997. Methods for the detection an enumeration of Alicyclobacillus acidoterrestris and investigation of growth and production of taint in fruit juice and fruit juice-containing drinks. Lett. Appl. Microbiol 24: 185189. Pinhatti, M.E.M.C.; Variani, S.; Eguchi, S.Y.; Manfio, G.P. 1997. Detection of Acidothermophilic bacilli in industrialized fruit juices. Fruit processing 9: 350-353.
W. Luera and P. Rodríguez de Massaguer / Scientia Agropecuaria 1(2010) 47 - 61 Presser, K.A.; Ross. T.; Ratkowsky. D.A. 1998. Modelling the growth limits (growth/no growth interface) of Escherichia coli as a function of temperature. pH. lactic acid concentration and water activity. Applied and Environmental microbiology 5: 1773-1779. Ratkowsky, D.A.; Ross, T. 1995. Modelling the bacterial growth/no growth interface. Letters in Applied Microbiology 20: 29-33. Scott, V.N.; Taylor, S.L. 1981. Temperature. pH and spore load effects on the ability of nisin to prevent the outgrowth of C. botulinum spores. Journal of food science 46: 121-125. Splittstoesser. D.F.; Lee, C.Y.; Churey, J.J. 1998. Control of Alicyclobacillus in the juice industry. Dairy food and environmental sanitation 18(9): 585-587. Splittstoesser, D.F.; Churey, J.J.; Lee, C.Y. 1994. Growth characteristics of aciduric sporeforming bacilli isolated from fruit juices. Journal of food protection 57(12): 10801083.
61
Stumbo, C.R. 1973. Thermobacteriology in food processing. Academic press. New york. pp.236. Walls, I.; Chuyate, R. 1998. Alicyclobacillus-historical perspective and preliminary characterization study. Dairy food and environmental sanitization 18(8): 495-503. Walls, I.; Chuyate, R.; 2000. Spoilage of fruit juice by Alicyclobacillus acidoterrestris. Food Australia 527: 286288. Yamazaki, K.; Murakami, M.; Kawi, Y.; Inoue, N.; Matsuda. T. 2000. Use of nisin for inibition of Alicyclobacillus acidoterrestris in acidic drinks. Food microbiology 17: 315–320. Yamazaki, K.; Teduka, H.; Shinano, H. 1996. Isolation and identification of Alicyclobacillus acidoterrestris from acidic beverages. Biosc. Biotech. Biochem. 60(3): 543545.