PHYSICAL REVIEW B
VOLUME 58, NUMBER 14
1 OCTOBER 1998-II
Influence of solid-state effects on the K b -to-K a x-ray intensity ratios of Ni and Cu in various silicide compounds S. Raj, B. B. Dhal, and H. C. Padhi Institute of Physics, Bhubaneswar-751005, India
M. Polasik Faculty of Chemistry, Nicholas Copernicus University, 87-100 Torun´, Poland ~Received 13 December 1996; revised manuscript received 2 February 1998! K b -to-K a x-ray intensity ratios of Ni and Cu in various silicide compounds Ni2Si, NiSi, Ni2Si3 , NiSi2 , Cu2Si, CuSi, and CuSi2 have been measured following excitation by 59.54 keV g rays from a 200 mCi 241Am point source. Comparison of the intensity ratios for Ni with the multiconfiguration Dirac-Fock calculations indicates decreasing 3d electron population with the increase of silicon concentration, a trend similar to the one predicted by the previous theoretical calculations @O. Bisi and C. Calandra, J. Phys. C 14, 5479 ~1982!#. However, quantitatively our results for the Ni 3d electron population are different from the results reported there. The intensity ratios for Ni and Cu in disilicide compounds indicate enhancement of the K b -to-K a ratio over the pure metal values, but for the other silicide compounds the Ni intensity ratios show opposite behavior than Cu, suggesting a difference in the nature of electron delocalization. @S0163-1829~98!04737-7#
I. INTRODUCTION
The structural and electronic properties of 3d metal silicides are receiving increasing attention in connection with efforts to understand the behavior of the reactive Si-metal interfaces.1 Most 3d transition metals and near noble metals can react with silicon to form thin silicidelike phases. These phases play a very important role in determining the properties of electronic devices and the study of their electronic structure is of paramount importance. To better understand chemical bonding at the interface and to identify potential structural and electronic differences between bulk silicide and these silicidelike phases, one must examine both bulk and interface silicides. However, very little is known about the electronic structure of bulk silicides. In this paper we present our experimental results on relative K x-ray intensities of Ni and Cu in various silicide compounds. In the past, the study of relative K x-ray intensities had provided useful information on the electronic structure of 3d transition metals in their alloys and compounds.2–14 Previous study on the electronic structure of bulk Ni silicides from photoelectron energy distribution measurements by Franciosi, Weaver, and Schmidt15 revealed interesting differences in electronic bonding in Ni2Si, NiSi, and NiSi2. Their study had also suggested that the Ni d character becomes more atomiclike as the Ni concentration decreases. Theoretical calculations16 also confirmed this trend, showing the electronic configuration of Ni to go from about 3d 8.74sp 1.2 in Ni2Si to 3d 8.64s p 1.3 in NiSi and 3d 8.34s p 1.5 in NiSi2. In a number of x-ray spectral studies of 3d transition metals, it has been observed that the K b -to-K a intensity ratios are dependent on the physical and chemical environments of the elements in the samples. In studies of 3d metal compounds,4–14 the influence of chemical effects has shown differences in the K b -to-K a ratios up to nearly 10%. Such 0163-1829/98/58~14!/9025~5!/$15.00
PRB 58
chemical effects can be caused either by contraction of 3p orbitals, which is in turn due to a screening altered by a varying 3d charge delocalization, or by the admixture p states from the ligand atoms to the 3d state of the metal through d-p hybridization, or both. In 3d metal compounds, the d-p hybridization along with 3d electron delocalization are responsible for the observed change in the K b -to-K a intensity ratio, whereas in alloys2,3,10 the 3d electron transfer/delocalization is responsible for the observed change in the K b -to-K a ratio. The aim of the present study has been to measure the K b -to-K a x-ray intensity ratios for Ni and Cu in various silicide compounds and provide an explanation of these ratios based on reliable theoretical calculations. In a 1989 paper, Jankowski and Polasik17 proposed a special averagelevel ~SAL! version of multiconfiguration Dirac-Fock ~MCDF! calculation that gives values of the K b -to-K a intensity ratios for Ti, Cr, Fe, Ni, Cu, Zn, and Ge in a significantly better agreement with high-accurate experimental data of Perujo et al.18 than the theoretical predictions of Scofield19 and the results of standard average-level ~AL! and extended average-level ~EAL! versions of MCDF calculations ~see Grant et al.20!. Therefore, in order to provide a proper interpretation of the observed K b -to-K a x-ray intensity ratios for Ni and Cu in various silicide compounds, and to obtain information about the valence electronic structure of the metals in these compounds, the MCDF calculations in the SAL version have been carried out on Ni and Cu for various electronic configurations of the type 3d m2r2t 4s r 4p t (r,t52, 1, 0 and m stands for the total number of valence electrons in the atom!. The theoretical calculations presented in this paper have been done using the atomic MCDF package developed by Grant et al.20,21 II. EXPERIMENTAL DETAILS
The experiments were carried out using thick samples procured from the Goodfellow company, UK. The Ni and Cu 9025
© 1998 The American Physical Society
9026
S. RAJ, B. B. DHAL, H. C. PADHI, AND M. POLASIK
PRB 58
tensity ratios were determined from the fitted peak areas after applying necessary corrections to the data. IV. CORRECTIONS
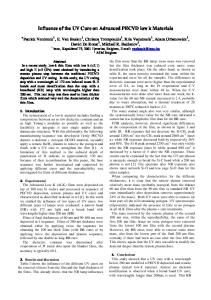
FIG. 1. A typical K x-ray spectrum of Ni in NiSi2.
silicide compounds for which measurements have been made are NiSi2 , Ni2Si3 , NiSi, Ni2Si, CuSi2 , CuSi, Cu2Si. Gamma rays of 59.54 keV from a 200 mCi 241Am point source were used to ionize the target atoms and the emitted x rays were detected by a 30 mm233 mm-thick Canberra Si~Li! detector having a 12.7 mm-thick beryllium window. The resolution of the Si~Li! detector was ;165 eV ~full width at half maximum! for a 5.9 keV x-ray peak. Details of the experimental arrangements can be found in our earlier paper.2 Pulses from the Si~Li! detector preamplifier were fed to an ORTEC-572 spectroscopy amplifier and then recorded in a Canberra PC based Model S-100 multichannel analyzer. The gain of the system was maintained at ;30 eV/channel. The counting was continued until the counts under the less intense K b peak were around 53104 . A typical K x-ray spectrum of Ni in NiSi2 is shown in Fig. 1.
III. DATA ANALYSIS
All the x-ray spectra were carefully analyzed with a multi-Gaussian least-squares fitting program23 using a nonlinear background subtraction. No low-energy tail was included in the fitting as its contribution to the ratio was shown to be quite small.24 A residue spectrum corresponding to the x-ray spectrum of Fig. 1 is shown in Fig. 2. This figure suggests that the fit is quite satisfactory. The K b -to-K a in-
Corrections to the measured ratios mainly come from the difference in the K a and K b self-attenuations in the sample, difference in the efficiency of the Si~Li! detector, and air absorption on the path between the sample and the Si~Li! detector window. The efficiency of the detector is estimated theoretically, as mentioned in our previous paper.3 Our theoretically estimated efficiency was shown to be in good agreement with the measured efficiency.25 It has been found that the discrepancy between the measured and theoretical efficiency at the energy region of present interest was <1.0%. The correction due to the Si~Li! detector relative efficiency to the measured K b -to-K a ratio is found to be <1%. The major correction to the measured K b -to-K a ratio stems from the self-absorption in the target. Since our results for pure metals agree very well with the earlier thin target results of Slivinsky and Ebert24 and Paic and Pecar,26 we are confident that our correction for the self-absorption is quite satisfactory. This correction was estimated using the method as described in our earlier paper.3 The correction for the air path was also estimated in a manner similar to the one described before.3 For the estimation of these corrections the mass attenuation coefficients were taken from the computer program XCOM by Berger and Hubbell.22 The absorption corrections for the various compounds are estimated using the values of Ni, Cu, and Si in the following Bragg’s-rule formula: ~ m/r !5
(i w i m i / r i ,
~1!
where, w i is the proportion by weight of the ith constituent and m i / r i is the mass attenuation coefficient for the ith constituent in the compound. The statistical error contributing to the measured K b -toK a ratio is calculated by the least-squares fitting program.23 The total uncertainty in the relative K b -to-K a ratios with respect to the pure metal is expected to be quite small (<1%). V. THEORETICAL CALCULATIONS
The MCDF method applied in the present study has been mainly developed by Grant et al. and is described in detail in several papers.20,21,27–31 Moreover, all the basic ideas of the alternative SAL version of the MCDF calculations, which are used in this work, have been presented by Jankowski and Polasik.17 However, for the sake of clarity, some essential details are very briefly recapitulated below. The Hamiltonian for the N-electron atom is taken in the form N
H5
( h D~ i ! 1 j.i51 ( Cij ,
i51
FIG. 2. Residues corresponding to the K x-ray spectrum of Fig. 1.
N
~2!
where h D (i) is the Dirac operator for ith electron and the terms C i j account for electron-electron interactions and come from one-photon exchange process. The latter are a sum of the Coulomb interaction operator and the transverse Breit
INFLUENCE OF SOLID-STATE EFFECTS ON THE K b - . . .
PRB 58
9027
TABLE I. Relative K b -to-K a intensity ratios of Cu and Ni in different silicide compounds. The errors quoted are statistical only.
Element
Constitution
K b -to-K a Intensity ratios
Relative K b -to-K a Intensity ratios Normalized to pure element results
Ni Ni2Si NiSi Ni2Si3 NiSi2 Cu Cu2Si CuSi CuSi2
0.136360.0006 0.131560.0007 0.130060.0007 0.132460.0007 0.139860.0007 0.136060.0006 0.137160.0007 0.137860.0007 0.140260.0007
1.0 0.96560.007 0.95460.007 0.97160.007 1.02860.007 1.0 1.00860.007 1.01360.007 1.03160.007
28
Ni
29
Cu
operator. The atomic state functions with the total angular momentum J and parity p are represented in the multiconfigurational form C s~ J p ! 5
(m c m~ s ! F ~ g m J p ! ,
~3!
where F( g m J ) are configuration state functions ~CSF’s!, c m (s) are the configuration mixing coefficients for state s, g m represents all information required to uniquely define a certain CSF. In the SAL version of the MCDF calculations, the energy functional is specially averaged over all the initial and final states and can be expressed by p
E5E opt 1
(a ¯q a e a S ~ a,a ! 1 ( a,b
e a,b S ~ a,b ! ,
~4!
aÞb
where ¯q a is the generalized occupation number for the orbital a, e a and e ab are the Lagrange multipliers, S(a,b) is the overlap integral, and E opt is taken in the form E o pt 5
F
1 1 3 ni
ni
1
nj
1
nk
( H ii 1 n j j51 ( H j j 1 n k k51 ( H kk i51
G
,
~5!
where H ii , H j j , and H kk are the diagonal contributions to the Hamiltonian matrix, n i is the number of all the CSF’s defining the initial states ~of the type 1s 21 ), and n j and n k are the numbers of all the CSF’s defining the final states of the types 2p 21 and 3p 21 , respectively. In this version of the calculation, the common set of the orbitals for all the initial and final states is to be determined. This removes the problem of nonorthogonality of the orbitals and, moreover, greatly reduces the computational effort, as only the coefficients c m (s) have to be determined for each state by diagonalizing the matrix of the Hamiltonian in the space of relevant CSF’s. Apart from the transverse ~Breit! interaction, two types of quantum electrodynamics ~QED! corrections are included, namely the self-energy and vacuum polarization corrections ~see McKenzie, Grant, and Norrington21!. The formulas for the transition matrix elements and spontaneous emission probabilities can be found in the work of Grant.27 The calculations have been performed for both the Coulomb and
Babushkin32,33 gauges. In the nonrelativistic limit the Coulomb gauge formula for the electric dipole transitions yields the dipole velocity expression while the Babushkin formula gives the dipole length expression.27 VI. RESULTS AND DISCUSSION
The experimental results for the K b -to-K a x-ray intensity ratios of Ni and Cu for the case of pure metals and in various silicide compounds are presented in Table I. The results for both Ni and Cu in the disilicides show a similar kind of enhancement over the pure metal values. However, for the other compounds the results for Ni show an opposite behavior as compared to Cu, i.e., the results for Ni are lower than the pure metal value, whereas for Cu they are somewhat higher than the pure metal value. As has been mentioned in the Introduction, the SAL version of the MCDF method gives values of the K b -to-K a intensity ratios for 3d transition-metal atoms in a significantly better agreement ~see Jankowski and Polasik17! with high-accurate experimental data of Perujo et al.18 than the theoretical predictions of Scofield19 and the results of standard AL and EAL versions of the MCDF calculations. Therefore, detailed MCDF calculations in the SAL version with the inclusion of the transverse ~Breit! interaction and QED ~self-energy and vacuum polarization! corrections have been carried out for Ni and Cu atoms to explain reliably the dependence of K b -to-K a x-ray intensity ratios on changes in configurations of the valence electrons that provide interpretation of the observed K b -to-K a x-ray intensity ratios for Ni and Cu in various silicide compounds. We have not considered any d-p hybridization effect between 3d electrons of the metal and 3 p electrons of silicon in the calculation, although there is a signature of this effect as had been shown earlier by photoelectron energy distribution spectral studies.15 The results of the MCDF calculations are presented in Table II. In each case the Coulomb and Babushkin gauge formulas for the electric dipole transitions have been used. It can be found from Table II that for both Ni and Cu atoms, the greatest values of the K b -to-K a intensity ratios are for a 3d m24 4s 2 4 p 2 configuration type, but the smallest values are for configurations 3d 10 in the case of Ni and 3d 104s 1 in the case of Cu.
9028
S. RAJ, B. B. DHAL, H. C. PADHI, AND M. POLASIK
PRB 58
TABLE II. The theoretical MCDF K b -to-K a intensity ratios of Ni and Cu corresponding to various types of the electronic configurations. In each case the Coulomb and Babushkin gauges have been used. The K b -to-K a intensity ratios Element
Z
Ni
28
Cu
29
Electronic configuration
Coulomb gauge
Babushkin gauge
3d 6 4s 2 4p 2 3d 7 4s 2 4p 1 3d 8 4s 2 3d 9 4s 1 3d 10 7 3d 4s 2 4p 2 3d 8 4s 2 4p 1 3d 9 4s 2 3d 104s 1
0.1439 0.1397 0.1361 0.1333 0.1313 0.1438 0.1399 0.1366 0.1340
0.1452 0.1410 0.1374 0.1346 0.1325 0.1450 0.1410 0.1377 0.1350
The experimental results for the K b -to-K a ratios of Ni in different silicide compounds have been compared with the MCDF results in Fig. 3. The calculation based on the Babushkin gauge give higher 3d electron population than those obtained by comparing the experimental data with the calculation of Coulomb gauge. As is seen from Fig. 3, the 3d electron population increases with the decrease of Ni concentration, a trend similar to the theoretical results reported earlier.16 But quantitatively our results for the Ni 3d electron population are different from the results reported in that work. Our 3d electron populations for Ni2Si3 , NiSi, and Ni2Si are higher than the atomic value, whereas for NiSi2 it is less than the atomic value ~electronic configuration 3d 8 4s 2 ). The d-p hybridization effect that increases the K b -to-K a ratio should not be the cause for the observed decrease in the K b -to-K a ratio in Ni2Si3 , NiSi, and Ni2Si. The Cu results are compared with the MCDF predictions in Fig. 4. The predicted electronic configurations for the three compounds show a lower 3d electron population than that of solid Cu. The K b -to-K a ratios of Cu for CuSi2 is
FIG. 4. Comparison of the experimental K b -to-K a intensity ratio of Cu in different Cu silicides with the predictions of MCDF calculations; the solid line corresponds to theoretical results based on the Coulomb gauge and the dashed line corresponds to Babushkin gauge. The shaded regions correspond to the ranges of electronic configurations for which the experimental values overlap with the results of the theoretical calculations.
enhanced as in the case of NiSi2. But the results for the other compounds of Cu show an opposite behavior to the Ni results, copper showing a somewhat enhanced K b -to-K a ratio, whereas the nickel results show a decrease in the ratio, meaning thereby that for these compounds the nature of 3d electron delocalization is opposite for the two metals. VII. CONCLUSIONS
On the basis of experimental results of the K b -to-K a x-ray intensity ratios of Ni and Cu in various silicide compounds as well as detailed separate MCDF calculations on Ni and Cu for various electronic configurations, some general conclusions can be drawn. In disilicide compounds, both Ni and Cu indicate similar enhancement of the K b -to-K a intensity ratio over the pure metal values. For the other compounds the results for Ni
FIG. 3. Comparison of the experimental K b -to-K a intensity ratio of Ni in different Ni silicides with the predictions of MCDF calculations; the solid line corresponds to theoretical results based on the Coulomb gauge and the dashed line corresponds to Babushkin gauge. The shaded regions correspond to the ranges of electronic configurations for which the experimental values overlap with the results of the theoretical calculations.
PRB 58
INFLUENCE OF SOLID-STATE EFFECTS ON THE K b - . . .
show an opposite behavior than for Cu. Our present results do not agree quantitatively with the previous theoretical calculations on the valence electron configurations of Ni silicides,16 although the trend seems to be similar. The authors believe that the results of this study will be helpful in better understanding the dependence of K b -to-K a x-ray intensity ratios on changes in configurations of the valence electrons and throw some new light on the valence electronic structure of Ni and Cu in their silicide compounds. Moreover, the results of this work can stimulate both the
1
K. N. Tu and J. W. Mayer, in Thin Films Interdiffusion and Reactions, edited by J. M. Poate, K. N. Tu, and J. W. Mayer ~Wiley, New York, 1978!, Chap. 10; J. Ottaviani, J. Vac. Sci. Technol. 16, 1112 ~1979!. 2 C. R. Bhuinya and H. C. Padhi, J. Phys. B 25, 5283 ~1992!. 3 C. R. Bhuinya and H. C. Padhi, Phys. Rev. A 47, 4885 ~1993!. 4 E. Arndt, G. Brunner, and E. Hartmann, J. Phys. B 15, L887 ~1982!. 5 E. Lazzarini, A. L. Lazzarini Fartola, and M. Mandelli Battoni, Radiochim. Acta 25, 21 ~1978!. 6 B. Paccimazzili and D. S. Urch, Innershell and X-ray Physics of Atoms and Solids ~New York, Plenum, 1981!, p. 741. 7 Y. Tamakai, T. Omori, and T. Shiokawa, Radiochem. Radioanal. Lett. 20, 255 ~1975!; 37, 39 ~1979!. 8 C. N. Chang, S. K. Chiou, and C. L. Luo, Solid State Commun. 87, 987 ~1993!. 9 A. Kuckukonder, Y. Sahin, E. Buyyukkasap, and A. Kopya, J. Phys. B 26, 101 ~1993!. 10 H. C. Padhi, C. R. Bhuinya, and B. B. Dhal, J. Phys. B 26, 4465 ~1993!. 11 C. N. Chang, C. Chen, C. C. Yen, Y. H. Wu, C. W. Wu, and S. K. Choi, J. Phys. B 27, 5251 ~1994!. 12 T. Mukoyama, K. Taniguchi, and H. Adachi, Phys. Rev. B 34, 3710 ~1986!. 13 Chu-Nan Chang, S. K. Chiou, and C. R. Luo, Solid State Commun. 87, 987 ~1993!. 14 H. C. Padhi and B. B. Dhal, Solid State Commun. 96, 171 ~1995!.
9029
experimental and theoretical research with other silicide compounds that have lots of technological applications.
ACKNOWLEDGMENTS
This work was supported in part by the Council of Scientific and Industrial Research, India and partly by the Polish Committee for Scientific Research ~KBN!, Grant No. 2 P03B 055 09.
15
A. Franciosi, J. H. Weaver, and F. A. Schmidt, Phys. Rev. B 26, 546 ~1982!. 16 O. Bisi and C. Calandra, J. Phys. C 14, 5479 ~1982!. 17 K. Jankowski and M. Polasik, J. Phys. B 22, 2369 ~1989!. 18 A. Perujo, J. A. Maxwell, W. J. Teesdale, and J. L. Campbell, J. Phys. B 20, 4973 ~1987!. 19 J. H. Scofield, Phys. Rev. A 9, 1041 ~1974!. 20 I. P. Grant, B. J. McKenzie, P. H. Norrington, D. F. Mayers, and N. C. Pyper, Comput. Phys. Commun. 21, 207 ~1980!. 21 B. J. McKenzie, I. P. Grant, and P. H. Norrington, Comput. Phys. Commun. 21, 233 ~1980!. 22 XCOM program by M. J. Berger and J. H. Hubbell, Centre for Radiation Research, National Bureau of Standards, Gaithersburg, MD 20899 ~unpublished!. 23 Computer code NSCSORT ~unpublished!. 24 V. W. Slivniski and P. J. Ebert, Phys. Rev. A 5, 1681 ~1971!. 25 B. B. Dhal, T. Nandi, and H. C. Padhi, Nucl. Instrum. Methods Phys. Res. B 101, 327 ~1995!. 26 G. Paic and V. Pecar, Phys. Rev. A 14, 2190 ~1976!. 27 I. P. Grant, J. Phys. B 7, 1458 ~1974!. 28 I. P. Grant and B. J. McKenzie, J. Phys. B 13, 2671 ~1980!. 29 J. Hata and I. P. Grant, J. Phys. B 16, 3713 ~1983!. 30 I. P. Grant, Int. J. Quantum Chem. 25, 23 ~1984!. 31 K. G. Dyall, I. P. Grant, C. T. Johnson, F. A. Parpia, and E. P. Plummer, Comput. Phys. Commun. 55, 425 ~1989!. 32 F. A. Babushkin, Opt. Spectra 13, 77 ~1962!. 33 F. A. Babushkin, Acta Phys. Pol. 25, 749 ~1964!.