Madras Agric. J., 93 (7-12) : 256-259 July-December 2006 Research Notes
Genetic divergence and yied improvement in chickpea (Cicer arietinum L.) J.ASLIN JOSHI, S. GANESHRAM AND J.R.KANNAN BAPU Centre for Plant Breeding and Genetics, Tamil Nadu Agricultural University, Coimbatore-641 003.
Chickpea is an economically important crop in India, Middle East, North Africa and Ethiopia. It is the third most important pulse crop in the world next to Phaseolus vulgaris and Pisum sativum. In India, over 70 per cent of the world’s chickpea crop is produced. In India it is cultivated in Madhya Pradesh, Rajasthan, Uttar Pradesh, Maharastra and Haryana. Many chickpea breeding programmes are focused on to increase yield and in any crop improvement programme, genetic diversity has been considered as an important factor for hybridization programme. Inclusion of diverse parents in hybridization helps in isolation of superior recombinants. Multivariate analyses have been used to measure the diversity of germplasm collections and to assess the relative contributions that various traits make to total variability in a crop collection (Sneath and Sokal, 1973). Several methods of multivariate analysis such as D 2 analysis, cluster analysis, principal component analysis and metroglyph analysis have been shown to be useful in selecting genetically distant parents for hybridization. Among these methods, cluster analysis appears to be a better approach in quantitative estimation of genetic diversity. The present study aims at quantifying genetic divergence in a diverse collection of chickpea. The study material consisted of 214 chickpea accessions and the seeds were obtained from the Department of Pulses, Tamil Nadu
Agricultural University, Coimbatore. Two hundred and fourteen chickpea accessions were raised in augmented block design during Nov - Dec of 2004- 2005. The experimental plot was divided into ten blocks. In each block, 21 accessions were raised in a row of 3m length with a spacing of 45 cm between rows and 10 cm between plants along with four checks. The four checks viz., CO4, C235, ICCV 2 and Phule G5 were repeated in all the blocks. The observations were recorded on quantitative traits namely, days to 50 per cent flowering, days to maturity, plant height (cm), number of primary branches, number of secondary branches, number of pods per plant, number of seeds per plant, pod yield, biological yield, hundred seed weight, seed yield per plant and harvest index. Analysis of variance was used to separate the total variation into different components and to test their significance. Hierarchial cluster analysis was done for all the 214 accessions using twelve traits using the software NTSYS pc. Character data were transformed to similarity data. Dendrogram was constructed using an unweighed pair group method with arithmetic mean analysis (UPGMA) using the TREEPLOT programme of NTSYS pc (Rohlf, 1992). The analysis of variance revealed significant differences among the genotypes for the
Number of accessions
2 8 9 1 1 167
13
3 1 2 4 2 1
Cluster
I II III IV V VI
VII
VIII IX X XI XII XIII
Accession Number
ICCV-2, PLS 5098 CO-4, ICC 7344, ICC 14228, ICC-4958, PLS 5728-2. ICC 1424, Kodaikanat local, ICC 14249 ICC 16089, ICC 15160, ICC 12483, ICC 16947, ICC 7445, ICC-5319, ICC 4758, ICC 2397, ICC 38 ICC 88503 PLS 5521-2 ICC 12476, ICC 3276, L550, ICC 8397, IPC-96-57, ICC 12242, ICC 12478, ICC 12479, ICC14876, ICCV-10, ICC 506, RC16-2, ICC 15629,ICC 11180, GL 96037, ICC 92944, ICC 5695, Paladam local, BG-1075, BG-391, IPC-96-47 BGM-524, BGD 109, ICC 5353,BGM-523, COG-29-1, GCP-9610, ICC 4958, ICHRN-1, RC-7-2, ICC 4951, ICC 16603, PLS-5460, PLS 50372, PLS 5320-2, ICC42, PLS 5134-2, ICC 15713, PLS 89234, PLS 5399-2, ICC 11027, IPC-97-2, PLS 5304-3,800550, RC5-2, PLS 2430-2, ICC 89109, RSG-14333, 8830, 89109-2, PLS 5560-2, 8818, ICC 8330, ICC 12475JCC 11000, ICC 10331, ICC 12484, ICC 12477, ICC 8969, PLS 5219-2, 86239, PLS 5139-2, ICC 14259, Perambalur local, PLS 5305, PLS 54512, ICC 11051, ICC 14242, ICC 12216, ICC 12424, ICC 1158, ICC 7498, ICC 10994, ICC 15154, ICC 14244, ICC 7260JCC5783, BDN-9-3, ICC 11061, ICC 11150, PLS 5425-2, PLS 86446, ICC 9906, ICC-946, ICCI98737, BG-1101, ICC 1180, ICC 2473, ICC 8962, ICC 6104, ICC-283, Phule G5, CO-2, ICC 16048, ICC-4951-1, ICC 640, ICC 6427, ICC 7470, RC -1022, ICC 11324, ICC 15652, FG-712, BG-109, GCP 9504, ICC 16915, 87214, ICC 4278, ICC117653, ICC 14332, ICC 11313, RC-3-2, RC-14-2, PLS 5225-1, PLS 5307-2, ICC 8855, ICC 14606, ICC 10973, ICC 16340, ICC 14286, 89228, ICC 2812. PLS 5433-2, ICC 5677, PLS 5134-1, ICC 16102, ICC 16856, RSG-16641, PLS 53904-2, ICC 15598,CO-1, PDG-90-23, ICC 8155, ICC 16911, ICC 4533, ICC 4852, ICC 11039, PLS 5173, RC 110-2, 89339, ICC 10232, 89337, 89213, 89339-1. ICC 12884, 89305, 86416, 87227, ICC 16905, ICC 5592, IPC-94-94, ICC-5783, ICC 6479, ICC 6919, RC-12-2, ICC 15662, ICC 16374, ICC 5778, ICC 7196, JG-11, BG-1043, BG-362, 87209, C235, ICC 12237, RSG-143-1, ICC 12486, ICC 124781 PLS 5241-2.TNAU-8902, COG-85-2, ICC 14342, PLS 11502.ICC 6121.PLS 5588-KGCP-107, ICC 142S4.PLS 2430.PI.S 5487, ICHRN-2, CO-3 PLS 5225-2,ICC 6777,ICC 10971 ICC 16349 ICCV 96029JCCV96030 ICC 15592, ICC2016, FG-703, ICC15085 RSG966, ICC 10301 ICC 2737
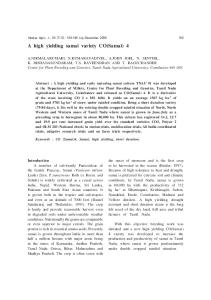
Table 1. Distribution of 214 chickpea accessions in different clusters
Genetic divergence and yied improvement in chickpea (Cicer arietinum L.) 257
J.aslin Joshi, S. Ganeshram and J.R. Kannan Bapu
17.87 16.48 11.69 20.18 25.42 7.20 28.12 8.07 3.98 6.26 8.40 9.55 2.20 73.54 54.09 47.46 93.42 65.18 49.46 48.23 87.77 73.67 61.68 39.49 61.36 13.41 29.09 28.86 16.33 13.27 29.91 17.65 19.06 15.67 14.02 14.63 17.31 31.60 6.47 59.70 63.33 80.20 108.40 86.60 43.02 28.77 51.60 30.60 61.90 53.00 33.50 7.20 67.83 51.48 81.42 84.60 73.00 41.77 27.58 50.20 29.60 37.80 54.10 34.90 19.00 18.78 17.41 18.51 18.60 26.40 8.79 19.05 10.47 4.40 6.20 11.70 11.00 1.80 24.36 30.76 25.18 21.60 39.00 15.54 13.76 9.48 5.40 10.18 22.15 15.50 16.40 12.41 23.69 23.20 23.80 23.20 17.62 16.12 22.07 9.60 11.30 17.10 28.60 27.60 3.00 2.55 3.29 3.40 4.40 2.54 8.86 2.87 2.20 2.30 3.85 3.50 3.00 35.30 37.94 36.98 36.00 40.20 31.76 18.45 37.53 34.00 36.90 37.35 46.10 34.00 76.25 82.59 84.44 78.00 85.00 84.26 56.18 82.67 81.00 71.00 88.50 85.00 95.00 38.88 47.19 48.22 40.00 49.00 46.95 60.65 40.00 62.00 40.00 62.00 48.50 51.00 I II III IV V VI VII VIII IX X XI XII XIII
Biological Yield (g)/ plant Number of seeds/ plant Number of pods/ plant Number of secondary branches/ plant Number of primary branches/ plant Plant height (cm) Days to Days to 50% maturity flowering Clusters
Table 2. Cluster mean performance for 12 characters of 214 chickpea accessions
Pod Yield (g)/ plant
Harvest index (%)
100 seed Seed weight yield/ (g) plant(g)
258
characters under study and grouped into 13 distinct clusters. The composition of clusters is presented in Table 1. The cluster VI was the largest with 167 accessions while cluster VII, III, II, XI and VIII consisted of 13, nine, eight, four and three accessions respectively. Cluster I, X, XII and cluster IV, V, IX and XIII had two and one accessions each respectively. The accessions were not grouped based on their origin or source indicating that geographic diversity has no parallelism with genetic diversity (Table 1). For instance, cluster VI consisted of accessions from different origin namely Delhi, Karnataka, Kanpur and Jabalpur. Likewise cluster VII comprised of accessions from Coimbatore, Andhra Pradesh and Junagadh. Cluster XI consisted of ICC 15592, ICC 2016 and ICC 15085 from Andhra Pradesh whereas FG 703 was from Faridkot. Cluster XII consisted of RSG 966 from Rajasthan and ICC 10301 from Andhra Pradesh. Katiyar et al. (2004) and Darshanlal et al. (2001) reported no relationship between geographic distribution and genetic divergence. The genotypes of same region were distributed in more than one cluster as also the genotypes of heterogenous origin were grouped in the same cluster. Such genetic diversity among the genotypes of common geographic origin could be due to factors like heterogeneity, genetic architecture of the populations, developmental traits and degree of general combining ability (Murthy and Arunachalam, 1966). The clustering of genotypes from different ecogeographical locations into one cluster could be attributed to possible free exchange of breeding material or even varieties from one place to another (Verma and Mehta, 1976). This also may
Genetic divergence and yied improvement in chickpea (Cicer arietinum L.)
be due to the fact that the unidirectional selection practiced for a particular trait in several places produced similar phenotypes which were aggregated in one cluster irrespective of their distant geographic origin. The cluster mean performance for 12 quantitative traits is furnished in Table 2. Cluster IV exhibited high mean performance for number of pods (84.60), number of seeds per plant (108.40) and harvest index (93.42). The high mean value for pod yield (26.40) and biological yield (39.00) was recorded in cluster V whereas cluster VII recorded high mean value for number of primary branches (8.86) and seed yield per plant (28.12). Cluster 1 had low mean value for days to 50 per cent flowering (39.00) and cluster X for days to maturity (71.00). The high mean value for plant height (46.1), number of secondary branches per plant (28.6) and hundred seed weight (31.60) was recorded by cluster XII. ICC 88503 (cluster IV) and PLS 55212 (cluster V) and ICCV 2, PLS 5098 (cluster I) and RSG 966, ICC 10301 (cluster XII) and other accessions in cluster VII can be crossed to get high heterosis and better segregants with desired traits. ICCV2 and PLS 5098 are short duration genotypes as they had recorded low mean values for days to 50 per cent flowering and days to maturity. Crosses involving cluster I will result in short duration, large seeded chickpea with moderate yield. ICC 88503 recorded high cluster mean for number of pods per plant and number
259
of seeds per plant. Seed yield per plant was relatively low due to low 100 seed weight implying that the seeds were small whereas the accessions in cluster VII recorded high cluster mean for seed yield because of its relatively high 100 seed weight. Crosses involving PLS 5521-2 of cluster V that recorded relatively high cluster mean values for all the desirable traits would result in an ideal genotype. References Darshanlal, Ramakrishna and Gurpreet Singh. (2001). Genetic divergence in chickpea. Indian J. Pulses Res., 14(1): 63-64. Katiyar, P.K., Dua, R.P., Singh, I.P., Singh, B.B. and Singh, F. (2004). Multivariate analysis for genetic diversity in early pigeonpea accessions. Legume Res., 27(3): 164-170. Murthy, B.R. and Arunachalam, V. (1966). The nature of divergence in relation to breeding system in some crop plants. Indian J. Genet. Plant Breed., 26(4): 188-198. Rohlf, F.J. (1992). Taxonomy and System version of New York,
NTSYS-pc: Numerical Multivariate Analysis 1.70. State university Brook, New York.
Sneath,P.H.A. and Sokal, R.R. (1973). Numerical Taxonomy: The Principles and Practice of Numerical Classification. W.F. Freeman and Co., San Fransico, pp.573. Verma, V. S. and Mehta, R. K. (1976). Genetic divergence in lucerne. J. Maha. Agrl. Univ. 1: 23-28.