Madras Agric. J., 93 (7-12) : 165-168 July-December 2006
165
Genetic variability and heritability in sugarcane D.R.DELVADIA1 AND A.D.PATEL2 1 Agrl. Officer, Department of Agronomy, B.A. College of Agriculture, AAU, Anand 388 110 2 Assoc. Res. Sci, Main Vegetable Res. Station, AAU, Anand 388 110
Abstract : Twelve genotypes of sugarcane were studied for their variability, heritability and genetic advance in two environments. Wide variability was registered for most of the traits. The phenotypic co-efficient of variation (PCV) and genotypic co-efficient of variation (GCV) were highest for cane yield per clump followed by single cane weight, germination per cent and tillering per cent (120 DAP) while high heritability was recorded for single cane weight followed by cane yield per clump, germination per cent, cane thickness and cane height. High genetic advance was observed for most of the growth parameters. The heritability and genetic advance as per cent of mean for different traits ranged from medium to high, indicating that these traits could be improved through straight selection. Germination and tillering percent showed high heritability with high genetic advance, indicating that the selection for these specific characters would be more effective for getting higher yield. Key words: Variability, Heritability, PCV, GCV, Genetic advance.
Introduction Sugarcane (Saccharum officinarum L.) is an important vegetatively propagated crop grown under varied agro climatic conditions. Sugarcane is a complex polyploidy C 4 type crop. In sugarcane clonal selection is one of the breeding approaches. Therefore, for proper selection of clones, variability parameters such as GCV, PCV, heritability and expected genetic advance are of immense value particularly for vegetatively propagated crops like sugarcane. Hence, the study was undertaken for 12 genotypes to work out above genetic parameters for different nine important cane yield and sucrose content components.
Materials and Methods Genetically diverse twelve genotypes of mid-late group were evaluated in RBD with three replications during 2000-’01 and 2001’02. The experiment was conducted at Agricultural Research Station, A.A.U, Thasra. Each genotype was represented in experimental unit of 6 rows of 8-meter length, at 90 cm row spacing. Ten clones were randomly selected from each experimental unit for recording various observations (Table 1). The various genetic parameters were estimated with statistical approach proposed/ reviewed by, for analysis of variance (Panse and Sukhame, 1978); genotypic (σ 2g) and
E1 E2
E1 E2
E1 E2
E1 E2
E1 E2
E1 E2
E1 E2
E1 E2
Tillering % at 120 DAP
Cane height (cm)
No.of internodes per cane
Cane thickness (cm)
Single cane weight (kg)
Extraction (%)
Sucrose (%) in juice
Cane yield per clump (kg)
E = Environment
E1 E2
Environment
Germination % at 45 DAP
Character
1.25 + 0.20 1.48 + 0.22
15.82 + 0.60 16.65 + 0.64
53.54 + 2.16 55.49 + 2.06
0.917 + 0.06 1.046 + 0.08
7.45 + 0.37 7.64 + 0.35
17.62 + 1.02 18.09 + 1.04
207.14 + 21.21 207.56 + 13.11
313.37 + 41.63 325.48 + 21.99
57.56 + 6.17 54.04 + 5.00
Mean
0.60 -1.88 0.68 - 2.80
15.03 - 16.60 14.77 - 17.33
47.97 - 59.77 50.33 - 60.17
1.12 - 0.49 0.76 - 1.29
6.00 - 8.47 7.07- 8.50
15.74 - 19.73 16.27 - 20.87
144.00 - 247.67 148.33 - 243.67
223.670 - 402.67 197.37 - 438.33
42.13 - 82.07 39.83 - 77.53
Range
34.17 43.56
5.01 5.82
7.57 5.90
27.52 20.30
13.97 9.14
9.21 9.59
19.44 13.78
22.39 22.81
23.94 27.02
PCV
27.89 39.51
1.97 3.46
5.57 3.77
26.27 7.85
12.57 7.24
5.84 6.54
14.85 11.40
15.38 21.26
20.02 24.53
GCV
66.6 82.3
15.4 35.4
58.1 40.8
91.1 77.4
81.0 62.7
40.2 46.5
58.4 68.5
47.2 86.8
69.9 82.4
h2 (BS) (%)
0.59 1.10
1.97 0.71
4.89 2.75
0.47 0.34
1.74 0.90
1.34 1.66
48.42 40.34
68.22 132.82
19.85 24.80
Expected GA as % of mean (5%)
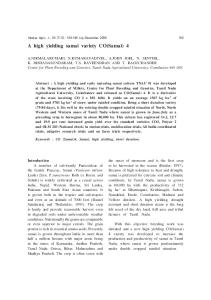
Table 1. Mean, range, phenotypic co-efficient of variation (PCV), genotypic co-efficient of variation (GCV), heritability (h2) and genetic advance (GA) as per cent of mean for different traits in two environments.
166 D.R.Delvadia and A.D.Patel
Genetic variability and heritability in sugarcane
phenotypic (σ 2p) variance (Johnson et al., 1955); broad sense heritability (Henson et al., 1956); phenotypic (PCV) and genotypic (GCV) co-efficient of variances (Burton, 1953) and expected genetic advance (Allard, 1960). Results and Discussion The extent of variability present in a crop species with respect to a number of economic attributes is one of the prime concerns for the breeder. It is well known that greater the extent of variability in the population better would be the scope for improvement programme. Keeping this idea, efforts were made to study different genetic parameters (Table 1) for different traits of sugarcane to get basic information which may be helpful in planning for a selection of suitable breeding programme. The value of phenotypic range showed considerable amount of variation for most of the traits. The PCV and GCV were recorded (Table 1) highest for cane yield per clump in E2 (43.56 and 39.51) and in E1 (34.17 and 27.89) followed by single cane weight in E1 (27.52 and 26.77) and in E2 (20.30 and 17.85), and germination at 45 DAP in E2 (27.02 and 24.53) and tillering percent at 120 days after planting in E2 (22.81 and 21.26) respectively. For quality traits like sucrose per cent in juice and extraction percent, it was observed low PCV and GCV and for growth parameters it was observed moderate PCV and GCV (cane height, no. of internodes per cane and cane thickness). Similar trend was also observed by Kadian et al. (1997) and Double and Balasundaram (1997). The estimates of heritability (broad sense) did show in general moderate to high for
167
most of traits. The low heritability was noted for sucrose per cent in juice in E1 (15.40). The maximum heritability was registered for single cane weight in both the environments E1 and E2 (91.1 and 77.4). This corroborates with the finding of Double and Balasundarum (1997). Kadian et al. (1997) had earlier reported high heritability for single cane weight, followed by cane yield per clump (66.6 and 82.3), germination per cent (69.9 and 82.4) and cane thickness (81.0 and 62.7) respectively. The highest genetic advance expected as percentage of mean was observed for growth parameters viz., tillering per cent, cane height and germination per cent. The remaining traits showed low genetic advance. One of the practical implications from this study is that the selection on growth parameters will be more effective for improvement in these traits and this may lead to higher cane yield, because high heritability was associated with high genetic advance. This confirms earlier findings of Chaudhary et al. (1982)), Hooda and singh (1989), Kang et al. (1990) and Bakshi Ram (1994). Low genetic advance with high heritability was recorded for single cane weight, cane thickness and cane yield per clump suggesting the improvement of these charcaters has little scope. This corroborated with the finding of Pandey (1989). The results indicated that yield in sugarcane could be improved by making direct selection on the basis of phenotypic expression of growth parameters as well as by indirect selection of single cane weight, cane thickness and cane productivity per clump.
168
References Allard, R.W. (1960). Principles of Plant Breeding. John Wiley and Sons, Inc., New York, pp: 89-98. Bakshi Ram, (1994). Variability, heritability, genetic advance and character inter relationship in sugarcane under coastal conditions of AndhraPradesh. Agric. Sci. Digest, 14(1): 44-48. Burton, G.W. and Devane, F.H. (1953). Estimating heritability in tall fescue (Fascutata arundinaceae) from replicated clonal material. Agron. J., 45: 478-481. Chaudhary, B.S., Punia, M.S. and Verma, S.S. (1982). Variability and heritability of some morphological characters in sugarcane. Indian sugar, 32(5): 1-4. Doule, R.B. and Balasundaram, N. (1997). Variability, heritability and genetic advance for yield and quality attributes in sugarcane. Indian sugar, 47(7): 499-502. Henson, C.H., Robinson, H.F. and Comstock, R.F. (1956). Biometrical studies of yield in segregating population. Agron. J., 46: 268-272.
D.R.Delvadia and A.D.Patel
Hooda, M.S. and Singh, S. (1989). Variability, heritability and genetic advance for yield and its components in sugarcane. Indian J. Agric Sci. 59(3): 171-172. Johnson, H.W., Robinson, H.F. and Comstock, R.F. (1955a). Estimation of genetic and environmental variability in soybean. Agron J. 51 : 515-518. Kadian, S.P., Chander Kishor and Sahharwal, P.S. (1997). Genetic variability and heritability in sugarcane. Indian sugar. 46(12) : 973975. Kang, M.S., Sosa, O and Miller, J.D. (1990). Path analysis for per cent fibre, cane and sugar yield in sugarcane. Crop Sci. 29(6): 14811483. Pandey, R.A. (1989). Variability study in the hybrid progenies for sugarcane (Saccharum complex). Bharatiya sugar. October: 4951. Panse, V.G. and Sukhatme, P.V. (1978). Statistical methods for Agricultural workers. ICAR. New Delhi.