Madras Agric. J., 93 (7-12) : 248-252 July-December 2006
Genetic diversity studies in coconut (Cocos nucifera. L) A. THANGA HEMAVATHY AND K.BALAJI Tamil Nadu Agricultural University, Coimbatore - 641 003.
Abstract : Studies on genetic diversity of 28 coconut genotypes from Coconut Research Station, Veppankulam was evaluated based on 17 traits. Characters studied included both vegetative, inflorescence and fruit/nut characters. Genotypes were grouped into 8 clusters. Tall cultivars were grouped in 4 clusters. Dwarf cultivars resolved into four clusters. The intra cluster distance was the highest in the seventh cluster. Andaman Ordinary Dwarf and Chowghat Giant Dwarf show distinguishing nut characters constituted a separate cluster. This analysis indicated the possibility of obtaining promising progeny from the parents of divergent clusters. The study also confirmed the distinctiveness of the dwarf and tall varieties. Nut characters were found to be more efficient in assessing genetic divergence. Intercrossing among the genotypes belonging to cluster II and VII was suggested to develop high yielding varieties with other desirable characters. Key words: Coconut varieties, Divergence, Genetic distance, Tall and dwarf varieties
Introduction Coconut is a robust palm with tall slender stem and massive crown with large number of leaves bearing bunches of nuts in their axis. Variability exists among cultivars of coconut for many characters. Genetic improvement is normally achieved by selecting the genotypes with desirable characters or combinations of good plant characters existing in the available tall and dwarf varieties. The study of material variation in cultivated crops is an essential prerequisite to the identification of varieties superior in respect to their economic attributes. Characterization and classification of coconut varieties were attempted by Narayanan and John (1949) and Liyanage (1958) based on plant habit and geographical characters. The biometric clustering in coconut was carried out using different statistical methods by different researchers (Kumaran et al., 2000). An assessment of nature and magnitude of diversity between genotypes will help to choose better parents for hybridization. Mahalanobis (1936) D2 statistics of
multivariate analysis is recognized as a powerful tool in quantifying the degree of genetic divergence among the population. This concept was employed in the present investigation to estimate the genetic distance among the 28 varieties of coconut and to identify the suitable donors for a successful breeding programme in the crop. Materials and Methods Twenty eight genotypes of coconut (Cocos nucifera L) are maintained at Coconut Research Station, Veppankulam, TamilNadu, India, formed the materials for this study. The palms were planted in 1985 and the experiment was conducted in a Randomized Block Design with two replications. Observations were recorded from four plants representing each genotypes in each replication. The mean data of the four palms were subjected to statistical analysis. For studying the nut characters, two nuts of 12 months maturity were collected from each of the four palms at harvest.
Genetic diversity studies in coconut (Cocos nucifera. L)
249
Table 1. Distribution of the clusters Cluster No
No. of varieties in cluster
I
10
II III IV V VI VII VIII
2 2 2 2 2 4 4
Description of varieties
Andaman Ordinary, Andaman Giant, Cochin China, ECT, Fiji Tall, FMS, GOA, JMT, TGT , NGT PHO.SSG LCD, Spicata AOD, CGD Tailand, WCT GBD.MGD Kappadam, LCM, COD, Ayiramkachi Sanblas, Siam, MOD, MYD
Table 2. Inter and Intra cluster D2 and D (parenthesis) values in coconut. Cluster I
II
1
II
III
IV
V
VI
VII
VIII
1706.30 (41.30)
996.84 (31.57)
1135.04 (33.69)
3494.96 (59.11)
2919.01 (54.02)
2919.23 (47.08)
16374.74 (127.96)
3224.37 (56.78)
160.70 (12.67)
561.36 (23.69)
3212.30 (56.67)
3475.69 (56.95)
1922.85 (43.85)
15874.23 (125.99)
2635.58 (51.33)
192.92 (13.88)
1751.64 (41.85)
2918.28 (54.02)
848.83 (29.13)
18674.49 (136.6)
2146.28 (46.32)
227.79 (15.09)
45678.19 (67.58)
578.87 (24.05)
13576.55 (116.57)
2687.11 (57.83)
548.92 (23.42)
3050.97 (55.23)
8263.57 (90.90)
4960.37 (70.42)
588.90 (24.96)
13021.86 (114.11)
2273.49 (47.68)
6733.76 (82.05)
17108.03 (130.79)
III
IV
V
VI
VII
VIII
Varieties used Tall varieties 1. Andaman Ordinary 2. Andaman Giant 3. Cochin China 4. ECT
4812.47 (69.37)
11. 12. 13. 14.
LCO LCM NGT PHO
5. 6. 7. 8. 9. 10.
FijiTall FMS GOA JMT JGT Kappadam
15. 16. 17. 18. 19. 20.
Sanblas Siam Spicata SSG Tailand WCT
A. Thanga Hemavathy and K.Balaji
173.58 10.40 163.74 10.22 106.74 9.00 100.35 3.84 130.83 11.99 98.60 6.36 130.29 9.02 139.99 7.02 3.80 1.24 1.40 1.25 1.31 1.12 1.10 1.81 583.45 604.12 366.25 625.62 612.50 371.25 491.18 713.75 946.42 976.50 657.50 981.87 1075.37 766.00 612.31 1119.31 15.11 14.50 14.87 14.80 15.67 12.87 12.50 15.29 21.93 20.31 21.93 21.97 20.87 18.96 20.12 22.09 9.42 8.50 8.87 8.87 12.62 8.62 14.06 8.06 17.50 13.78 16.85 23.31 30.78 22.59 53.31 18.90 I II III IV V VI VII VIII
88.65 100.37 78.00 76.87 79.62 91.25 76.37 84.18
43.94 44.50 38.87 41.87 41.87 43.43 34.50 44.50
11.76 11.35 11.77 8.36 9.94 11.04 9.73 9.29
83.50 72.75 93.12 75.12 89.25 79.50 77.40 79.81
38.57 31.50 47.75 33.75 38.93 39.00 39.12 38.50
38.27 39.62 32.37 32.50 46.75 42.75 35.00 37.43
4.90 4.75 4.37 4.50 4.62 4.50 4.68 4.50
29.28 30.55 34.03 23.76 29.25 30.37 27.80 30.20
11 10 9 8 7 6 5 4 3 2 1 Cluster
Table 3. Cluster means of seventeen characters in 28 varieties of coconut in 8 clusters.
12
13
14
15
16
17
250
Dwarf varieties 1. AOD 2. CGD 3. COD 4. GBD
5. 6. 7. 8.
MGD MOD MYD Ayiramkachi
Characters studied 1. 2. 3. 4. 5. 6. 7. 8. 9. 10. 11. 12. 13. 14. 15. 16. 17.
Girth of stem at 1 m level (cm) Length of internodes (cm) Palm height (cm) Length of inflorescence (cm) Length of spikelet portion (cm) No. of spikelets Bunches with button Bunches without button Bunches without nuts No. of female flowers Nut length (cm) Nut breadth (cm) Whole nut weight (g) Dehusked nut weight (g) Kernel thickness (cm) Copra content (%) Copra yield (g)
All the 17 parameters were recorded and the data was statistically analysed. The mean data were analysed for genetic divergence using Mahalanobis D2 statistics and the population were grouped into clusters according to Tocher’s method as described by Rao (1972). Results and Discussion The Multivariate analysis giving the D2 values between 28 genotypes revealed that these genotypes can be grouped into 8 clusters (Table 1). Among these clusters, cluster I consisted 10 varieties followed by VII and VIII had 4 varieties respectively. Table I.shows the list of varieties in each cluster. Dwarf cultivars are represented in IV, VI, II and VIII clusters. The clustering pattern obtained in the present study revealed that the cultivars collected from one location were scattered in different clusters, thus supporting the view that geographic distribution and genetic divergence do not follow the same trend. Murthy and Arunachalam (1966) reported the genetic drift and selection in different environments could cause greater diversity. Cluster I
Genetic diversity studies in coconut (Cocos nucifera. L)
251
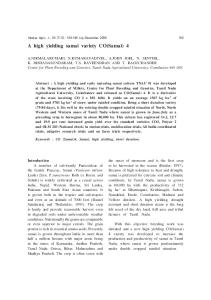
showed all the cultivars that come under it are the Tall types and cluster four and six have the dwarf varieties. These groups shows that varietal variation depends not only on the nut characters (Fig.1) but also depends on the vegetative characters. Nut characters have found to be more dependable and had been used by Ovarasu (1998) and Zizumbovillareal and Punerio (1998). Rao and Pillai (1983) are also of the same opinion and indicated that the island populations Andaman Ordinary and Andaman Giant represent introgressed forms. Eventhough West Coast Tall and East Coast Tall are tall varieties but grouped in two clusters. The differences between these varieties may be due to the spatial isolation of their environments.
The intercluster D2 values ranged from 23.69 to 136.6. Minimum intercluster D2 values was observed between cluster II and III (23.69) indicating the close relationship among the cultivars included in these clusters. Maximum intercluster value was observed between cluster III and VII (136.6) which indicated that the genotypes included in these clusters had maximum divergence. Hence intermating between the cultivars included in these different clusters may give high heterotic response and better segregants.
Average intra and inter cluster D 2 values among 28 cultivars presented in Table 2 indicated that cluster II showed minimum intra cluster value (12.67) indicating that the cultivars within the cluster were similar. While cluster VII showed maximum intracluster value (82.05) followed by cluster VIII (69.37) revealing thereby the existence of diverse genotypes in this cluster.
The average cluster means for 17 characters are attributed in (Table 3). The genotypes included in the cluster III were having high palm height, length of inflorescence and spikelet portion. N’cho et al. (1993) grouped the coconut genotypes based on vegetative characters. Sugimura et al. (1997) also reported that usefulness of leaf and spathe characters in the genetic analysis of coconut cultivars. Kumaran et al. (2000) reported that the variations in leaf and inflorescence characters contributed to variation in coconut genotypes. Among the inflorescence characters, no. of female flowers had the highest value for
Fig.1 Nut characters of different varieties
252
cluster III (34.03) followed by cluster II (30.55). Cluster V also had more no. of bunches (Ayiramkachi Fig.1) without nuts and cluster V also had more nut breadth and highest no. of spikelets. Members of this cluster are distinct with respect to floral characters. Balakrishnan and Namboodiri (1987) found inflorescence characters as major factors contributing to divergence. Cluster VII had highest nut length, whole nut weight and dehusked nut weight. Variability considered in this study was not split into two separate groups, “Dwarfs and Talls”. This is in confirmation with the finding of Jay et al. (1991). He had reported the same while classifying coconut cultivars based on leaf polyphenols. He suggests that the appearance of dwarfism, on the species historic scale, is a relatively recent phenomenon. It can be concluded from the above experiments that the genotypes included in cluster II and VII hold good promise as parents to use in selection and hybridization programme. Acknowledgment The first author thanks Tamil Nadu Agricultural University for their financial support by TNAU merit scholarship/research assistantship. Reference Balakrishan, P.C and Namboodiri, K.M.N. (1987) Genetic divergence in coconut varieties. Coconut Journal. 18: 13-17. Jay, M., Bourdeix, R. and Portier, F. (1991). Polymorphism of coconut leaf pofyphenols. Coconut Breeding and Management (Eds.) E.G.Silas et al., KAU.Vellanikkara.Thrissur. pp.60-68. Kumaran, P.M., Koshy, P.K., Arunachalam, V., Niral, V. and Parthasarathy, V.A. (2000). Biometric clustering of coconut populations of three Indian Ocean islands.pp 73-81. Recent Advances in Plantation crops
A. Thanga Hemavathy and K.Balaji
Research. PLACROSYM XIII 1998 (Eds.) N.Muraleedharan et al. Liyanage, D.V and Abeywardena, V. (1957). Correlation between seed nuts, seedlings and adult palm characters in coconut. Trop. Agriculturist. 113: 1-16. Mahalanbois, P.C. (1936). On the generalized distance in statistics. Proc. Natl. Inst. Sci.India. 2: 49-55. Murthy, B.R and Arunachalam, V. (1996). The nature of divergence in relation to breeding systems in some crop plants. Indian J. of Genetic. 26(7) : 188-198. N’cho, Y.P., and Sangare, N., Bourdiex. R., Bonnot, F. and Baudouin, L. (1993). Assessment of a new coconut ecotypes a biometrical approach study of tall population. Olegineux 48: 121-132. Narayana, G.V and John, CM. (1942). Annual Report of ARS, Kasaragod for the year 1940-41. Report on the work of Agricultural Station in Madras Presidency for 1940-41. pp. 415-416. Ovarasu, T. (1998). Preliminary analysis of coconut germplasm in papua new Guinea. ICIAR Technical Bulletin. 53: 33-40. Rao, E.V.V.B. and Pillai, R.V. (1983). Characterization of Coconut germplasm based on fruit component analysis. Proc. PLACROYSM.V 1982. Kasaragod, India pp-112-124. Rao, G.R. (1952). Advanced statistical methods in biometrical research. John Wiley and Sons, New york. Sugimura, Y., Itano, M., Salud (D.) Otsuji and Yamaguchi, H. (1997). Biometric analysis on diversity of coconut palm. Euphytica, 98: 29-35. Zizumbo-villarreal, D. and Pinerio. (1998). Pattern of morphological variation and diversity of Cocos nucifera (Arecaceae) in Mexico. American J. Boteny. 84: 855-865.